XAUUSD Today’s second trade opportunity comes from the XAUUSD pair.
Out of the two trades we opened yesterday on Gold, one hit TP, while the other unfortunately hit SL — although I was quite confident in that setup. No worries… This is the FX market, and opportunities are endless.
Once again, today I’ve spotted a promising buy setup on XAUUSD, and the trade is currently active on my side.
🔍 Trade Details:
✔️ Timeframe: 15-Minute
✔️ Risk-to-Reward Ratio: 1:1.50 / 1:2
✔️ Trade Direction: Buy
✔️ Entry Price: 3356.62
✔️ Take Profit: 3365.93
✔️ Stop Loss: 3351.97
🔔 Disclaimer: This is not financial advice. I’m simply sharing a trade I’ve taken based on my personal trading system, strictly for educational and illustrative purposes.
📌 Interested in a systematic, data-driven trading approach?
💡 Follow the page and turn on notifications to stay updated on future trade setups and advanced market insights.
Trend

Potential reversalAs always we must look for channels in which price is moving on a bigger timeframe, this one is in 4h candles giving a good medium term channel which it has respected at least 2 times before, so my idea is to wait for a breakout and retest or a reasonable rejection at this point positioning trades following price as we allways say.... don't go against the trend!

XAUUSD A few hours ago, the gold trade I shared closed with a profit. Congratulations to everyone who took advantage of it. We've now seen a slight pullback, and I'm seizing the opportunity by opening another sell trade on XAUUSD — here are the details for those interested:
🔍 Trade Details:
✔️ Timeframe: 15-Minute
✔️ Risk-to-Reward Ratio: 1:1.50
✔️ Trade Direction: Sell
✔️ Entry Price: 3348.32
✔️ Take Profit: 3339.69
✔️ Stop Loss: 3354.06
🔔 Disclaimer: This is not financial advice. I’m simply sharing a trade I’ve taken based on my personal trading system, strictly for educational and illustrative purposes.
📌 Interested in a systematic, data-driven trading approach?
💡 Follow the page and turn on notifications to stay updated on future trade setups and advanced market insights.

USDCHF SELL IDEAUSDCHF is Ready to continue It's SELL Move to the higher time frame recent swing low of 0.803.
SELL IDEA BREAKDOWN;
Weekly is bearish and price is moving closer to the 0.803 swing low.
Daily is also bearish, price is moving towards the weekly swing low.
4HR had a bearish break in market structure, followed by a retest of the recent swing low that was broken by price to give MSS.
My entry was taken after the formation of a swing low and price is done retesting the old low.
This is a continuation trade.

ZEC CAN GO TO $100 TARGET Zec is able to get a confirmation in the coming time frames and to break to $100
Will this be the next break level as omisego did?
We will follow the trend.

SUI NEW VOLUME UPCOMINGSUI shows on a low time frame new upcoming volume, which can allow SUI to break soon.

Review and plan for 2nd June 2025 Nifty future and banknifty future analysis and intraday plan in kannada.
This video is for information/education purpose only. you are 100% responsible for any actions you take by reading/viewing this post.
please consult your financial advisor before taking any action.
----Vinaykumar hiremath, CMT

is WLD READY FOR NEW CYCLE to $4Worldcoin looks to have new data, which could mean a new cycle is on processing.
Low time frame focus target $1,70

Kava : Day trade volumeKava can show new volume on day trade volume. We will follow this coin in the coming time frames for the uptrend.


Gold - Correction Phase Extended!Hello TradingView Family / Fellow Traders. This is Richard, also known as theSignalyst.
📈 As per our latest Gold analysis, price rejected the $3,100 – $3,150 support zone and traded higher.
However, Gold is still in a correction phase, moving within a falling red channel.
This week, it has been rejecting the upper bound of the channel, reinforcing bearish pressure.
⛔ As long as the upper red trendline holds, the bears remain in control.
✅ For momentum to shift back in favor of the bulls, a clear break above the upper red trendline is needed.
📚 Always follow your trading plan regarding entry, risk management, and trade management.
Good luck!
All Strategies Are Good; If Managed Properly!
~Rich
Disclosure: I am part of Trade Nation's Influencer program and receive a monthly fee for using their TradingView charts in my analysis.

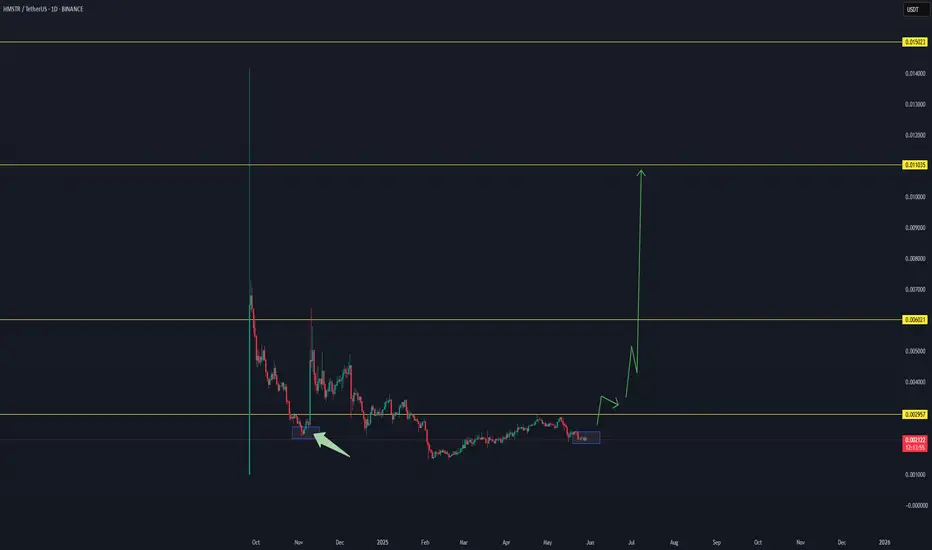
HAMSTER CAN EXPLODE TO THE MOON AS NEVER BEFORE..Depending on our study and trends, we expect with high chance that hamster is going to see a new volume in the upcoming time, which will allow this coin to increase to new levels.
These are our expected targets.
$0,0.0024
$0,006
$0,011
$0,015
This coin is at this moment in a stable time frame, and can build unexpectedly in the coming time a new break followed by a whale's increase in volume.
Time will tell if this coin will act as we expect.
There are some important reasons based on data that let us expect this coin is going to break, at last its a market, which has never 100% guarantee.
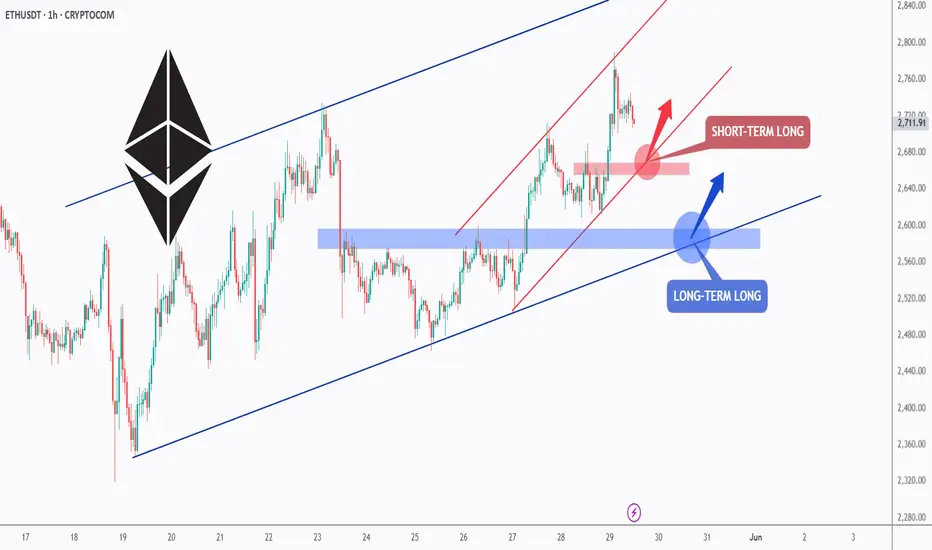
ETH - Long Anyway, Short-term and Long-term!Hello TradingView Family / Fellow Traders. This is Richard, also known as theSignalyst.
📈ETH has been overall bullish trading within the rising blue channel from a long-term perspective and within the rising red channel from a short-term perspective.
Moreover, the red and blue zones are strong support and structure!
🏹 Thus, the highlighted blue and red circles are strong areas to look for buy setups as it is the intersection of the lower zone(s) and trendline(s).
📚 As per my trading style:
As #ETH approaches one of the circles, I will be looking for bullish reversal setups (like a double bottom pattern, trendline break , and so on...)
📚 Always follow your trading plan regarding entry, risk management, and trade management.
Good luck!
All Strategies Are Good; If Managed Properly!
~Rich
GBPJPY - Bearish Control, Again!Hello TradingView Family / Fellow Traders. This is Richard, also known as theSignalyst.
📉As per our last GBPJPY analysis (attached on the chart), it rejected the upper red trendline and traded lower.
What's next?
GBPJPY is currently retesting the upper bound of the falling red channel again.
Moreover, the green zone is a strong structure and resistance.
🏹 Thus, the highlighted red circle is a strong area to look for sell setups as it is the intersection of structure and upper red trendline acting as a non-horizontal resistance.
📚 As per my trading style:
As #GBPJPY is around the red circle zone, I will be looking for bearish reversal setups (like a double top pattern, trendline break , and so on...)
📚 Always follow your trading plan regarding entry, risk management, and trade management.
Good luck!
All Strategies Are Good; If Managed Properly!
~Rich
Disclosure: I am part of Trade Nation's Influencer program and receive a monthly fee for using their TradingView charts in my analysis.

BTC - Let's Do It Again!!Hello TradingView Family / Fellow Traders. This is Richard, also known as theSignalyst.
📈 As per our last analysis (attached on the chart), BTC rejected the lower orange trendline and moved higher as expected! ✅
🔄 BTC is now retesting the lower trendline again, so we’ll be looking for new trend-following buy setups as long as the red structure at $105,000 holds!
📚 Always follow your trading plan regarding entry, risk management, and trade management.
Good luck!
All Strategies Are Good; If Managed Properly!
~Rich

HMSTR/USDT NEW BREAK ON WAYHMSTR/USDT has good chance to get a new break in the coming time frames, there are some trend data that shows that HMSTR/USDT has a good change for new time frame confirmation

S/USDT Potential UpsidesHey Traders, in today's trading session we are monitoring S/USDT for a buying opportunity around 0.4300 zone, S/USDT is trading in an uptrend and currently is in a correction phase in which it is approaching the trend at 0.4300 support and resistance area.
Trade safe, Joe.

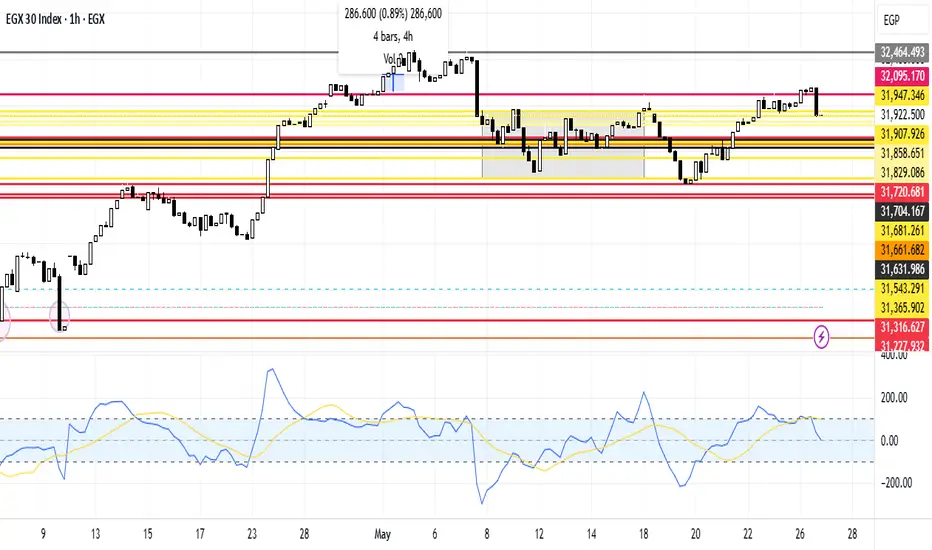
EGX30 Movement AnalysisEGX30 stock is currently in a higher region than before. Unfortunately it rebounded to the support line 31,907.926. In the case of continuing downward it's expected to reach the support line 31,858.651 then break the support line 31,829.086. In case of taking an upward trend, it is expected to breach the resistance line at 31,907.926 and then reach the resistance line at 31,947.346. And reach the third resistance line at 32,095.170 points.
CHESS.USDT NEW INCREASE ROUNDEAs a trader, it's important to follow the market and the unexpected trends.
CHESS/USDT shows a possibility for a new increase in the coming time frames, after the long-term breakdown.
Let's follow the data and see if this coin is able to increase as the chart shows.
interesting to follow for the coming time frames for new confirmations.
$0,10 is an important target that this coin could hit in the coming time.
If the cycle gets confirmed, this coin could go to $0,25 as a high target and $0,35 as a best target.
In trading, never expect instant results; the market goes as it needs to go.
Risk management is the key.

ETH - BBB - Bullish Building Block!Hello TradingView Family / Fellow Traders. This is Richard, also known as theSignalyst.
🏢 ETH Building Blocks:
📈 Short-Term Bullish:
ETH is currently bullish trading within the second floor in the shape of a rising channel marked in green.
As ETH retests the lower green trendline and $2,550 structure, we’ll be looking for short-term trend-following long setups!
📈 Long-Term Bullish:
For the bulls to remain in control medium-term and push towards the $3,000 mark, a break above the last major high at $2,750 is needed.
📉 Short-Term Bearish:
If the $2,550 structure is broken downward, ETH's momentum will be shifted from bullish to bearish leading to a correction phase towards the $2,300 support.
📚 Always follow your trading plan regarding entry, risk management, and trade management.
Good luck!
All Strategies Are Good; If Managed Properly!
~Rich

$SNOW $200 target, sooner than laterHello. Not much analysis here besides a monster gut feeling. NYSE:SNOW has earnings May 21. I’m looking to get in $200c for May 16 expiration. For some reason this name can’t scorch $200 and I believe it should. If NASDAQ:CRWD moves the way it does so can $SNOW. I think it’s made a strong support and mental level at $150. I was apart of the latest push to $180-$190 before its most recent earnings which jolted it from $150s to $180 AND it got sent back to that $150 to $160 level. I think this is a high conviction swing especially into earnings; premiums can go up off the IV.
NFA.
WSL.

BTC - New Impulse Soon!Hello TradingView Family / Fellow Traders. This is Richard, also known as theSignalyst.
📈 BTC has been bullish, trading within the rising channel marked in orange. 🟧
In a typical trend, corrections are usually bearish. 🔻
However, in BTC’s case, the correction phases marked in red are flat — a strong signal that the bulls are in control 💪 and not allowing the bears to trigger a classic pullback.
As long as BTC holds within the rising orange channel, we expect the next impulse phase to kick off soon 🚀 — aiming for the $115,000 round number. 🎯
This move will be confirmed once BTC breaks above the current flat correction zone marked in red. ✅
📚 Always follow your trading plan regarding entry, risk management, and trade management.
Good luck!
All Strategies Are Good; If Managed Properly!
~Rich

NEAR is here to stay!Hello TradingView Family / Fellow Traders. This is Richard, also known as theSignalyst.
After breaking above the falling wedge pattern, CBOE:NEAR has been overall bullish, trading within a rising broadening wedge 🔼 marked in blue and red.
📉 As it approaches the lower bound of the wedge — which perfectly intersects with the green support zone — we’ll be watching for short-term long opportunities 🎯.
From a long-term perspective, for the bulls to fully take control, a break above the $3.6 resistance is needed to confirm the next bullish wave 🚀.
📚 Always follow your trading plan regarding entry, risk management, and trade management.
Good luck!
All Strategies Are Good; If Managed Properly!
~Rich
