#NIFTY Intraday Support and Resistance Levels - 01/12/2023Nifty will be gap up opening in today's session. After opening nifty sustain above 20150 level and then possible upside rally up to 20270 in today's session. in case nifty trades below 20110 level then the downside target can go up to the 19980 level.
Trendanalyisis

OIL - BRENTAs both institutional and retail traders await the OPEC + Meeting later today, we see technically the chart pattern and indicates an inverse head and shoulder and market is expected to break trendline and continue in the upward trend

Brent Crude Oil🛢️Outlook: Navigating The Next Huge Move (4H)Brent Crude Oil Forecast 🛢️ TVC:UKOIL
Just like we called it earlier, the price dropped from 82.00 to 79, hitting our Take Profit sweet spot.
Now, even though the price popped above 81, it couldn't make higher high, and it's chilling below the 100-day moving average on the 4-hour chart.
Looks like we might see it slide back from 81.50 - 82.00 to 80. If 80 can't hold its ground, we might be looking at a dip to the 77 zone. On the flip side, if it manages to break above 83, we could be in for a bullish ride.
Quick heads up: Keep your eyes peeled for any surprise moves, especially with the OPEC meeting on November 30, 2023, and the ongoing tension between Palestine and Israel.
Key Levels:
Support lines: 79.00 & 76.00
Resistance lines: 83.00 & 84.64
Drop your thoughts in the comments below. Appreciate your take on this! Thanks! 🚀

Bullish run back to the ALL-TIME HIGHS?On the daily frame, we can see a clear Falling Wedge. Could we have another bullish run up to the all-time highs before a potential crash?

Crude Oil Correction - Bearish Scenario (4H)Brent Crude Oil Forecast 🛢️ TVC:UKOIL
Recent sessions saw a surge in Brent crude futures, hitting the top of a descending channel and undergoing huge correction currently. This paves the way for potential fall from 82.00 to 80 then 79.
The bearish trend remains strong as price got rejected from the 100-day moving average (4H timeframe). A break above 83 could signal bullish move.
Note: Keep an eye on unexpected movements due to Fed's meeting minutes and ongoing conflict between Palestine and Israel.
Support lines: 80.00
Resistance lines: 83.00
Comment down below your thoughts about my analysis, Thank you!

[INTRADAY] #BANKNIFTY PE & CE Levels(20/11/2023) Today will be gap up opening in BANKNIFTY . After opening if banknifty sustain above 43550 level then possible upside rally of 400-500 points upto 43950 Level.Any Major downside only expected in case banknifty starts trading below 43450 level.

BITCOIN consolidating after a big move,More bullish from SupportBTCUSD
The price made a bullish break above the Resistance area around $35,000, and price is currently trading near 37K level, price may consolidate above the support area then continue its bullish move upwards.
Trade Wisely
*The content on this analysis is subject to change at any time without notice, and is provided for the sole purpose of assisting traders to make independent investment decisions.

USDT/BTC Speculative Trading IdeaBelow is a speculative trading idea for the BTC/USDT pair.
As of writing, there’s a consolidation and price chart compression towards the established local resistance level at a price of $35,195, following an impulsive 31% price increase from $26,794 with a rebound from the 50-day moving average.
Within the framework of this idea, we propose to consider the possibility of buying BTC at a price of $35,195.
We do so with the aim of continuing the BTC price rise towards the resistance zone located near the POC volume level, corresponding to the trading range of the first half of 2022. The approximate target for this trade is $38,440.
An additional factor supporting this decision is the cumulative delta, indicating sustained buyer interest. The potential for this trade is estimated at 9%, with a stop-loss set at the 3% level, which amounts to $34,100.

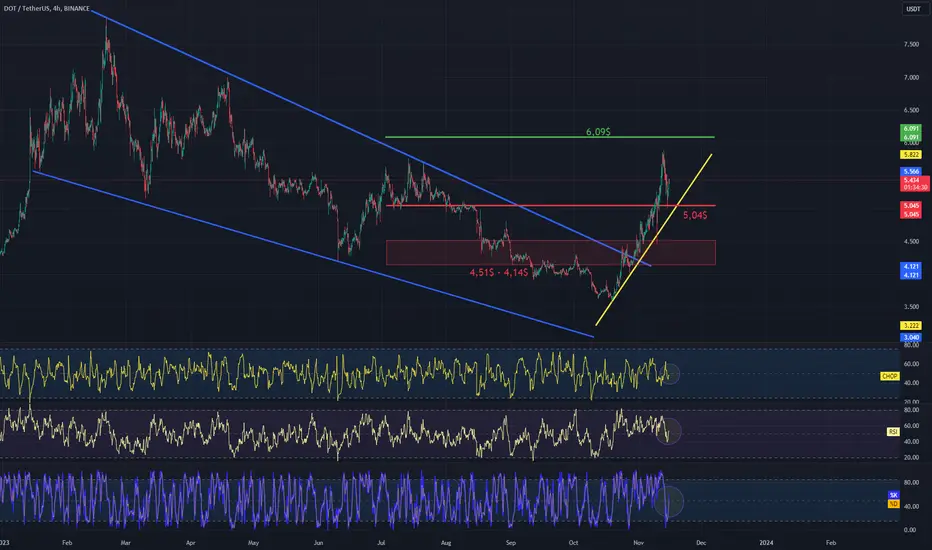
DOT/USDT 4H Interval ChartI invite you to review the chart of DOT in pair with USDT. First, we will use the blue lines to mark the downward trend channel from which the price emerged with dynamic upward movements, moving along the locally created upward trend line.
Going further, we can move on to marking support areas when we start a larger correction. however, here we have significant support at the level of $5.04, which has kept the price from further declines for now, only after it is broken, we can see the price return to the support zone from $4.51 to $4.14.
Looking the other way, for now, an important level for further increases is the resistance at the price of $6.09; only after it is overcome and positively tested will we be able to see attempts at further increases in the DOT price.
Please look at the CHOP index, which indicates that there is still energy to make a move, the RSI indicator shows a visible rebound, adding the STOCH indicator, which shows a reflection from the lower end of the range and visible room for growth, we can see a continuation of the upward movement before the upcoming correction.
Bullish Flag Pattern breakout in MFSLMAX FINANCE SERVICE LTD
Key highlights: 💡⚡
✅On 1Day Time Frame Stock Showing Breakout of Bullish Flag Pattern.
✅ Strong Bullish Candlestick Form on this timeframe.
✅It can give movement up to the Breakout target of 1135+.
✅Can Go Long in this stock by placing a stop loss below 871-.

EURCHF above support, price to move higher towards 0.9800 levelEURCHF
The price is currently above support/resistance structure, after a pullback if price holds above the support I expect the price to move higher...
Trade Wisely
*The content on this analysis is subject to change at any time without notice, and is provided for the sole purpose of assisting traders to make independent investment decisions.

ETH getting ready to drop to some massive supportSure, there is upside to 1780 and it could keep climbing, but I think we're going to see it drop before that occurs. There is a support trend heading in the bearish direction
Then you have two really weak resistance lines developing on short term charts. Which makes me think it's about to see a drop off of those and then head to the bearish support trend.
This is the best part because a lot of trends are leading to the same spot, which is a massive support trend climbing in the bullish direction.
Personally, I see a fast movement down and then the next movement taking the price to 1745-1780 before coming back down to test 1690 again.
Price target is more important, the 1608 target, the 1680 rejection, and the 1700+ line.
I'll likely keep the updated price targets for this chart on my site, but otherwise, you'll need a new chart should the 1608 line fail or should the green trend break, which is a BIG time exit point trigger.

EurCad AnalysisAs we see... our HTF Order block Successfully reacted.... and now we are moving to our extreme order which gives higher possibility to enter the trade....

Lets make a BottomBounceIndicator today=Step by step annotated=
Today, I am going to try something different. Let's make a Bottom Bounce Indicator. What is a bottom bounce? Bottom Bounce is a move I saw when analyzing a massive drop. The move caught my eye and has become a staple in how I find and catch a falling Knife. I have my weaknesses and demons just like anyone else. I am severely impatient and extremely an emotional creature by nature.
**Fun Fact**
There are two (technically three if you combine them and care about people in general) but for our purposes there are two ways to make a decision in life.
Logical: Everyone has done this before:
You want to buy a new car(substitute with whatever gets the juices flowing).
You go online, you do your research and you come up with these things that are going to be absolute in your buying decision:
Year, Make , Model of vehicle you want
Color, style, package, interior
Must have features as an absolute! Like Sunroof
Dealership you will purchase from (normally closets one because people are lazy and like getting taken advantage of)
Price you will pay.(if they knew the invoice it would be that because people don't need to make profits on things that cost $20k+) “oh, you guys will make it back on someone else” (Because everyone believes they are that one person that is above everyone else and deserves things for free) I=(
Trade value you won't take a penny less for. (because for some reason everyone believes their car is in Great Condition and showcase ready)
Bank they will get their money from or Cash they have to spend(Usually if its cash it's some absurd perfect trade and absolute negative deal that makes the amount of money they have just right.) ;: )
Interest rate they will get
Amount of money they will put down
Years they will finance
**I think that covers most of it*** (boy im really going deep into this scenario….)
Here is where reality sets in…
You show up to the dealership and you tell the sales person you are just looking around. (Because you love being tortured by salesmen and you felt, “ hey I don’t get much free time let's go to the dealership and be harassed by salesman” (sounds about right) Finally, you grace the salesman with the right to show you a vehicle.
You tell them everything above about the car you want.
2024 Lexus RC350 f package White with Red interior $54,072 +++
Emotional Decision:
While on your much deserved test drive you start to take ownership of this finely crafted out of the most premium of premium hand stitched leather seats and steering wheel, wait what's that the shifter also has the same leather on it. And look at that dash it moves when I start the car! Push button Start, and the LEDS! Sunroof, Navi, Surround Sound, and OMG the seats are like Hugging me!
Who cares about Covid and being isolated from people when I can be hugged by this seat! Heated and AC, WHAT! Of course my Honda has it but not like this!
The steering wheel doesn’t even shake at like 100 mph, ok the salesman is scared….let me get a hold of myself.
Trade Details:
Trade: 2020 Honda Accord EXL Black with gray interior
55k miles regular maintenance (obvs right before the major 60k mile checkup)
tires have been changed once.
No Wrecks one owner. New was around $32-34k
4 years old 15k miles ish/yr
The decision:
Location: Local Lexus Dealership inside sitting down looking at numbers…
The mood: Serious
During the test drive you:
Fell in love hard for the vehicle
Fun fact: you can't see the outside from the inside.
Lexus doesn't make cheap interiors so it doesn't matter the color as it looks way better than the “Cord”.
While Driving you started thinking:
You know I got that bonus and haven’t touched it, I could put that down as well.
I mean I could pay another $100 a month for this.
I didn’t think I would like the Blue but I actually love it!
Black is so hot but really they are all hot! As far as interiors go.
If I could finance this through them, maybe I’ll get a rebate or something and then just refinance it with my bank so I don't have to wait and I can drive home today!
Emotional Decisions: replace all logic and throw it out the window, think of it like an extremely efficient Moving company with a crew of like 15 jacked dudes and pull up in an envoy that is reminiscent of a Military Convoy. And literally toss everything you have out the door and windows and load up, take off in less than 15 mins.
Then what happens next is they bring in the Decor team which is made up of like every reality show Fix it and ditch it Home Renovation Show put together and within the next 5 mins they fill your home full of new IDEAS! YAY!
Back at negotiations:
You stand Firm and You tell him with a serious VOICE that you will buy it for 84 months $ 690 with $5k down and that you will take $18k for your trade and not a penny less!
Finance through them for the rebate but really so you can drive home today. Interest Rate: 7.99%
All for the Vehicle you test drove:
2024 Lexus RC350 f package Blue with black interior $53,761++
After a few hours you finally walk out to see your brand New Car and get handed the 3 C’s =
See your Car
See your Keys
See you Later!
And that my friends is how emotion will destroy your logic every time!
By iCantw84it
10.30.23
In 2 days its my bday give me a Bday Gift I love Boosts! Plus they are free, if you found this somewhat entertaining, and educational pls like follow and BOOST! Thanks!
*** btw if you want to know the 3rd way just shoot me a message and a
*** btw if you want to know the 3rd way just shoot me a message and I’ll let you know.

AUDCHF looks strong down STILLLook at Weekly.
Last weekly closed and traped buyers trader (for me)
8.10.2023 On Monday maybe a little bit up (Look at my lower analysis) and next will be running down.
Structures On Daily, H4 is pretty Down

Uptrend Channel breakdown in INDUSINDBKINDUSIND BANK LTD
Key highlights: 💡⚡
✅On 1Hour Time Frame Stock Showing Breakdown of Uptrend Channel Pattern .
✅ Strong bearish Candlestick Form on this timeframe.
✅It can give movement up to the Breakdown target of 1369-.
✅Can Go short in this stock by placing a stop loss above 1443+.

GOLD 1H CHARTIn light of the inherent instability accompanying geopolitical conflict, gold has historically served as a favoured haven for investors seeking a refuge of stability. Notably, gold has witnessed a marked upsurge in value since the preceding week, with indications suggesting a continued ascent.
Turning our focus to the first-half analysis, we can delineate two potential scenarios:
Upon reaching the price range of 1983-1985, should any bearish signals materialize, it may warrant considering a short position with a target in the vicinity of 1965.
Conversely, in the event of a breach beyond the 1985 threshold, the path may pave the way for an ascent towards the 2000 mark.
It is paramount to highlight the importance of maintaining a flexible approach, refraining from attachment to positions, and aligning one's strategy with the flow of the markets.
Best of luck trading this week!

Hellena | USD/JPY (4H): Long to resistance area at 150.suggesting that the upward movement is not yet over. I expect a retest of the area of 50% - 61.8% Fibonacci levels in the area of 148.932, after which I expect the price to rise to the resistance area of 150.150.
Manage your capital correctly and competently! Only enter trades based on reliable patterns!

Niftybank ViewHello everyone,
As we see in last trading session Niftybank shows downward momentum loosing 500points and taking support at our marked trendline.
If it breaks the trendline,then we can expects it's initial support at 43400 level while if it begins to show upward momentum then most probability is that it will touch near 45000 Resistance level .
However, there is a huge selling in option index excluding Nifty Midcap Select because it's data closed positively. We can assume that buying activities are going in Nifty Midcap Select. Cash data was also positive depicting positive momentum.
So here we close our statement.
Have a happy trading.

Ascending Triangle pattern breakout in GODREJCPGODREJ CONSUMER PRODUCTS LTD
Key highlights: 💡⚡
✅On 1Hour Time Frame Stock Showing Breakout of Ascending triangle Pattern.
✅Strong Bullish Candlestick Form on this timeframe.
✅It can give movement up to the Breakout target of 1012+.
✅Can Go Long in this stock by placing a stop loss below 979-.

NVDA Bullish Week 10/16/23Expectations for Nvidia: Bullish
Stop Loss: 449.12 (indicated by red dash line)
Take Profit: 469.12 (Bonus- 470.51)
Support and resistance areas this week indicated by orange lines.
Prepare > Prediction

NDQ100 Bullish Week 10/16/23Expectations for Nasdaq: Bullish
Stop Loss: 14964.25 (indicated by red dash line)
Take Profit: 15404.63 (Bonus- 15474.63)
Support and resistance areas this week indicated by orange lines.
Prepare > Prediction

USDJPY Bearish Week 10/16/23Expectations for USDJPY: Bearish
Stop Loss: 149.764 (indicated by red dash line)
Take Profit: 148.364 (Bonus- 147.844)
Support and resistance areas this week indicated by orange lines.
Prepare > Prediction
