BTC 4H Interval Review ChartHello everyone, I invite you to review the current situation of BTC in the USDT pair, taking into account the four-hour interval. First, we will use the yellow line to mark the local downward trend line from which the price came out at the top.
It is worth mentioning that the place where the downtrend line was left is also the place where the yellow Ema Cross 50 line crossed the blue Ema Cross 200 line from below, thus confirming the return to a strong upward trend.
Now we can move on to marking support areas in case the correction deepens. And here, using the trend based fib extension tool, we will mark a very strong support zone from $30,996 to $29,839, but if the support does not hold the price, we still have support at $28,332.
Looking the other way, we can determine resistance areas in a similar way. However, here we will mark the resistance at $36,303, which is a very strong resistance that the price must face before we move towards $40,000.
Please pay attention to the CHOP index, which indicates that a lot of energy has accumulated, on the RSI indicator, despite the recovery, there is room for a further decline, but at this point you should add the STOCH indicator, which shows that the energy in the downward movement is running out, which may result in the opposite direction and the price increases again.
Trendanalyse

BNB/USDT 1H Interval ReviewHello everyone, let's take a look at the BNB to USDT chart taking into account the one hour time frame. As you can see, the price is moving above the local downtrend line.
After unfolding the Fib Retracement grid, we will mark a support zone from $224 to $221, while we still have support at $218.
Looking the other way, you can see that the price has moved back through the resistance zone from $230 to $234, and then we have resistance at $238.
Looking at the CHOP indicator, we can see that there is still some energy left for a move, on the RSI indicator, despite the recovery, there is still room for a decline, and on the STOCH indicator, we have room for the price to go lower.

ETH/USDT 4H Chart ReviewHello everyone, let's take a look at the ETH to USDT chart on a 4-hour time frame. As you can see, the price is moving above the local uptrend line.
When we unfold the trend based fib extension grid, we will see that the price has returned to the support zone from $1,774 to $1,745, but if the support does not maintain the price, we still have a second zone from $1,675 to $1,623.
Looking the other way, we can see a fight with a strong resistance zone from $1,846 to $1,897, while we still have a second strong zone from $1,979 to $2,037.
Looking at the CHOP indicator, we see that the energy has been restored, the RSI shows a visible recovery with room for further decline, but the STOCH indicator is approaching the lower limit, which may limit the declines and result in another price increase.

[INTRADAY] #BANKNIFTY PE & CE Levels(26/10/2023) Today will be gap down opening in BANKNIFTY . After opening if banknifty start trading below 42950 level then possible downside rally of 400-500 points upto 42550 Level. And this rally can extend for another 400 points if it gives breakdown of 42450 level. Any Major upside only expected in case banknifty starts trading above 43050 level.

LTC/USDT 1D ReviewI invite you to review the LTC/USDT chart. Starting with the blue lines marking the upward trend channel from which the price broke down, but locally you can see a sideways exit from the yellow downward trend line.
In order to determine support for the price, we will use the Fib Retracement tool and thanks to it we can see that the price is struggling to climb out of the strong support zone from $68.86 to $56.22. If the current zone did not support the price, we could see a decline to the area support at $40.26.
Looking the other way, we can similarly determine the resistance areas that the price must face. And here we see that the first significant resistance is at $78.72, and then we have a strong resistance zone from $92.60 to $102.46.
The CHOP index indicates that there is still some energy left for the move, the RSI indicator has a slight recovery and there is room for the price to go a little higher, when we look at the STOCH indicator we see that it has exceeded the upper limit, which influenced the recovery, but in combination with the RSI indicator it may be slight recovery and another increase in the LTC price.

ETH/USDT 1DInterval Review ChartHello everyone, I invite you to review the ETH pair to USDT chart, also on a one-day time frame. First, we can use the blue lines to mark the upward trend channel in which the price is currently moving. However, locally it is visible that the price has moved above the downward trend line.
Now let's move on to marking the support places. We will use the Fib Retracement tool to mark supports, and as you can see, the first support zone is from $1,671 to $1,517, but if this support does not hold the price, we may see a drop to the area of the second zone from $1,363 to $1,156.
Looking the other way, we can similarly mark places where the price should encounter resistance on the way up. And here we can immediately notice that the price is approaching a very strong resistance zone from $1,916 to $2,230, only when it breaks above it will it be able to move towards the resistance at $2,557.
When we turn on EMA Cross 50 and 200, we can see that the price has returned above the blue line of the 200 moving average, but it is worth watching whether the yellow line of EMA Cross 50 will cross the blue line from below, which would confirm a strong upward trend.
The CHOP Index indicates that most of the energy has been used. The RSI indicator is approaching the upper limit and it is clear that there is some room for growth, but the STOCH indicator exceeded the upper limit and this resulted in a slight price recovery.

BTC/USDT 1D Interwal 40000$ or 31000$Hello everyone, I invite you to review the current situation on the BTC to USDT chart, taking into account the one-day interval. We will start by marking a strong downward trend line from which the price moved sideways, and currently we can mark the upward trend channel in which we are moving with blue lines.
Now we can move on to marking support areas in the event of a correction. And here, first of all, it is worth marking the support zone from $30,687 to $27,750, but when we fall below this zone, we may see a drop to the area of the second zone from $23,135 to $19,884.
At this point it is worth looking at the EMA Cross 50 and 200 as we can see that the yellow ema cross 50 line has returned above the blue ema cross 200 line, confirming that the strong uptrend is continuing.
Looking the other way, we can determine resistance locations in a similar way using the Fib Retracement tool. Here you can immediately see the fight against the strong resistance level at $35,931, which currently lacks the energy for a larger move, but when the price overcomes it, it will have an open path towards the strong resistance zone from $42,223 to $48,495.
Please pay attention to the CHOP index, which indicates that the energy at this moment is mostly used, the RSI and STOCH indicators clearly exceed the upper limit of the range, which may negatively affect the BTC valuation and translate into a recovery after such a dynamic increase. In such a situation, we could see a rebound towards $31,000.

Uptrend Channel breakdown in INDUSINDBKINDUSIND BANK LTD
Key highlights: 💡⚡
✅On 1Hour Time Frame Stock Showing Breakdown of Uptrend Channel Pattern .
✅ Strong bearish Candlestick Form on this timeframe.
✅It can give movement up to the Breakdown target of 1369-.
✅Can Go short in this stock by placing a stop loss above 1443+.

Reversal Bearish Flag pattern in GNFCGujarat Narmada Valley Fertilizers & Chemicals Limited
Key highlights: 💡⚡
📈 On 1week Time Frame Stock Showing Reversal of Bearish Flag Pattern.
📈 It can give movement upto the Reversal Final target of Below 562-.
📈 There have chances of breakdown of Resistance level too.
📈 After breakdown of Resistance level this stock can gives strong downside rally upto below 142-.
📈 Can Go short in this stock by placing a stop loss Above 738+.

BTC on its way to $40,000 or $31,000?Hello everyone, let's take a look at the BTC to USDT chart on a 4-hour time frame. As you can see, the price is moving above the local uptrend line.
After unfolding the trend based fib extension grid, we can see that the important support is the zone from $31,060 to $29,888, to which we can probably see a price reversal in the event of a correction, and then we have support at $28,406.
Looking the other way, we can see that the price is fighting a very strong resistance zone from $33,267 to $35,698, only when it comes out on top and tests positively will we be able to see a path towards $40,000.
Please look at the STOCH indicator, which shows that the energy is moving above the upper limit, which may also result in a price recovery.

MKR/USDT 4HInterval ReviewHello everyone, let's take a look at the MKR to USDT chart on a 4-hour time frame. As you can see, the price is moving above the local uptrend line.
When we unfold the Fib Retracement grid, we can see that the price is above the support zone from $1,487 to $1,456, and then we mark the second strong zone from $1,406 to $1,371.
Looking the other way, we see that the price is fighting in a strong resistance zone from $1,497 to $1,542, when we break out of this zone higher, the next resistance is at $1,601.
It is worth paying attention to the STOCH indicator, which shows that the energy exceeds the upper limits of the range, which may translate into a rebound in the coming hours.

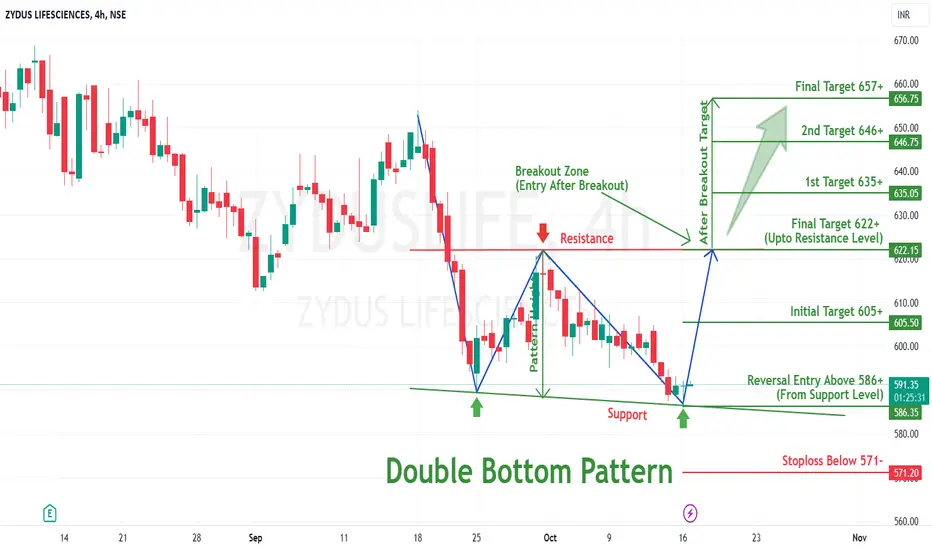
Double Bottom Pattern Reversal in ZYDUSLIFEZYDUS LIFESCIENCES LTD
Key highlights: 💡⚡
📊On 4 hour Time Frame Stock Showing Reversal of Double Bottom Pattern.
📊 It can give movement upto the Reversal target of Above 622+.
📊There have chances of Breakout of Resistance level too.
📊 After Breakout of Resistance level this stock can gives strong upside rally upto above 657+.
📊 Can Go long in this stock by placing stop loss below 571- or last swing Low.
Rising Wedge breakdown in TRENTTRENT LTD
Key highlights: 💡⚡
✅On 1Hour Time Frame Stock Showing Breakdown of Rising Wedge Pattern .
✅ Strong bearish Candlestick Form on this timeframe.
✅It can give movement up to the Breakdown target of 2017-.
✅Can Go short in this stock by placing a stop loss above 2115+.

BTC/USDT 4HInterval Review ChartHello everyone, let's take a look at the BTC to USDT chart on a 4-hour time frame. As you can see, the price is moving above the local uptrend line.
After laying out the FIb Retracement grids, we can see that first we have a support zone from $29,097 to $28,289, and then there is a second strong zone from $26,993 to $26,065.
Looking the other way, we will similarly check the current resistance levels, but here we can clearly see a strong resistance zone from $30,358 to $31,845, only after it is overcome the price will be able to go up further.
When we look at the STOCH indicator, we can see that we are in the process of recovery and there is room for the price to go slightly lower.

BNB 4HInterval Review ChartHello everyone, let's take a look at the BNB to USDT chart on a 4-hour time frame. As you can see, the price is moving above the local uptrend line.
After unfolding the Fib Retracement grid, you can see that the price is moving above the support zone from $212.5 to $210.5, then there is support at $208.5, and then a strong support zone from $205.6 to $201.9.
Looking the other way, you can see that the price is trying to attack the strong resistance zone from $214 to $217.4, when it manages to overcome it, we still have resistance at $221.6.
Looking at the CHOP indicator, we can see that the energy is slowly starting to grow, on the RSI we are moving in the upper part of the range, but looking at the STOCH indicator, we can see that the rebound took place to the middle of the range and resulted in another rebound, which slightly limited the space for a new price increase.

BNB/USDT 4HInterval Review ChartHello everyone, I invite you to review the chart of BNB in pair with USDT, on a four-hour interval. First of all, we can use the blue lines to mark the upward trend channel in which the price is currently trying to go above it for the second time.
Now let's move on to marking the support places. We will use the Fib Retracement tool to mark supports, and here we can see a strong support zone from $208.5 to $205.7, but when we fall lower, the next support is at $202.
Looking the other way, we can similarly mark places where the price should encounter resistance on the way up. And here the price was rejected by the resistance zone from $214.6 to $218.5, and then we have a second strong zone from $222 to $228.
The CHOP Index indicates that most of the energy has been used. The RSI indicator shows that we approached the upper limit, which resulted in a price recovery, similarly the STOCH indicator began to reverse after approaching the upper limit and it is clear that there is room for the price to go lower.

ETH/USDT Short-Term 15MIntervalHello everyone, let's take a look at the ETH to USDT chart on a 15 minute time frame. As you can see, the price is moving above the local uptrend line.
After unfolding the Fib Retracement grid, we can see that we have a strong support zone from $1,596 to $1,586, and further we can mark a second zone from $1,560 to $1,541.
Looking the other way, the price was again fighting against a strong resistance zone from $1,618 to $1,639, which is currently preventing the price from moving further.
Looking at the CHOP index, it seems that the current recovery is gaining energy, the RSI indicator shows a recovery, but adding the STOCH indicator to it, it is clear that there is still room for the price to go lower.

Rising Wedge breakdown in ESCORTSESCORTS KUBOTA LTD
Key highlights: 💡⚡
✅On 1Day Time Frame Stock Showing Breakdown of Rising Wedge Pattern .
✅ Strong bearish Candlestick Form on this timeframe.
✅It can give movement up to the Breakdown target of 2555-.
✅Can Go short in this stock by placing a stop loss above 3468+.

LINK/USDT 1DInterval Review ChartHello everyone, I invite you to review the LINK chart in pair with USDT, on a one-day time frame. First, we will use blue lines to mark the downward trend channel in which the price is moving upwards, while locally there is an upward trend line visible, along which the price is climbing. As we can see, it also managed to return to a strong upward trend after emerging higher from EMA Cross 200, which is important for the price to maintain this level now.
Going further, we can move on to marking support areas when the price returns to correction, and here we can see the support zone from $7.05 to $6.61, which also contains the previously mentioned 200 moving average, then we have the second zone from 6.17 $ to $5.53, followed by strong support at $4.74.
Looking the other way, we see that the price has bounced off the important resistance zone from $7.78 to $8.58, which it has no strength to break yet, there is still a strong resistance at $9.65, which the price must overcome and test positive before moving further upwards.
Please look at the CHOP index, which indicates that we have a lot of energy for the upcoming move, the RSI shows a return to the middle of the range, which creates room for a new upward move, while the STOCH indicator has rebounded to the lower limit and we have a visible upward movement with energy for it. I wish the price would go up a little higher.

BTC Chart Review 1DIntervalHello everyone, I invite you to review the situation of BTC in pair with USDT, taking into account the one-day time frame. First, we will use the yellow line to mark the downward trend lines from which the price has gone up, while locally using the blue lines we can determine the upward trend channel in which the BTC price is currently located.
Moreover, it is worth mentioning that the price has recently moved above the moving average of 200, returning to the strong upward trend, and it is important that it maintains this trend now.
Now we can move on to marking support areas in the event of a correction. And here, first of all, it is worth marking the support zone from $28,072 to $27,460, but when we fall below this zone, we may see a drop to the area of the second zone from $26,849 to $25,987, and then we have strong support at $24,861.
Looking the other way, we can determine resistance locations in a similar way using the Fib Retracement tool. And as we can see, the price is struggling to stay at the resistance level of $28,377, we still have a strong resistance zone from $29,211 to $30,365, which rejected a strong upward movement, only when we get out of this zone and it is positively tested will the path towards a strong resistance at $31,866.
Please pay attention to the CHOP index, which indicates that most of the energy has been used, on the RSI indicator we are moving in the upper part of the range, but there is room for the price to go slightly higher after this recovery, also the STOCH indicator shows that there is still some room left for the continuation of the movement.

ETH/USDT 1H Chart ReviewHello everyone, let's take a look at the ETH to USDT chart on a one hour time frame. As you can see, the price is moving above the local downtrend line.
After unfolding the Trend Based Fib Extension grid, we see that the price has retreated to the support zone from $1,582 to $1,547, and then there is a second zone from $1,518 to $1,489.
Looking the other way, first we have a resistance zone from $1,596 to $1,620, and then the price will again try to break the zone from $1,677 to $1,720.
Looking at the CHOP indicator, we see that the energy is running out, the RSI indicator shows a strong rebound, which creates room for a new increase, similarly on the STOCH indicator, we have exceeded the lower limit and we can see a new upward movement.

Ascending Triangle pattern breakout in GODREJCPGODREJ CONSUMER PRODUCTS LTD
Key highlights: 💡⚡
✅On 1Hour Time Frame Stock Showing Breakout of Ascending triangle Pattern.
✅Strong Bullish Candlestick Form on this timeframe.
✅It can give movement up to the Breakout target of 1012+.
✅Can Go Long in this stock by placing a stop loss below 979-.

#NIFTY Intraday Support and Resistance Levels - 17/10/2023Nifty will be gap up opening in today's session. After opening nifty sustain above 19770 level and then possible upside rally up to 19890 in today's session. in case nifty trades below 19720 level then the downside target can go up to the 19600 level.
