ETHUSD Multi Time Frame Trend Analysis, Profit Surging InsightsDaily Chart (1D) Overview
The daily chart reflects a powerful bullish breakout, where ETHUSD surged past prior resistance levels, now potentially turning into support. Key observations:
Support Zones:
The $2,300 to $2,400 zone has emerged as a strong demand area. This zone was previously resistance and has now flipped into support after the breakout.
A deeper retracement could potentially revisit the $1,750 to $1,850 demand area, though that would suggest a breakdown of current bullish momentum.
Resistance Zones:
The price is currently testing minor resistance around $2,600 and $2,650, with historical supply and reaction zones visible from previous consolidation.
A broader supply zone exists between $2,800 to $3,400, marked in red, which could be the next major target area if the bulls maintain momentum.
Structure:
ETH formed a higher low in late April followed by a higher high in early May, confirming a trend reversal from the earlier bearish structure.
The clean breakout from consolidation signals a fresh bullish leg, with increasing volume and momentum indicators likely aligning with upward bias.
Trend Direction: Bullish on both Daily and 4H
✅ Market Structure: Higher highs and higher lows
✅ Key Short-Term Support: $2,350 to $2,450
✅ Key Resistance Zones: $2,620 to $2,650 → $2,800 → $3,400
✅ Upside Targets:
1. Short-Term: $2,650 → $2,800
2. Medium-Term: $3,400 → $4,108
✅ Potential Retracement Levels:
3. Shallow: $2,420
4. Deeper: $2,200 and $1,850
If the price holds above $2,400, the bullish outlook remains intact, with increasing likelihood of testing higher resistance levels. However, a sustained move below $2,300 could trigger deeper retracements.
Trendanalyse

ETH is fighting in a strong resistance zone!Hello everyone, I invite you to review the current situation on ETH. When we enter the one-day interval, we can see how the ETH price came out on top from a strong downward trend.
Here we can see how the current bounce brought the movement closer to a very strong resistance zone from $ 2,090 to $ 2,310, in which we can currently observe a fight for further upward movement. Only when the price comes out on top, it can go towards resistance at $ 2,740, and then move towards strong resistance at $ 3,070.
Looking the other way, we can see that when the trend reverses, we first have support at $ 1,837, then a very strong support zone from $ 1,610 to $ 1,404 is visible, however, if this zone is broken, we can see a quick decline to the support area at $ 1,071.
On the RSI indicator we can see how strong the ETH price movement is visible intensively on the indicator and here we can see how we are approaching the upper limit, which could potentially slow down the movement or give a temporary relief.

Gold (XAU/USD) Long Setup: Capitalizing on Key Support LevelsThis setup is based on a combination of technical indicators and key support levels, which suggest a potential bullish movement in the near future.
Chart Analysis:
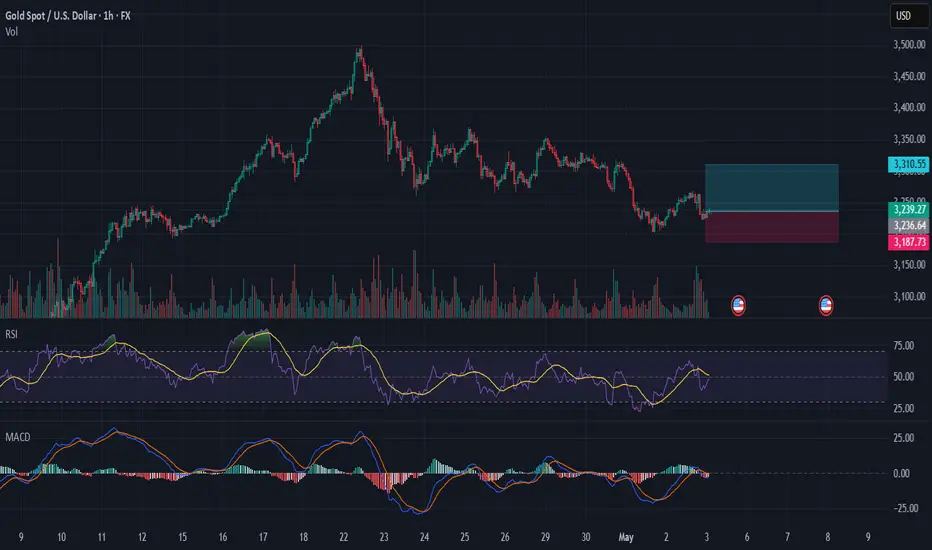
Price Action: The price of gold has been consolidating around the $3,230 level, forming a potential support zone. This consolidation phase often precedes a breakout, and we are looking for a bullish breakout from this range.
Volume: The volume indicator shows a decrease in selling pressure, which is a positive sign. Increased volume on upward price movements would confirm the bullish sentiment.
RSI (Relative Strength Index): The RSI is currently hovering around the 50 level, indicating a neutral momentum. However, a break above 50 would signal bullish momentum, and we are looking for a move towards the overbought zone (above 70).
MACD (Moving Average Convergence Divergence): The MACD line is approaching a bullish crossover with the signal line, which is a strong indication of a potential upward trend. The histogram is also showing positive divergence, adding to the bullish case.
Support and Resistance Levels: Key support levels are marked at $3,187.75 and $3,236.44. A break above these levels would confirm the bullish setup. Resistance levels are at $3,310.55 and $3,379.27, which could act as targets for the long position.
Trade Setup:
Entry: Look for a bullish breakout above the $3,236.44 support level.
Stop Loss: Place a stop loss below the recent low at $3,187.75.
Target: Aim for the resistance levels at $3,310.55 and $3,379.27.
I invite all traders to share their thoughts and insights on this setup. Your feedback and additional analysis can help refine this strategy and improve our collective understanding of the market. Let's discuss the potential outcomes and any additional indicators or patterns that could support or contradict this setup.
Don't forget to follow me for more detailed analyses and trade setups. Together, we can navigate the markets and capitalize on profitable opportunities.
Happy Trading! 🚀💸
LINK / USDT: Macro Support Zone ReachedThe price has now reached the upper boundary of the ideal macro support zone for a complex and rare corrective structure (running flat), between 11–8.5.
As long as the price holds above April’s low, my operative scenario assumes that a new multi-year uptrend (wave (3)) has already started.
Key resistance zones to watch ahead: 85–121 (first major resistance) and 150–205/220 as final macro resistance targets.
Full view of the macro structure:
Thank you for your attention and I wish you successful trading decisions!
⸻
Previous trend analysis on LINK:
Nov'24:
Jun'24:
Dec'23:

SOL/USD 1W Chart ReviewHi everyone, let's look at the 1W SOL to USD chart, in this situation we can see how the price came out sideways from the downtrend line which gave a bounce, however here it is worth paying attention to the trend line that was in force before the last price peak and here we can see that the price is still below this line.
Let's start by defining the targets for the near future that the price has to face:
T1 = 171 USD
T2 = 195 USD
Т3 = 218 USD
Т4 = 252 USD
Now let's move on to the stop-loss in case the market continues to fall:
SL1 = 134 USD
SL2 = 119 USD
SL3 = 95 USD
If we look at the RSI indicator, we can see how the bounce gave a return to the lower part of the range which still indicates that we have a lot of room to continue the started increases.

ETH gives a strong exit from the descending channel!Hello everyone, I invite you to review the current situation on ETH, because you can see a significant rebound at the level of 30% from the last low. When we enter the four-hour interval, we can see how the ETH price moved in the local downtrend channel, from which we got an exit at the top, such a scenario often gives increases at the level of the channel height, which would bring the price closer to the levels of $ 2100.
Here you can see how the current rebound brought the movement closer to the resistance at the level of $ 1830, and then resistance is visible at the price of $ 1950, where the ETH price must then face a strong resistance zone from $ 2060 to $ 2100, where there could potentially be an upward movement after leaving the channel as in this case.
Looking the other way, you can see that when the trend reverses, we first have support at the level of $ 1730, but if it is broken, the ETH price may continue to fall and return to a strong support zone from $ 1480 to $ 1380.
It is worth paying attention to the MACD and RSI indicators because you can see how in the 4H interval we have gone beyond the upper limits of the ranges, which may translate into visible price consolidation on the chart in order to cool the situation.

Will BTC emerge from the local downtrend channel on top?Hello everyone, let's look at the 1D BTC to USD chart, in this situation we can see how the price is moving in a downtrend channel in which we can currently observe an attempt to exit on the top. In such a situation, it must be borne in mind that often exiting the channel gives energy for growth close to the height of the channel itself, which in this situation could give a valuation in the region of $ 100,000 for 1 BTC.
However, before this happens, the price must positively exit the channel and break the first resistance line at $ 88,800, and then a significant level at $ 94,200.
Looking the other way, when the price bounces off the upper boundary of the channel and starts to fall again, we have a visible support zone from $ 85,150 to $ 83,000, and then a second very strong zone from $ 77,200 to $ 74,100.

Gold hovers at the All-Time High (ATH)Gold Analysis Update:
As Gold hovers at the All-Time High (ATH), it's crucial to observe how the market behaves during the London session, which is known for its high liquidity and volatility. After taking the Asian session high, the price action is now poised to potentially revisit the marked Fair Value Gap (FVG) zone.
If the market retraces to this zone and provides a bullish confirmation, such as a strong bullish candlestick pattern or a break above a key resistance level, it could set the stage for a beautiful buy-side trade setup. This would potentially offer a lucrative trading opportunity for those looking to capitalize on the ongoing bullish trend.
Let's closely monitor the price action and wait for the market to provide a clear signal before making any trading decisions.

ETH is fighting in the support zoneHello everyone, I invite you to review the current situation on ETH. When we enter the one-day interval, we can see how the ETH price moved in a strong downtrend channel. What's more, we can see that the price fell below the main uptrend line.
As we can see, the price is currently fighting to break out on top in the support zone from $ 1690 to $ 1350, in a situation if this zone was broken, we could see another strong drop to the support area at $ 884 at the previous low after the bull run.
On the other hand, if ETH gets wind in its sails again, it must first pass through the resistance zone from $ 1952 to $ 2100, while further on there is a very strong zone from $ 2500 to $ 2740.
However, here, taking into account the one-day interval, the RSI indicator shows a breakout above the top of the border, which may affect the potential end of the current uptrend.

Will BTC emerge from the descending channel on top?Hello everyone, I invite you to review the current situation on BTC. On the one-day interval, you can see how the price is moving in the downtrend channel in which there is again a fight with the upper boundary of the channel. At this stage, you can also see how the EMA Cross 50/200, they have come very close but still indicate the maintenance of a long-term upward trend.
Here you can see how the price has currently bounced off the resistance zone from $ 86,503 to $ 87,934. Only an upper exit from this zone will open the way towards the second important zone at the levels of $ 93,959 to $ 96,142, and then we have visible strong resistance around $ 101,800.
Looking the other way, you can see that in the event of further declines, we have support at $ 80,550, then you can see an important zone that previously maintained the price decline from $ 74,340 to $ 71,380, in a situation where this zone is broken, we can see a quick decline to around $ 65,360.
The MACD indicator shows an attempt to switch to an upward trend, it is worth watching whether there is enough energy for further movement.

Gold (XAUUSD) — Technical and Fundamental Analysis 2HTechnical Outlook
On the 4H chart, gold is forming a rising structure and is currently trading near the 3236–3260 resistance zone, aligned with the 1.272 Fibonacci extension. This area is expected to act as a short-term cap, with a potential corrective move ahead.
🔹 Key Levels:
Resistance: 3236, 3260
Support: 3132–3140 (trendline), 3082 (horizontal zone)
🔹 Formations:
Potential retracement setup after an extended impulse
Expected correction toward 3132–3140 (rising trendline)
If support holds, price may resume the uptrend toward 3308 (1.414 Fibonacci extension)
🔹 Indicators:
RSI near overbought zone
MACD shows momentum weakening
EMA 50/200 continue to support the bullish trend
Fundamental Drivers
Inflation concerns and soft landing expectations support safe-haven flows
Market is pricing in potential Fed rate cuts in H2 2025
Central banks continue to accumulate gold reserves
Dollar weakness provides additional support for gold prices
Scenario
Base case:
Rejection at 3236–3260 → pullback to 3132–3140 → continuation toward 3308
Alternative:
Break above 3260 → direct move to 3308.
Break below 3132 → possible slide toward 3082.

LTC/USDT 1W ChartHello everyone, I invite you to review the current situation on LTC. When we enter the one-week interval, we can see how the price is struggling to return above the upward trend lines.
Here you can see how the current rebound is going towards resistance at $ 82.82, then resistance is visible at $ 95, but an important resistance point will be around $ 115.
Looking the other way, you can see that the price has gone below the support level at $ 70, however, we could see a quick rebound, in a situation where the price continues to go down, the next very strong support is around $ 50.
It is worth looking at the RSI indicator, which shows another descent in the week interval to the level where we could previously see strong price rebounds, which could potentially repeat itself.

GOLD MONTHLY CHART LONG TERM ROUTE MAP ANALYSISMonthly Time Frame Analysis for GOLD
Dear Traders,
Attached is the Monthly Chart Route Map for GOLD. Since October 2023, we have consistently analyzed and traded GOLD with 100% target accuracy. The Golden Circle areas marked on the chart highlight our precise analysis and successful target achievements.
Key Highlights:
* After successfully hitting TP1 and TP2, the candle has closed above TP2.
* EMA5 has crossed and locked above the TP2 level at 2603, confirming upward momentum.
* The EMA5 detachment process has been completed successfully.
* As previously noted, the Fair Value Gap (FVG) provided robust support at 2535, facilitating the upward push.
What’s Next for GOLD?
Based on these confirmations, we anticipate hitting TP3 this month. However, we have identified two significant GOLDTURN levels at 2702 and 2603.
In the short term, we may see some bearish movements, but the monthly chart reveals the bigger picture: a sustained long-term bullish trend. This kind of temporary reversal strengthens the bullish trend and offers an excellent opportunity to buy at dips near support levels, reducing risk.
Recommendations:
To understand the support structure in greater detail, refer to our smaller time frame analyses, which will help you identify optimal dip-buying opportunities while keeping the long-term gaps in mind.
As always, we’ll keep you updated with daily insights. Don’t forget to check our analyses on weekly, daily, 12H, 4H, and 1H time frames.
We appreciate your continued support! Please show your encouragement by liking, commenting, and sharing this post.
The Quantum Trading Mastery

GOLD WEEKLY CHART MID/LONG RANGE ROUTE MAP UPDATEDWeekly GOLD Analysis: February 2024
Hello Traders,
Here’s a weekly chart analysis of the GOLD, offering a comprehensive view of recent market trends and future predictions. Our diligent tracking since October 2023 has consistently delivered 100% target accuracy, as evidenced by the marked Golden Circle areas on the charts. Let’s dive into the highlights and what lies ahead.
Recap of Recent Successes
Weekly Chart Highlights:
Last week, the market flawlessly followed our predictions:
* Key Level 2735 ✅ DONE
* Entry Level 2735.88 ✅ DONE
* EMA5: Crossed and locked above Entry ✅ 2735 DONE
* Bullish Target TP1: 2877 ✅ DONE
* The FVG zone around 2735 sustained bullish momentum, while resistance was broken, leading to a new all-time high of 2886.
What’s Next for GOLD? Bullish or Bearish?
We anticipate continued bullish momentum with updated GOLDTURN levels and refined targets.
Key Level: 2735 remains critical.
EMA5 Behavior:
* If EMA5 holds above 2735 and crosses/locks above TP1 (2877), the next target is TP2 (3018), followed by TP3 (3160).
* A failure to hold above 2735 could indicate bearish momentum, prices will be retesting support at 2595 in the demand zone.
Recommendations & Strategy:
* Focus on EMA5: Its behavior near 2735 and TP1 will provide clear direction for short- and long-term trades.
* Support Levels: GOLDTURN levels at 2735 and 2595 are critical for identifying reversal zones and optimal dip-buying opportunities.
* For precise entry and exit points, review our daily, 12H, 4H, and 1H analyses to navigate the market confidently.
* Slight pullbacks may occur, with potential reversals near GOLDTURN levels.
* Long-Term Outlook: The monthly chart suggests sustained bullish momentum, offering excellent opportunities for dip-buying near key support zones.
Stay Updated:
We’ll continue to share daily updates, insights, and strategies on our TradingView channel and YouTube channel every Sunday. Don’t forget to like, comment, and share to support our work and help others benefit!
The Quantum Trading Mastery

US DOLLAR at Key Support: Will Price Rebound to 103.000TVC:DXY is currently approaching an important support zone, an area where the price has previously shown bullish reactions. This level aligns closely with the psychological $100 , which tends to have strong market attention.
The recent momentum suggests that buyers could step in and drive the price higher. A bullish confirmation, such as a strong rejection pattern, bullish engulfing candles, or long lower wicks, would increase the probability of a bounce from this level. If I'm right and buyers regain control, the price could move toward the 103.00 level.
However, a breakout below this support would invalidate the bullish outlook, potentially leading to more even more downside.
This is not financial advice!

Will the support zone keep BTC falling?BTC has once again bounced off the upper border of the downtrend channel. Here, it is worth remembering the long-formed gap around $74,500, which was closed during the last decline.
Here, you can see how the price fell into a strong support zone from $77,742 to $73,980, but if this zone is broken, we can again see a strong decline around also very strong resistance and the lower border of the channel at $68,590.
Looking the other way, you can see that the increases were stopped by the resistance zone from $84,000 to $86,700, only breaking out of this zone at the top will give the possibility of growth towards strong resistance at $94,300.
The RSI is still in the lower part of the range and is again heading towards the lower borders, but here the price has formed a lower low, which can still give another reaction.

Will ETH finally change direction?ETH is approaching support at $1,559, but here you can see how the price has fallen below the upward trend line, which could have resulted in a stronger rebound. When support is broken, you can still see a strong support level at $997, to which we can see a decline.
Only when the trend changes direction will ETH have to face resistance levels at $1,889, then $2,151, and then $2,560 before we see any major upward movements.
The Stoch RSI indicator shows us moving along a line where we could previously observe strong price rebounds, while the RSI indicator itself, taking into account the interval of one weekend, shows us approaching the level we last touched during the bear market bottom.

MSTR: Mid-term and Macro Price Structure As price holds below $344, odds favor a continuation lower to retest February lows, with later potential bounce and one more push to macro-support levels: 160/150-120 (with a potential extension to 105)
(see. recent idea on BTC price structure)
If BTC and broad market indexes show signs of stabilization and short-term strength over the coming weeks with MSTR price rising above 344, the odds are shifting to a more pronounce bounce to 400-460 resistance levels.
Weekly chart:
From a macro perspective:
as long as price remains below the 460 level, I consider the bullish trend since 2008 lows to have topped in November 2024, with current price action unfolding as part of a larger corrective Wave c.4 structure. Otherwise, If price reclaims ATH the door opens for an extension to 780-1280 resistance levels.
Monthly chart
Recent idea on BTC:

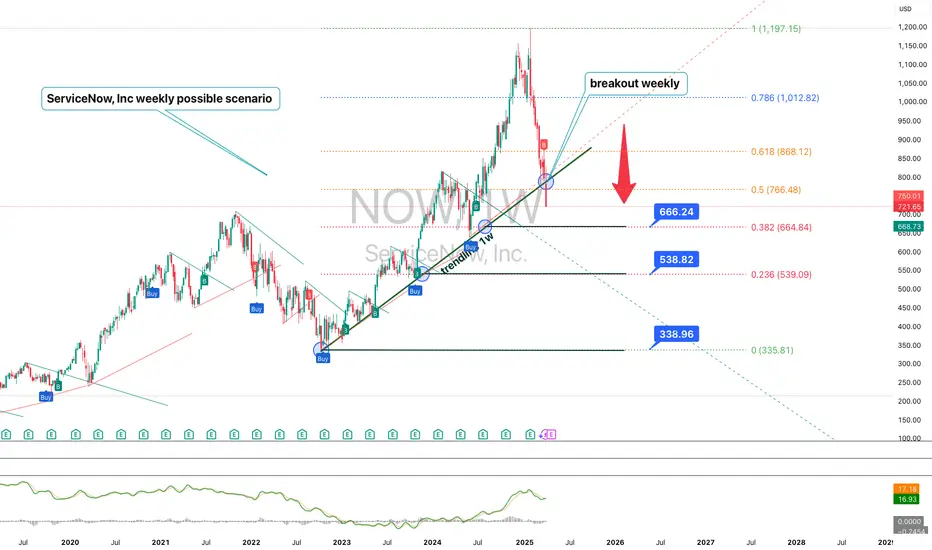
ServiceNow (NOW) – Technical and Fundamental Analysis 1WServiceNow shares have broken below a key ascending trendline on the weekly chart, strengthening the bearish outlook. The price is approaching the 666, 538, and 338 support zones, which may act as potential reversal areas. The RSI continues to decline, indicating weakening bullish momentum, while the MACD confirms a bearish crossover. EMA 50/200 suggest a rising risk of further downside.
Fundamentally, ServiceNow remains a leader in cloud-based solutions and business process automation. However, it faces pressure from rising interest rates and a possible slowdown in corporate IT spending. Valuation remains elevated, making the stock vulnerable to broader market shifts and macroeconomic headwinds. Upcoming earnings reports will be critical in determining the next move.
The main scenario suggests a drop toward 666 and 538, with a potential extension to 338. An alternative scenario would be a recovery above 766, opening the way toward 868 and 1012. A confirmed close below 666 will reinforce the bearish trend.
BTC/USD 1W chartHello everyone, I invite you to review the BTC chart to USD at 1W interval. As we can see long -term despite the current correction, the price lasts above the main line of upward trend. Going further we can see how the current correction stopped at strong support at 79221 $, however, if the support is broken, then you can see the second very strong support at $ 72085, which is close to the upward trend line.
In a situation where the trend is reversed, we have visible resistance at $ 89147, then a significant level of $ 96784 and very strong support at the level of the previous ATH. Looking at the RSI, you can see how he begins to change the direction that can change the direction of the price.

BTC - Is BTC going lower?Since the end of January 2025, BTC has been in a downtrend. However, over the last couple of weeks, BTC has been following an upward trend (rising wedge). This rising wedge has now been broken, as it tested the downward sloping trendline that has been in place since the end of January.
On the daily timeframe, the Stochastic RSI is crossing down from the overbought zone, indicating that the momentum is shifting to the downside. This suggests that bearish pressure could persist in the coming days or even weeks.
While it is possible that BTC could recover from this level and target higher prices. however, my base case is that BTC will continue to form a bearish structure over the next few days or weeks, potentially making a higher low or even a lower low. Time will reveal how the price action unfolds. Until then, the bias remains bearish unless proven otherwise.
It is important to be aware of your risk management when opening positions at this moment, as market conditions can be volatile and unpredictable.
Thanks for your support.
- Make sure to follow me so you don't miss out on the next analysis!
- Drop a like and leave a comment!

IS BTCUSD BULLSIH FROM HERE ?🚀 BTC/USD Trading Idea - Let's Catch This Move! 🚀
Hello, traders! This is my first BTC/USD idea here, and I’m excited to share my analysis with you all. I’ve been trading BTC/USD since 2020, and I created this platform to provide valuable market insights, free education, and profitable trade setups—all for free! 📈✨
Now, let’s dive into the technical breakdown
📌 Market Overview
🔸 Since Friday night, BTC/USD has been consolidating throughout Saturday.
🔸 We observed a liquidity sweep at 83,755 on the 30-minute timeframe.
🔸 According to my strategy, once lows are swept, we shift to the 1-minute timeframe to find a valid Change of Character (ChoCh).
📌 Trade Setup
✅ After spotting a valid ChoCh, we identified a strong Order Block (OB) at 83,741.
✅ Our entry point is at 83,755 with a tight stop-loss of 30 pips (83,441).
✅ The target is 84,541, offering a solid 1:2.5 RR ratio.
📊 Main Chart: A 30M timeframe marking the liquidity sweep, and a 1M screenshot showing our precise entry
🟢 Bias: Bullish
⚠️ Don’t forget to secure profits after +30 pips!
📌 Trade Details
📍 Buy Limit: 83,755
📍 Stop-Loss: 83,441 (-30 pips)
📍 Take-Profit: 84,541 (+80 pips)
Let’s bank some profits! 💰🔥 #BTCUSD #CryptoTrading #PriceAction #LiquiditySweep

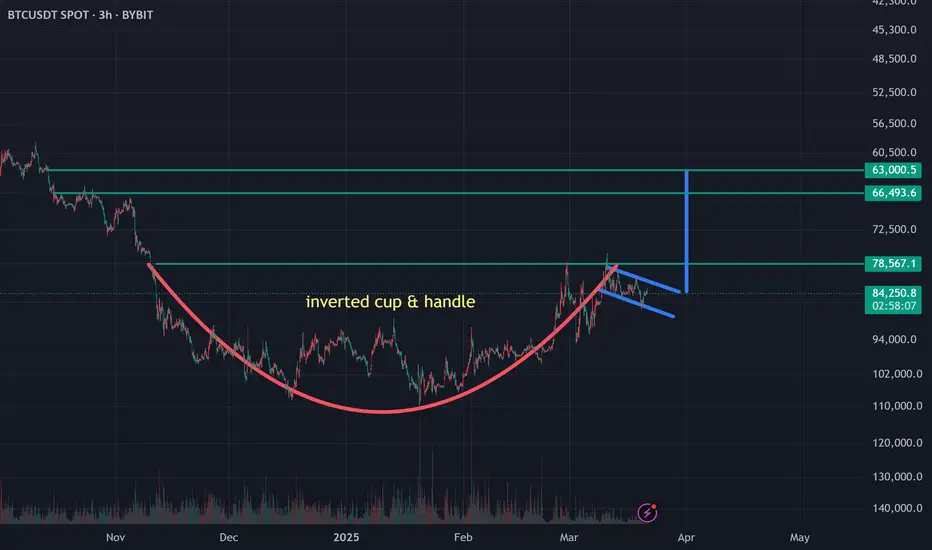
Bitcoin Inverted Cup & handle Bitcoin is forming an inverted Cup & handle pattern with a target of 63k-66k. I was surprised to see this when I inverted the chart. Just sharing with you what I see, and I hope the pattern changes and we continue to go up. However the highest probability at the moment is further downside, but we may still have a bounce toward 89k-91K before seeing the blood.