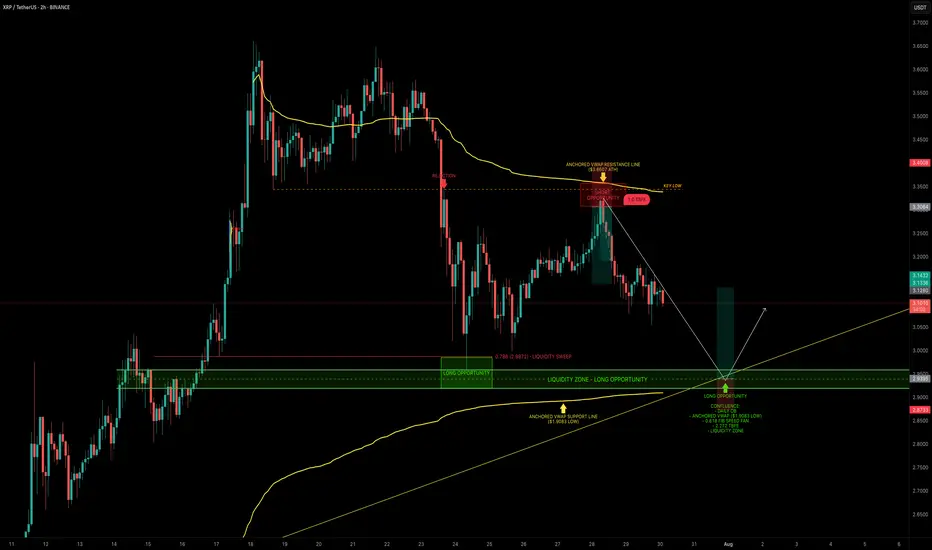
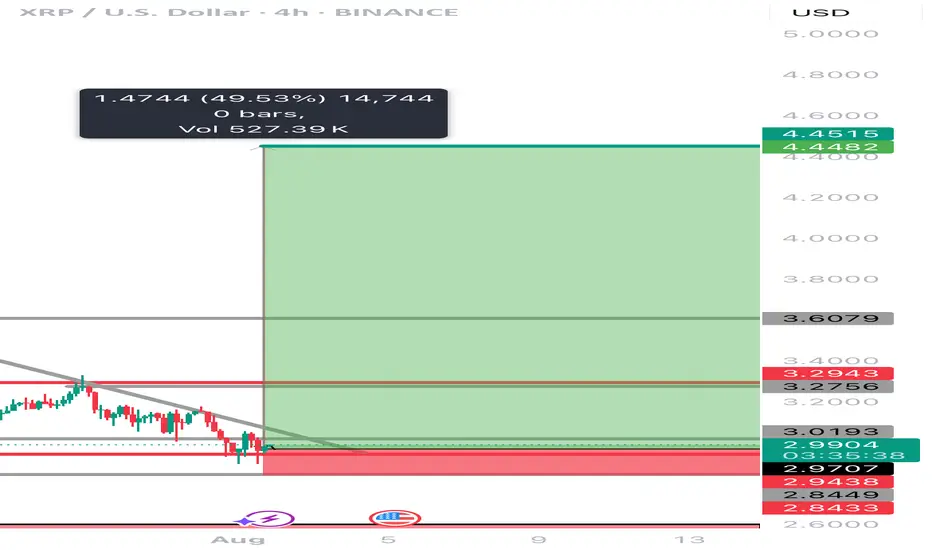
XRP — Mapping Out the Next High-Probability Long SetupXRP continues to respect key levels, delivering clean setups and strong technical reactions.
📉 Recent Price Action Recap
After the flush from $3.65 into the $3.00 support zone, XRP printed a solid bounce back toward the $3.30 resistance area, forming a clean short setup between $3.30–$3.35.
Price is now trading mid-range within the 6-day consolidation.
🟢 Next High-Probability Long Setup
A prime long opportunity lies between $2.96 and $2.9175 sitting within a key daily order block.
Confluence at this zone includes:
Liquidity pool just below the $2.9555 swing low
Anchored VWAP from the $1.9083 swing low resting just under the block
0.618 Fib Speed Fan lining up as dynamic support (July 30 – Aug 2)
2.272 Trend-Based Fib Extension at $2.9297
📈 Long Trade Setup
Entry Zone: $2.96 – $2.9175
Stop Loss: Below anchored VWAP (clear invalidation)
Target: $3.1/$3.13+
R:R: ~1:3+
💡 Educational Insight
This setup is a great example of how multiple tools layered together (like Fibonacci levels, VWAPs, order blocks and liquidity zones) can significantly increase the probability of a trade playing out.
When structure, volume-based tools and time alignment all point to the same area, it creates a high-confluence trade zone. These are the areas where risk is most defined and reward is most favourable, a principle every technical trader should anchor their strategy around.
_________________________________
💬 If you found this helpful, drop a like and comment!
Want breakdowns of other charts? Leave your requests below.
Trend Analysis
127-128k incoming ( altcoins round ? )Hi, Bitcoin seems to have completed its short term Elliott wave 4 correction and the price action analysis also confirms that this time Bitcoin will be able to break the 120-119 resistance, I predict Bitcoin to make a new high around 127-128. Altcoins have not grown that much yet and if the price can make a reliable consolidation above 120k, altcoins will start to rise.

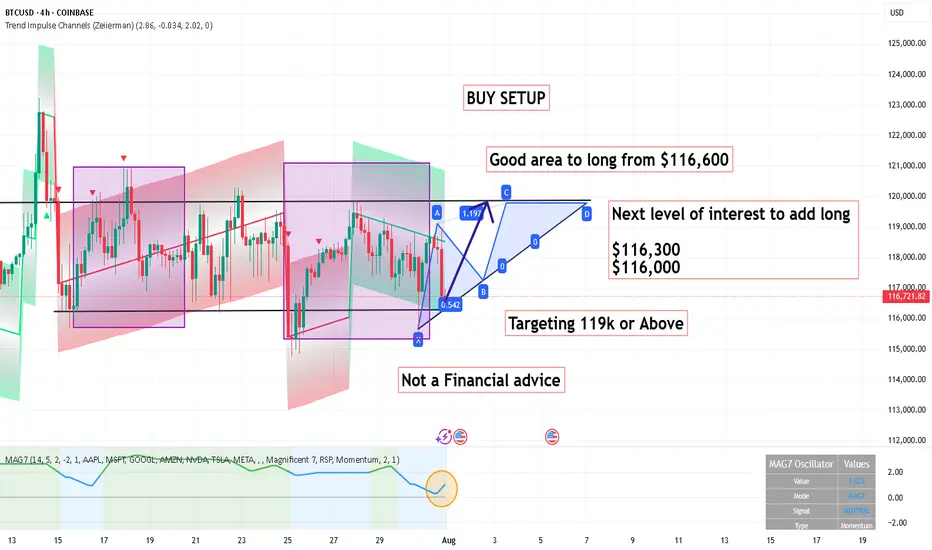
BUY SETUP ,Good area to long from $116,600BUY SETUP
Good area to long from $116,600
Next level of interest to add long
$116,300
$116,000
Targeting 119k or Above
Its not a Financial advice
Buy HBARHBAR is the native cryptocurrency of the Hedera network, a high-performance, enterprise-grade public blockchain alternative that uses a unique consensus algorithm called Hashgraph.
Governed by a 39-member global Governing Council, including:Google, IBM, Boeing, Dell, Ubisoft, Deutsche Telekom. These members run nodes and vote on governance, making the network decentralized, but enterprise-friendly.
HBAR still in the box formed since January 2021 but it has potential to break-out. Actually, the first leg-up has started and curently price is consolidating before the second legup. with potential to break out the box.
Trade setup is as in chart Target is estimated based on market cap of 11B.

ADA Ready for PUMP or what ?The price on the 3d timeframe is within a triangle, which can create some uncertainty about which direction it will move. Here, we should wait to see which side of the triangle the price breaks out from. Remember, the trend is our friend.
Best regards CobraVanguard.💚

ETH Price Weakens: Watching This Strong Demand Zone Closely$ETH/USDT Analysis (12H)
Ethereum has broken below a key support zone, confirming short-term weakness in price structure.
At the same time, the RSI is showing bearish divergence, signaling slowing momentum while the price was making higher highs — a classic early warning of a potential drop.
Now all eyes are on the strong demand zone below. If ETH finds support there, we could see a solid bounce or even a full trend reversal. But if this zone fails, deeper correction may follow.
DYOR, NFA
Thanks for the reading

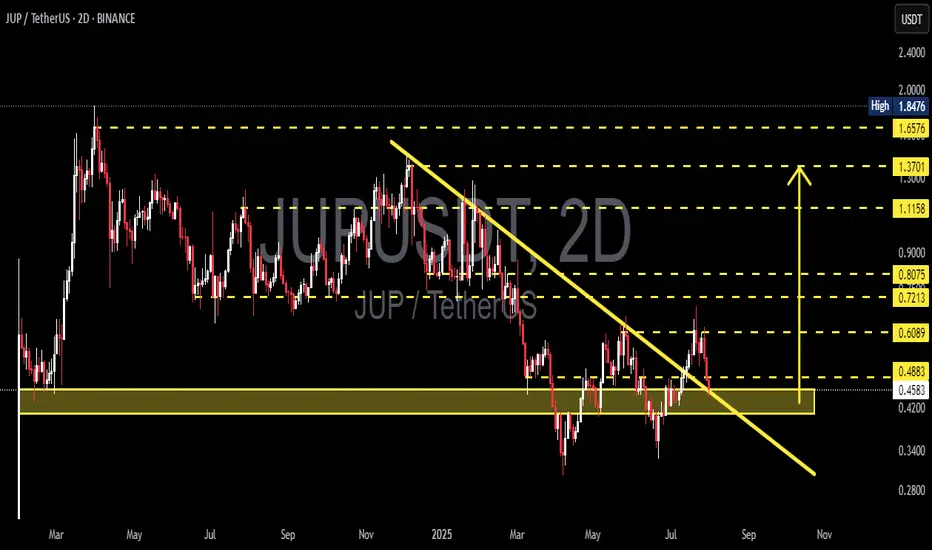
JUP/USDT Retests Key Support! Bounce Incoming or Breakdown Ahead📉 Complete Technical Analysis:
The JUP/USDT pair is currently showing a critical price action after breaking out from a medium-term descending trendline (yellow diagonal line). However, the price is now retesting a major demand zone around $0.4200–$0.4574.
📌 Pattern Identified:
Descending Trendline Breakout: Price successfully broke above a long-standing bearish trendline.
Retest of Breakout Zone: The current move is a classic retest, often seen before a trend reversal continuation.
Strong Demand Zone: The yellow zone ($0.4200–$0.4574) has historically served as a strong accumulation and bounce area.
---
📈 Bullish Scenario:
If the price holds and bounces from the $0.4200–$0.4574 zone, bullish momentum could resume with upside targets:
Short-term target: $0.6089
Next resistances: $0.7213 – $0.8075
A confirmed higher low above support would strengthen the bullish structure.
---
📉 Bearish Scenario:
If the price breaks down below $0.4200, bearish pressure could return, leading to further downside.
Potential decline toward deeper support levels around $0.35–$0.30.
Breakdown with increasing volume would confirm seller dominance.
---
🎯 Key Levels to Watch:
Support Zone: $0.4200 – $0.4574 (Critical Retest Area)
Immediate Resistance: $0.4883, $0.6089
Major Resistance Levels: $0.7213, $0.8075, $1.1158, up to $1.6576
---
🧠 Conclusion:
JUP/USDT is currently at a crucial decision point. The reaction at this support zone will define whether the breakout holds or fails. Traders should watch this level closely for confirmation of the next major move.
#JUPUSDT #CryptoAnalysis #AltcoinUpdate #TechnicalAnalysis #CryptoBreakout #SupportAndResistance #TradingView #Cryptocurrency #ChartPattern #BullishSetup #BearishCase
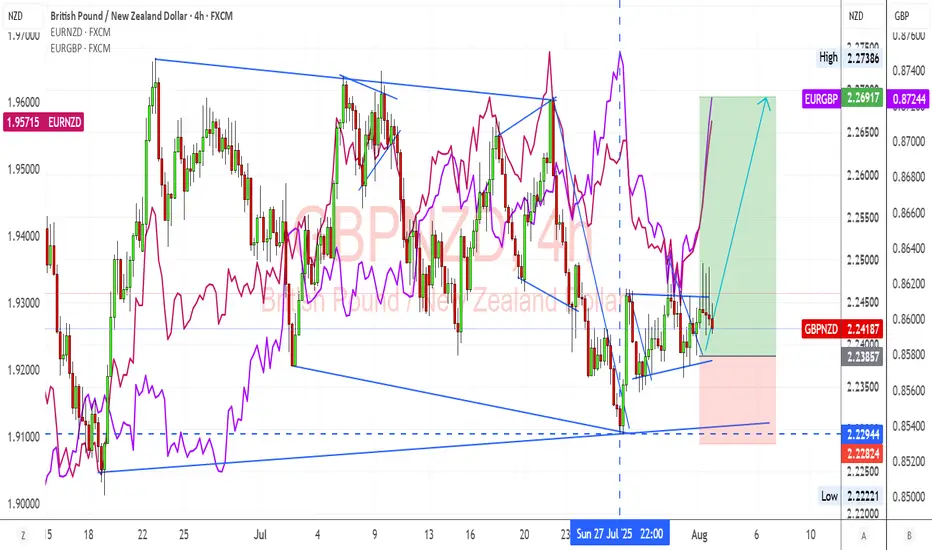
GBPNZD Breakout from Consolidation Bullish Momentum BuildingGBPNZD has broken out of its recent consolidation pattern and is showing signs of bullish continuation. Strong GBP fundamentals combined with NZD weakness from global risk-off sentiment and tariffs support this technical move.
Technical Analysis (4H Chart)
Pattern: Breakout from a descending channel with bullish follow-through.
Current Level: 2.2418, trading above the breakout level, confirming momentum shift.
Key Support Levels:
2.2294 – recent breakout support and invalidation point for bulls.
2.2222 – secondary support if a deeper pullback occurs.
Resistance Levels:
2.2500 – near-term resistance and potential target for the breakout.
2.2690 – extended bullish target if momentum continues.
Projection: Likely to continue higher toward 2.2500, with room for 2.2690 if GBP strength persists.
Fundamental Analysis
Bias: Bullish.
Key Fundamentals:
GBP: Supported by BOE’s cautious stance on inflation and the relative resilience of the UK economy.
NZD: Pressured by global tariffs, weaker risk sentiment, and limited domestic growth catalysts.
USD Factor: Fed rate cut expectations indirectly support GBP crosses against risk currencies like NZD.
Risks:
Hawkish surprise from RBNZ could strengthen NZD.
BOE dovish signals could stall GBP upside.
Key Events:
BOE meeting and UK CPI.
RBNZ policy decision.
Risk sentiment trends globally.
Leader/Lagger Dynamics
GBP/NZD is a leader among GBP crosses, with GBP strength and NZD weakness driving momentum. It also aligns with EUR/NZD upside moves, reinforcing the bearish NZD outlook.
Summary: Bias and Watchpoints
GBP/NZD is bullish, having broken consolidation with upside targets at 2.2500 and 2.2690. The main drivers are GBP’s policy support, NZD’s risk-off weakness, and global tariff concerns. Watch for BOE and RBNZ updates as potential volatility triggers.
XRP 1H – 21% Decline Off the HighAfter hitting a strong resistance near $3.75, XRP has been in a steady downtrend, losing over 20% from its peak. The chart shows clear lower highs and a strong descending resistance line capping every bounce. Price action remains bearish, but short-term momentum (via Stoch RSI) shows signs of being oversold — hinting at a potential relief bounce.
To flip bias, bulls would need a clean break of the trendline and reclaim the $3.15–$3.25 area. Until then, lower highs + sustained sell volume = caution for longs.
📌 20.6% decline
📌 Downtrend intact
📌 Momentum diverging — bounce or continuation?
This setup is primed for a mean-reversion or further breakdown — stay reactive, not predictive.

Can XRP obtain a 50% increase in the next few weeks XRP has recently been under a lot of manipulation lately! Is it time for the bulls to finally step in and move the price point on this digital asset to a 50 percent increase to another ATH at $4.45………? The world will see with the next few weeks! And why is #Bradgarlinghouse X account always following 589………..? It’s it a signal or is he just trolling
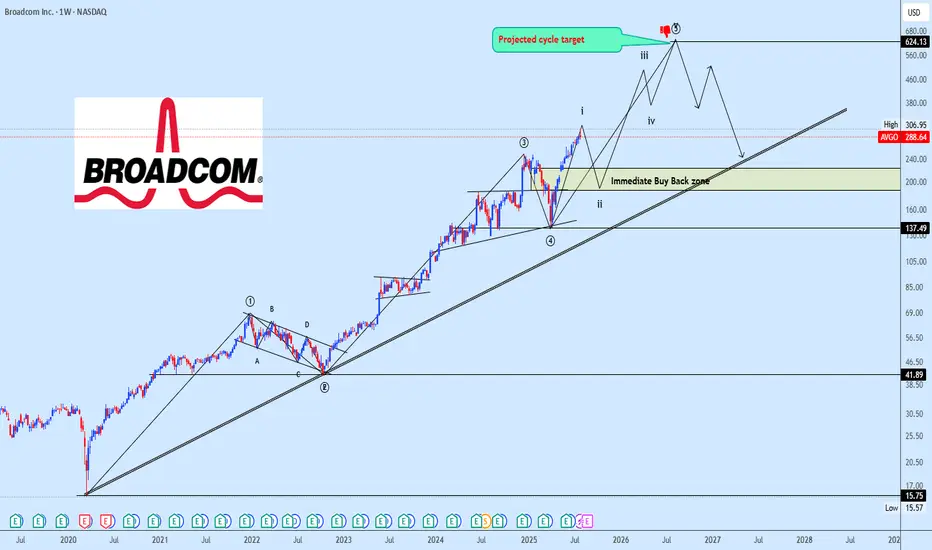
AVGO Bullish Impulse Wave Structure in ProgressAVGO continues its macro advance with a clear 5-wave impulse structure unfolding. The current price action marks the completion of subwave (i) of wave ⑤, setting the stage for a corrective pullback into subwave (ii).
We expect this corrective leg to reach into the 38.2%–50% Fibonacci retracement zone of subwave (i), which will serve as a potential re-accumulation area before the next bullish expansion.
The strategy remains to monitor the development of wave (ii) closely, waiting for key price reaction around the identified retracement zone to build positions in anticipation of subwave (iii) of ⑤ typically the strongest and most impulsive move in Elliott Wave structure.
Targets are shared on the chart for clarity. Patience here is key as we await the right entry zone aligned with technical confluence.
📌 Drop your stock requests in the comment section for quick chart updates — only equity-based assets will be accepted under this post.
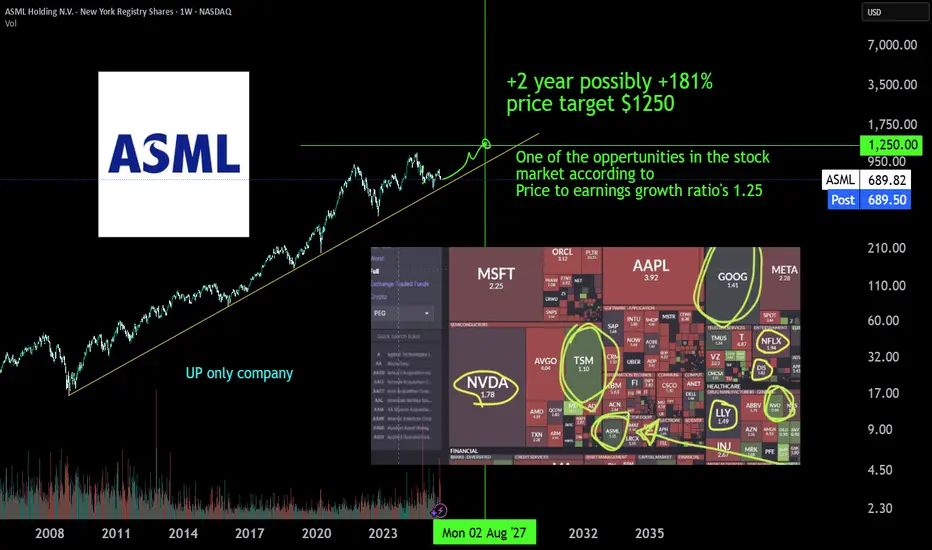
ASML monopolist, a +181% | 2Y oppertunityASML is the monopoly Extreme ultra violet machinery company. There is no one close to it's technology or there is no one investing enough to R&D a thing like it. The whole AI datacenter and cloud chip growth depends on EUV machinery of ASML developed in 2013 (>10y of PhD level R&D deveopment). The first new High-NA EUV systems have been deployed at Intel in July 2025 for research purposes and will scale just like the EUV already does to keep pace with moore's law. TSMC has stated it will not yet buy & depoly the newest machines jet, but has to expand with the 10 year older tech EUV machines just to get the AI chip demand going. AI chip demand at NVIDIA is growing harder than expected comfirmed by latest earnigns of alphabet, microsoft, meta and amazon. The whole AI data center growh depends on 2013 asml tech machines, and they already have a new tech High-NA EUV machine, just figure.
Also don't sleep on BESI a packing machinery wonder, due to hybrid bonding which makes stacking 3D chip structures possible.
#GoHighTechNetherlands
Long XLMBTC is bouncing from a strong support.
XLM would have another leg up from the local support trendline.
Trade setup is as in chart.

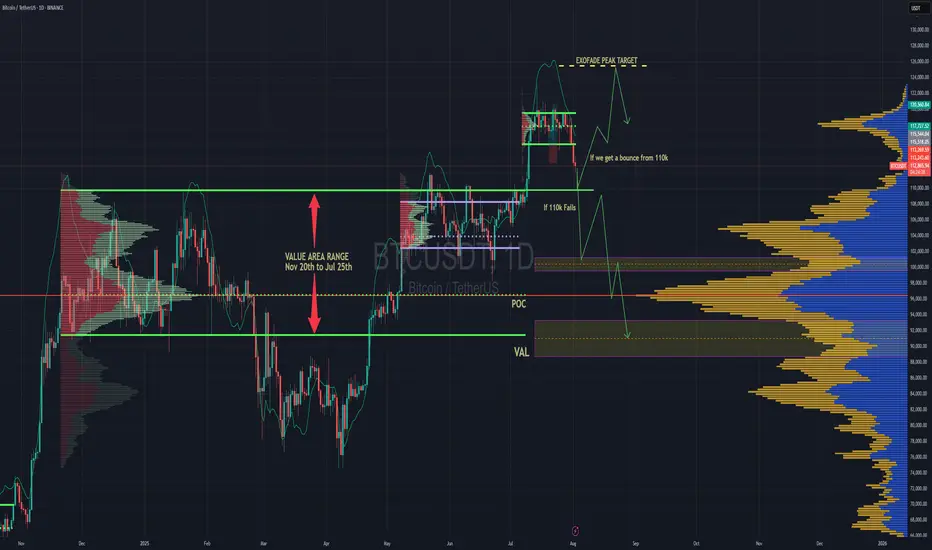
BTC Forecast For August & September. The Only Roadmap You Need !This is one is so obvious, its a no brainer , and would likely be very easy to trade as long as you follow this road map i have provided.
The Value Area High at 110k price range is most important upcoming battle line between bull vs bear. If bulls fail to get a strong bounce from 110k and we close at least 2 daily candles below it. Then it would mean bears have full control and the implication of that is that since we would at that point be closing back inside an established Value Area range, formed between Nov 20th to Jul 25th, then it would mean the probability of price selling all the way down to re-test the VAL (value area low) at $91.6k would instantly become very very high.
After re-testing $91.6k we'll watch and see what happens.
It'll either hold after grabbing some liquidity below and stay in the Value Area Range until further notice Or we lose it and the sell off continues. Bear market will be in full swing if that happens and you can bet a ton of weak hands will start to exit due to max pain & cascading long liquidations. Fear index will be back in the red at that point as capitulation starts to set in. Alot of new alts and meme coins will be completely obliterated.
Bullish Continuation Scenario
If bulls get a strong bounce from 110k and don't close back inside the Value Area Range below, then we could continue up to a make a new ATH for a classic trend pullback continuation trade. Once we get back above 115.4k, the dream of a new ATH will become much more realistic. There is an UFA(Unfinished Auction) at 120.8k which is only visible to traders using the market profile or footprint chart. This make poor high and needs to be taking out at some point.
For the Price target to the upside, we would be using the peak formation line of the ExoFade indicator.
SOL/USDT | SOL Drops 25% – Approaching Key Buy Zone at $136–$148By analyzing the Solana chart on the daily timeframe, we can see that, like the rest of the market, it's undergoing a correction — dropping over 25% from the $206 area so far. Solana is now approaching a highly attractive buy zone between $136–$148, so be sure to closely monitor the price reaction in this range. Bullish targets will be announced soon — stay tuned!
Please support me with your likes and comments to motivate me to share more analysis with you and share your opinion about the possible trend of this chart with me !
Best Regards , Arman Shaban

Good moment to tighten your stop losses!After market reaction to jobs data, it's a good idea to take a look at the indeces and be prepared for a correction, whatever size it is.

SOL 1H – Bounce From Demand, Can It Reclaim the Breakdown Zone?SOL tapped into the key demand zone near $157 and is now showing signs of a reaction bounce. Price is approaching the former support-turned-resistance zone around $184 — a critical level that marked the start of the previous breakdown.
A reclaim of that zone would suggest bulls are regaining control, opening up room toward the $190–$200 region. Until then, it remains a lower high attempt inside a bearish structure.
📌 Demand bounce
📌 Bearish market structure
📌 Key resistance at ~$184
No confirmed reversal yet — just a bounce until proven otherwise. Keep watching the structure evolve.

Dot/usdtPolkadot (DOT) cryptocurrency is showing potential for growth from around the $3.40 level.
If the price moves upward, it could potentially reach $5.20, $8, and even $12.
This analysis remains valid as long as the support level at $3.10 holds and no lower low is formed.
Please note: This analysis involves risk. Make sure to apply proper risk management.

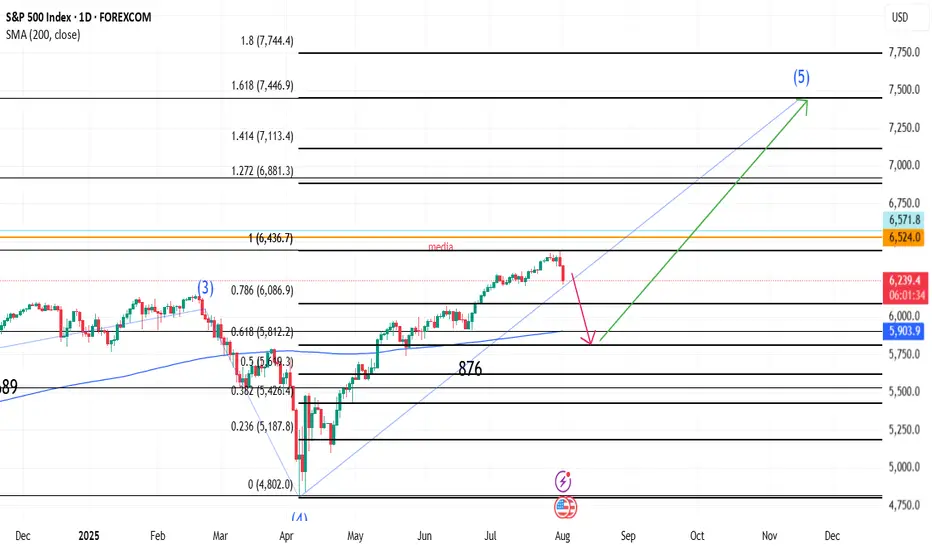
SPX correction to 5800 then 7445In my view current correction could stop in 5800 area where bullish trend could resume to target 7445 area in November
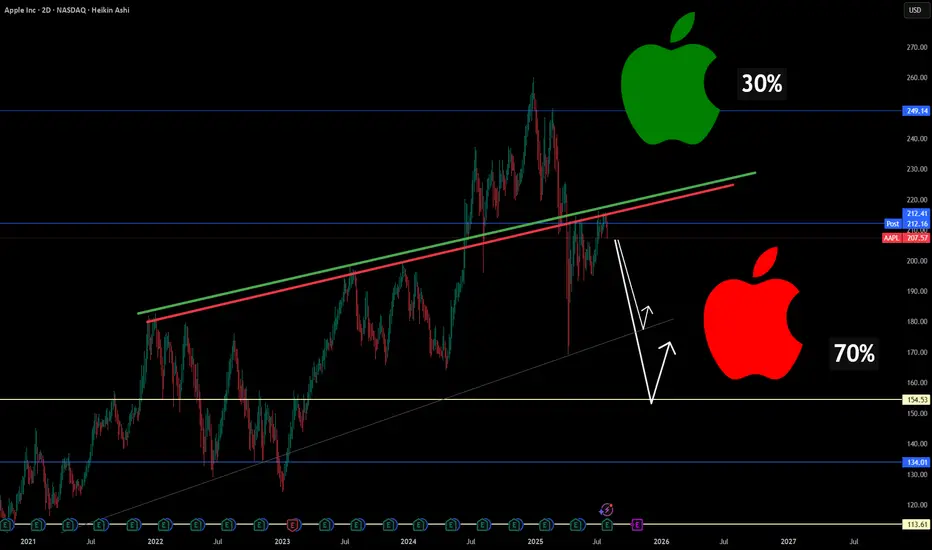
Why Apple Could Be Entering a Structural Correction🍎📉 Why Apple Could Be Entering a Structural Correction ⚠️🔍
After scanning major tech names today, one stock stood out— for all the wrong reasons : NASDAQ:AAPL .
Technically, Apple has broken below long-standing trendline support , and my chart now assigns a 70% probability(roughly guys...roughly and rounded) of further downside vs only 30% upside . But it's not just about the chart...
Here’s the macro storm Apple is walking into:
🧭 1. Trade War Revival
New tariffs on Chinese electronics could cost Apple up to $1.1B/quarter , even as it tries to diversify production. India and Vietnam are promising, but not mature enough to offset risk.
🤖 2. Lagging in the AI Arms Race
While Nvidia, Google, and Microsoft pour $30B+ into AI, Apple is spending less than half that. Analysts weren’t impressed with “Apple Intelligence.” Siri still isn’t leading.
🇨🇳 3. China: Flatlining Growth, Rising Risk
~18% of Apple’s revenue still comes from China. With Huawei resurging and tightening regulations, Apple’s dominance is being chipped away.
🛑 4. Innovation Pipeline: Empty?
There’s no iPhone super-cycle ahead. Vision Pro remains niche. Apple now looks like a mature tech stock without a breakout catalyst —risky when valuation is still premium.
⚖️ 5. Legal Pressure on Both Sides of the Atlantic
The DOJ and EU are targeting Apple’s App Store dominance. If changes are enforced, the service revenue moat weakens.
🔽 Summary: This Isn’t Panic. It’s Repricing.
The market is re-rating Apple based on real structural risks.
Downside levels I’m watching:
📉 177.65 (first support)
📉 154.53 (next key level)
❗️134–113 zone if macro pressure escalates
Chart = structure. Narrative = pressure. Both are aligned.
Let me know your thoughts—still long NASDAQ:AAPL , or hedging this weakness?
One Love,
The FXPROFESSOR 💙
Disclosure: I am happy to be part of the Trade Nation's Influencer program and receive a monthly fee for using their TradingView charts in my analysis. Awesome broker, where the trader really comes first! 🌟🤝📈
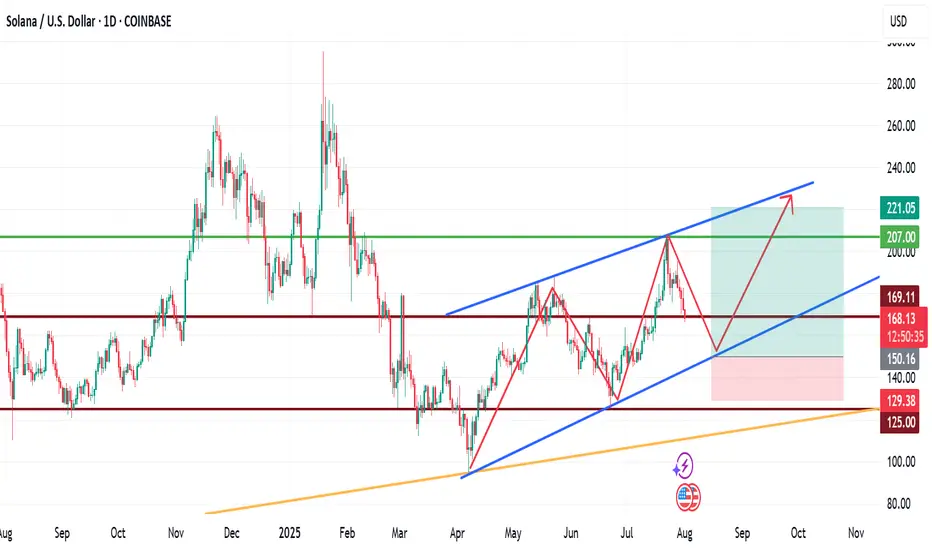
My View for SOLANA next moveMy View for SOLANA next move.
Technically, SOL has been trading within a channel for a while now, with the formation of HHs and HLs.
If fundamentals play out positively long to mid-term, we are likely to see SOLNA fall to $150 zone before another upward leg forms. This leg may rally to as high as $220.
Trade with care.
If you found this helpful, please connect with me.
Like, comment and share
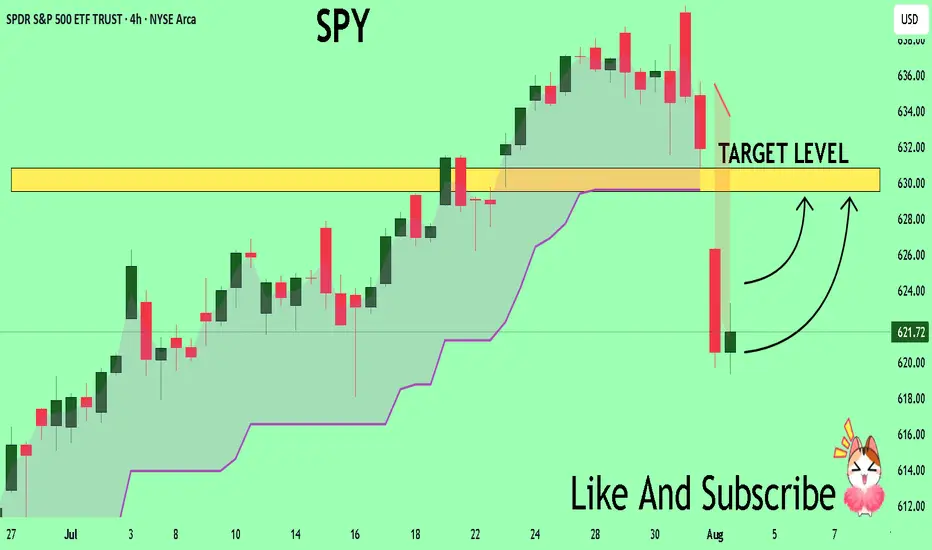
SPY Massive Long! BUY!
My dear subscribers,
My technical analysis for SPY is below:
The price is coiling around a solid key level - 621.72
Bias - Bullish
Technical Indicators: Pivot Points Low anticipates a potential price reversal.
Super trend shows a clear buy, giving a perfect indicators' convergence.
Goal - 629.55
About Used Indicators:
By the very nature of the supertrend indicator, it offers firm support and resistance levels for traders to enter and exit trades. Additionally, it also provides signals for setting stop losses
Disclosure: I am part of Trade Nation's Influencer program and receive a monthly fee for using their TradingView charts in my analysis.
———————————
WISH YOU ALL LUCK
Analysis of gold market operation strategies and ideas next week
Gold rallied unilaterally on Friday following positive non-farm payroll data, reaching a new high for the week. This week's candlestick formed a hammer pattern, suggesting further upside potential next week. Bulls continued their push late Friday, closing at 3363. Next week, we will continue to monitor short-term resistance around 3370-3375. We will continue to buy on pullbacks. If your current trading is not satisfactory, I hope I can help you avoid investment setbacks. Welcome to discuss your options!
Based on a 4-hour analysis, short-term resistance will be seen around 3370-3375 next week, with a key resistance around 3395-3400. We will continue to buy on pullbacks. In the intermediate range, we recommend maintaining a cautious wait-and-see approach. I will provide detailed trading strategies during the trading session, so please stay tuned.
Gold Trading Strategy:
Go long on gold pullbacks to 3330-335, with a stop-loss at 3318 and a target at 3370-3375. Hold on if it breaks above this level.
