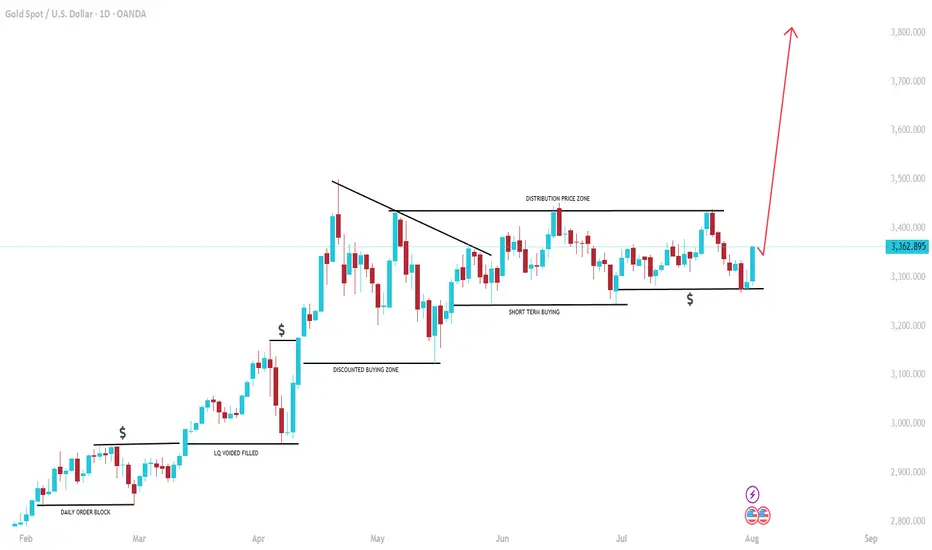
GOLD: $4000 on the way! Bulls has the controlGold is on the way hitting a record high since the global tension rising we can see gold creating another record high. Please note that it is a swing trades and may take weeks and months to hit the target or it may not even reach the target itself. This is prediction only so do your own due diligence.
Trend Analysis
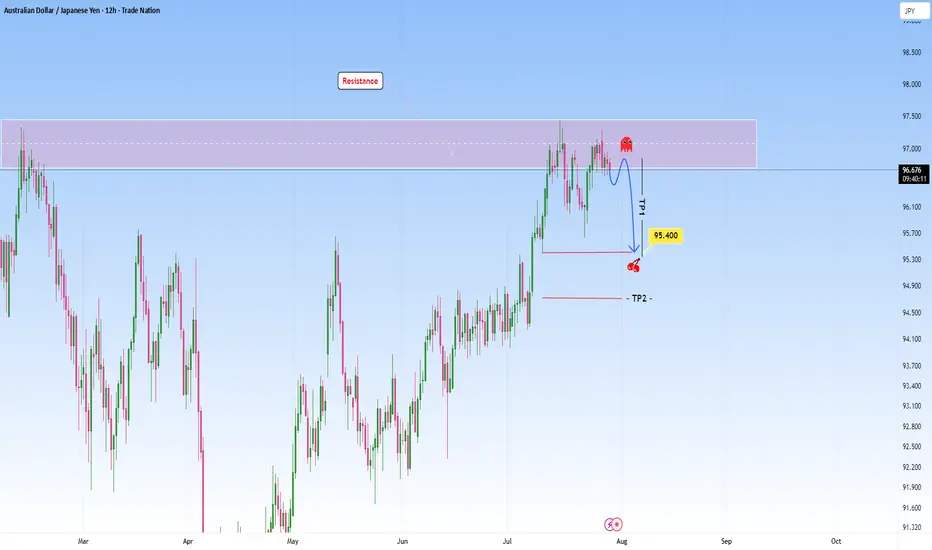
AUDJPY at Resistance: Could we see a reversal here?The market on this pair shows us a classic scenario where price presses into a resistance zone after a sustained bullish move. Price action approaching this zone appears hesitant, with smaller candles and wicks showing signs of exhaustion, meaning the possibility that buying momentum is weakening. There is a clear intention in this structure and I am anticipating a reversal here.
My first target (TP1) at 95.400 is placed just above a previous structure low and it’s a logical level for a partial exit, as price may pause or react there. The second target (TP2), placed even lower, hints at a full mean reversion idea targeting the origin of the previous bullish leg.
The setup requires patience, waiting for confirmation perhaps in the form of a strong bearish rejection before committing to the short. Overall, it’s a disciplined setup that mirrors the kind of analysis I like to gravitate toward: structured, simple and driven by high probability reversal zones.
Disclosure: I am part of Trade Nation's Influencer program and receive a monthly fee for using their TradingView charts in my analysis.
Bitcoin Support: Midline Channel Support at 114kBitcoin
1D
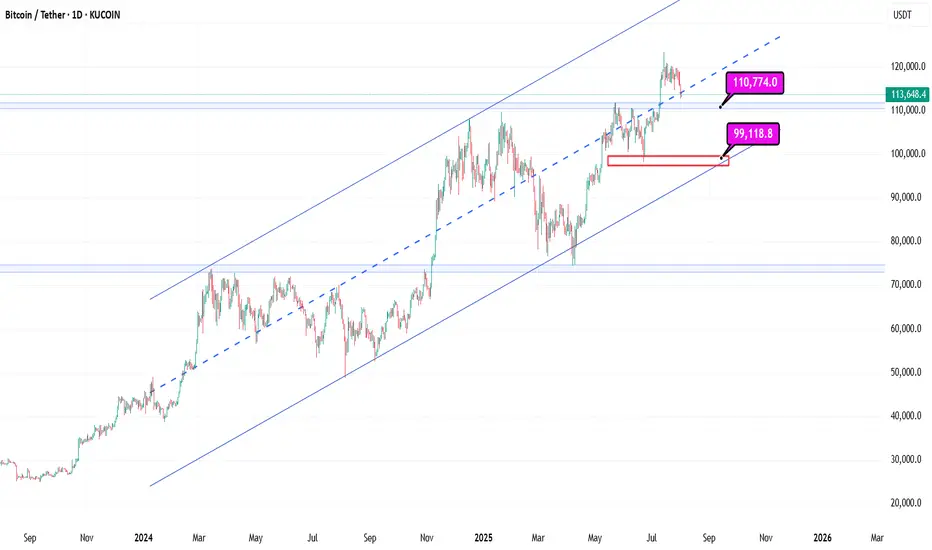
Bitcoin Support: Midline Channel Support at 114k and then Blue Line 110k
With these supports holding in the long term, progress is still possible
$adaabove 200 ema on daily
range low
deivation likely
entered now let see if we get a wick below before up saving some to bid there
time for it to ressurect
If level breaks, the buyers last line of defense will be lost The red-marked zone, which acts as both dynamic and static resistance, is the only hope and the only scenario that could trigger an altseason.

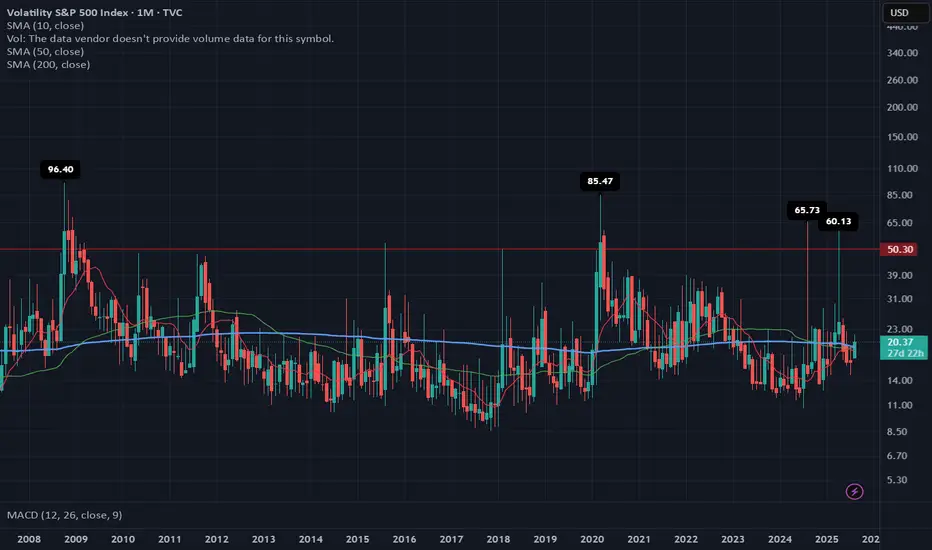
VIX: From “Calm Tension” to a ReboundWhy does a small uptick matter today… if we’ve already seen 60+ readings four times in the past 17 years?
The first week of August 2025 brought back a familiar market force: volatility.
The VIX, which tracks expected fluctuations in the S&P 500, jumped 21% in just a few days, rising from 17.4 to 20.37, with an intraday high of 21.9 on August 1.
At first glance, the move may seem minor. But it broke through key long-term moving averages (SMA 50 and 200) and exited its recent comfort zone (14–19 pts). That alone is enough to make portfolio managers and traders pay attention again.
🔙 Historical context: when the VIX truly spiked
📅 Date 🔺 VIX intraday 🧨 Trigger
Oct 1, 2008 96.40 Subprime mortgage crisis, Lehman collapse, AIG bailout
Mar 2, 2020 85.47 COVID-19 global spread, border shutdowns
Aug 5, 2024 65.73 Surprise Fed rate hike + overheated jobs data
Apr 7, 2025 60.13 Panic over new U.S. tariffs on global partners
Compared to those moments, today's VIX levels look “mild.” But the technical and macroeconomic signals suggest that volatility may be establishing a new baseline.
1. 📊 Breakdown: First week of August 2025
Weekly increase: from 17.4 → 20.37 (+21%).
Technical breakout: monthly close above both the 50-day and 200-day simple moving averages (SMA 19.25 and 19.45).
MACD on the monthly chart has flipped positive for the first time since March 2023.
Key drivers:
🏛️ The Fed left interest rates unchanged on July 30, but two dissenting votes favored a rate cut.
👷♂️ Softening jobs data: July NFP came in at only +73,000 jobs (vs. +110,000 expected).
🧾 New U.S. tariffs, announced on August 1, reignited inflation concerns.
2. ⚖️ Comparing August 2025 to the August 2024 storm
Factor August 2024 August 2025 (Week 1)
🔺 VIX peak 65.73 21.9
🏛️ Fed stance Surprise 25 bp rate hike Rates unchanged, internal division
👷 Labor market Hot, wage pressures Cooling down
📉 S&P 500 reaction −12% in 3 weeks Approx. −3% decline underway
💧 Market liquidity Very low (pre-market) Normal
Conclusion:
2024 was a systemic shock.
2025 is more of a volatility warning sign—but one that matters for risk management.
3. 📍 Technical signals to monitor
The monthly MACD just turned positive, which historically precedes sustained volatility spikes.
Key short-term range: 18–22 pts. A sustained close above 22 could trigger heavy selling in high-beta stocks.
Options expiration (OPEX, Aug 16) may amplify moves via gamma flows.
4. 🔮 What could move the VIX next?
📅 Date 📌 Event ⚠️ Volatility Risk
Aug 14 Core CPI (July) Reading above 0.3% m/m could reignite hawkish Fed bets
Aug 22–23 Jackson Hole Symposium Powell’s speech could reset the policy outlook
End of Aug Q2 GDP revision Confirm whether slowdown = soft landing or stagflation
📌 Note: The VIX cannot be traded directly. Exposure is typically obtained through futures, options, or ETNs—each with specific risks like contango, low liquidity, and roll decay.
📌 Final thoughts
The VIX doesn’t need to hit 60 to send a message.
The fact that it’s breaking above long-term averages, reacting sharply to macro data, and threatening key levels is enough to suggest that the era of ultra-low volatility may be ending.
History shows us that major VIX spikes come fast and unannounced.
If you remember 2008, 2020, or even April 2025—you know that preparation beats prediction.
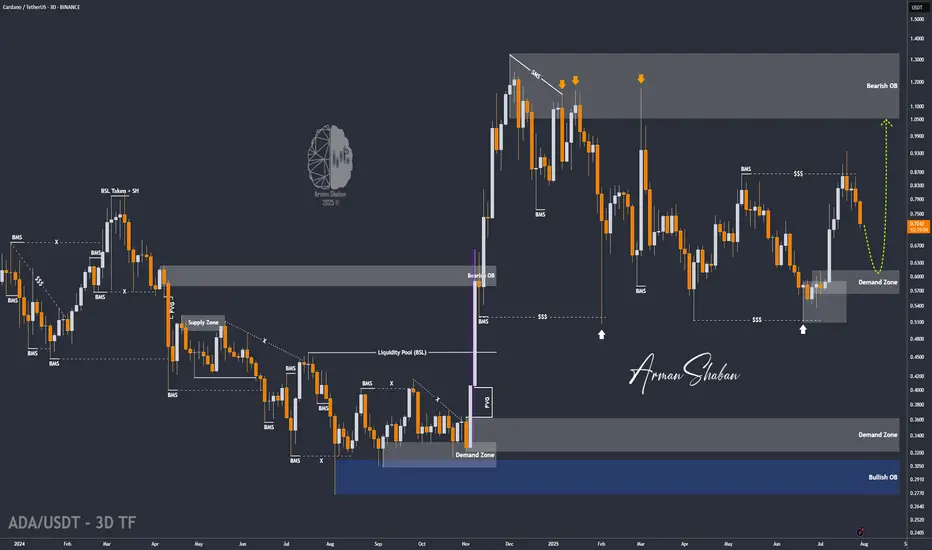
ADA Ready for PUMP or what ?The price on the 3d timeframe is within a triangle, which can create some uncertainty about which direction it will move. Here, we should wait to see which side of the triangle the price breaks out from. Remember, the trend is our friend.
Best regards CobraVanguard.💚

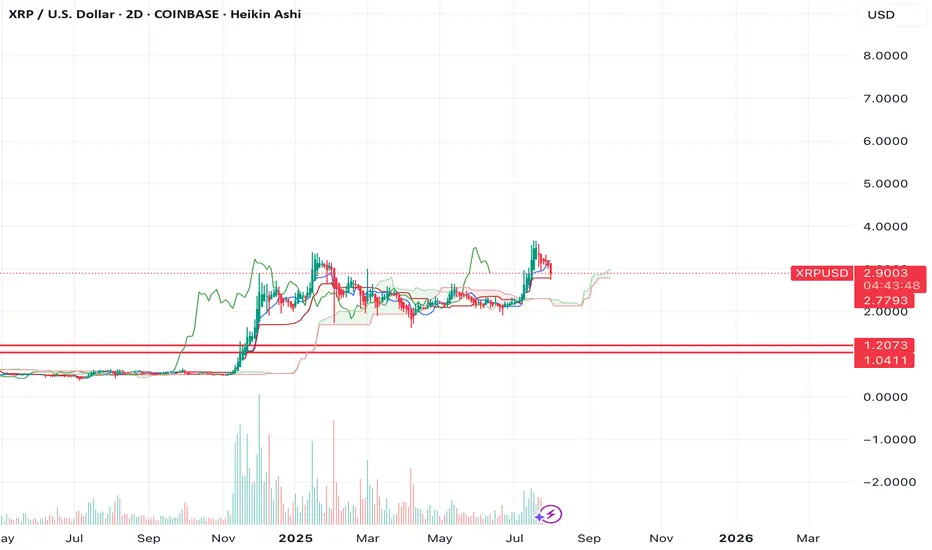
$XRP ENJOYERRRs see ya at $1.04-$1.20If we look at the chart of XRP, you can see that since the move in fall of 2024, we've had a massive lack of balance on the chart.
We ran up quickly without testing any levels as support.
That makes me think we're going to see the lack of balance get corrected and the same move is now going to happen in the opposite direction.
The $1.04-1.20 region looks like a good area of support to me.
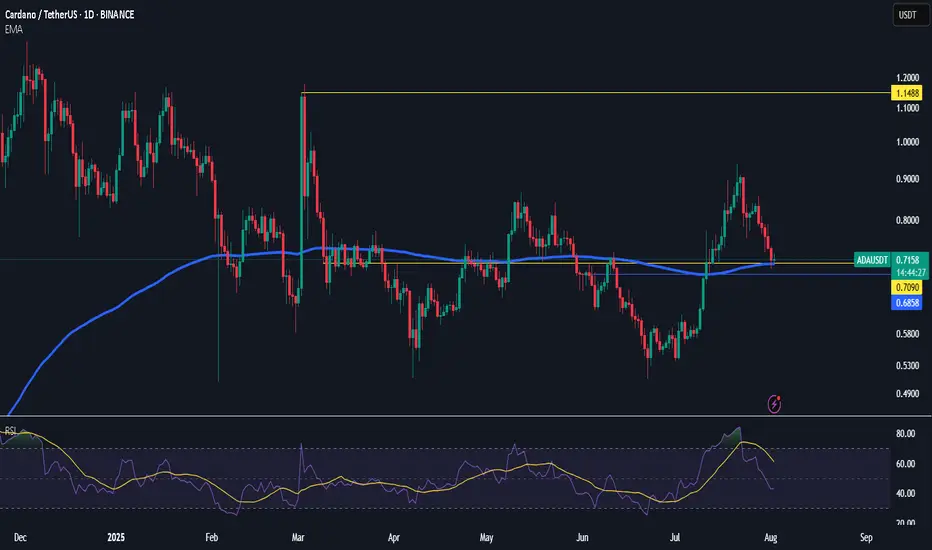
ADA/USDT | ADA Slips Below Support – Watching $0.61 for Support!By analyzing the Cardano chart on the 3-day timeframe, we can see that the price failed to hold above the $0.75 support and is currently trading around $0.72. Given the current momentum, a deeper correction for ADA seems likely. If the price fails to stabilize above $0.69, we could see a sharp drop toward the $0.61 zone. If ADA reaches this key support area, keep a close eye on it — a strong bullish reaction could lead to the next big upside move!
Please support me with your likes and comments to motivate me to share more analysis with you and share your opinion about the possible trend of this chart with me !
Best Regards , Arman Shaban
Short Term Crypto Total Market CapHere are the 2 scenarios which I can imagine for the short-term move of the crypto market with respective invalidation levels and trade ideas.

TESLA: Bullish Continuation & Long Trade
TESLA
- Classic bullish setup
- Our team expects bullish continuation
SUGGESTED TRADE:
Swing Trade
Long TESLA
Entry Point - 302.63
Stop Loss - 296.98
Take Profit - 312.87
Our Risk - 1%
Start protection of your profits from lower levels
Disclosure: I am part of Trade Nation's Influencer program and receive a monthly fee for using their TradingView charts in my analysis.
❤️ Please, support our work with like & comment! ❤️

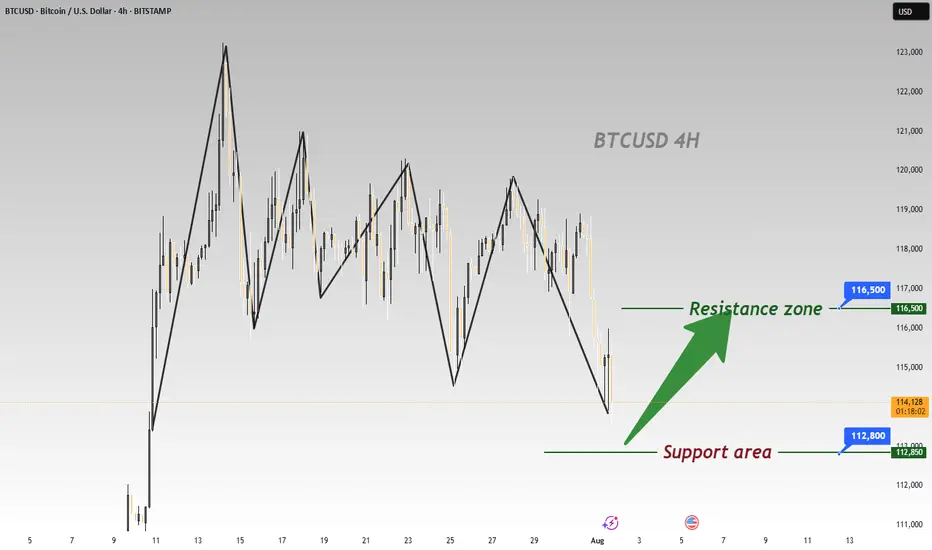
BTC Plummets Post-NFP; Go Long for Rebound to 116500BTC has plummeted significantly under the influence of the non-farm payroll data 📉, and now is an excellent opportunity to go long. Its Support level is around 112800, and according to the current trend, we can wait for a rebound to around 116500.
⚡️⚡️⚡️ BTCUSD ⚡️⚡️⚡️
🚀 Buy@ 113000 - 113800
🚀 TP 114500 - 115500 - 116500
Daily updates bring you precise trading signals 📊 When you hit a snag in trading, these signals stand as your trustworthy compass 🧭 Don’t hesitate to take a look—sincerely hoping they’ll be a huge help to you 🌟 👇
EUR/USD Reversal or Trap? 4H Clean Breakdown InsidePrice just tapped into a high-probability sell zone after a corrective Wave 2 structure. With sellers already active at 1.16342 and 1.17635, this setup is not just textbook—but a potential goldmine for swing traders.
🔻 Is this Wave 3 continuation about to begin?
🔍 Liquidity swept. Zones respected. Structure still bearish.
⚠️ Many traders will miss the bigger picture here—will you?
👇 Drop your thoughts:
Are we about to break 1.13000?
Do you agree with the Elliott Wave count?
What’s your bias on DXY?
💬 I personally reply to every comment—let’s build this chart together.
🔥 If you caught the entry, show your entry point and reasoning—let’s level up as a team.

Gold The Week Ahead Key Support and Resistance Levels
Resistance Level 1: 3386
Resistance Level 2: 3410
Resistance Level 3: 3438
Support Level 1: 3315
Support Level 2: 3295
Support Level 3: 3268
This communication is for informational purposes only and should not be viewed as any form of recommendation as to a particular course of action or as investment advice. It is not intended as an offer or solicitation for the purchase or sale of any financial instrument or as an official confirmation of any transaction. Opinions, estimates and assumptions expressed herein are made as of the date of this communication and are subject to change without notice. This communication has been prepared based upon information, including market prices, data and other information, believed to be reliable; however, Trade Nation does not warrant its completeness or accuracy. All market prices and market data contained in or attached to this communication are indicative and subject to change without notice.

GBPUSD The Week Ahead Key Support and Resistance Levels
Resistance Level 1: 1.3370
Resistance Level 2: 1.3430
Resistance Level 3: 1.3480
Support Level 1: 1.3180
Support Level 2: 1.3140
Support Level 3: 1.3110
This communication is for informational purposes only and should not be viewed as any form of recommendation as to a particular course of action or as investment advice. It is not intended as an offer or solicitation for the purchase or sale of any financial instrument or as an official confirmation of any transaction. Opinions, estimates and assumptions expressed herein are made as of the date of this communication and are subject to change without notice. This communication has been prepared based upon information, including market prices, data and other information, believed to be reliable; however, Trade Nation does not warrant its completeness or accuracy. All market prices and market data contained in or attached to this communication are indicative and subject to change without notice.

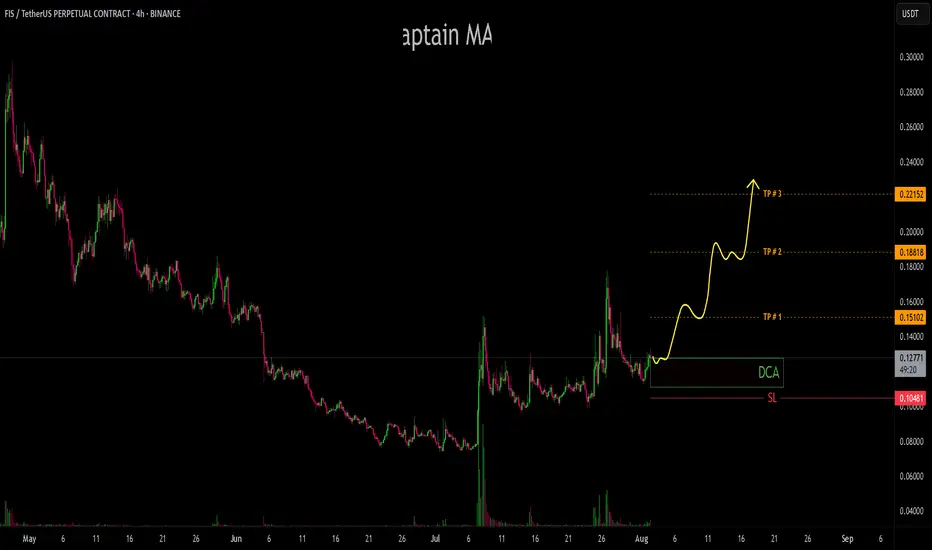
FIS/USDTFIS has shown an aggressive push from buyers, confirming strong demand as the price consistently defends the $0.10–$0.11 zone as solid support. This accumulation range has held firm despite market volatility, indicating a possible base formation. signaling momentum building for a breakout.
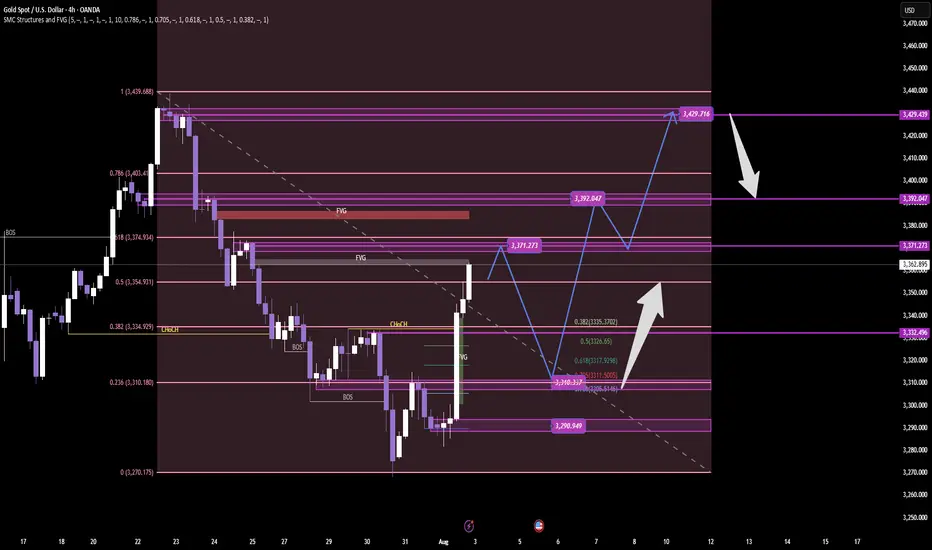
GOLD – SMC ProTrading Breakdown Plan Next WEEK GOLD – SMC ProTrading Breakdown | Clinton Scalper | 4H Timeframe
XAUUSD is currently displaying clear institutional order flow behavior after a deep liquidity sweep at the end of July. Here’s a full breakdown using advanced SMC (Smart Money Concepts) methodology:
🔍 1. Liquidity Sweep at the Low
Price maintained a series of lower highs and bearish structure until it executed a classic liquidity grab between 3,270 – 3,290. This is a textbook move by Smart Money: sweep retail stop orders before initiating a reversal.
This zone aligned with:
✅ Untapped Fair Value Gap (FVG)
✅ Reversal Order Block (OB)
✅ Fibo 0.236 of the mid-term bullish leg
After the sweep, the market printed a micro CHoCH, indicating early signs of smart money accumulation.
🧠 2. CHoCH → BOS → Reaccumulation Structure
CHoCH (Change of Character) marks the first break in the bearish microstructure – suggesting a possible shift.
Then, price delivered a BOS (Break of Structure) around the 3,334 zone, confirming bullish intent.
Buy-side is now:
Positioned from a deep discount zone
Mitigating key inefficiencies
Targeting higher liquidity zones above current price
Price is currently reacting to a previous supply OB around 3,362.
📐 3. Institutional Order Flow & Target Zones
Now that price is in a key reaction zone, we prepare for two high-probability scenarios:
🅰️ Continuation Scenario (Reaccumulation)
A retracement to the 3,317–3,311 zone (Fibo 0.5–0.618) could offer a premium re-entry
This area is stacked with:
FVG
Order Block
Equal lows liquidity
🔼 From there, potential targets include:
🎯 TP1: 3,371 – previous imbalance zone
🎯 TP2: 3,392 – minor liquidity cluster
🎯 TP3: 3,429 – premium OB and high-liquidity zone
🅱️ Distribution Scenario (Bearish Rejection)
If price fails to hold bullish structure and forms a bearish CHoCH around 3,392–3,429
This would signal a distribution zone, and potential reversal back toward 3,290 support
🔂 4. Smart Money Flow Logic
“Smart Money doesn’t follow price. They lead price to liquidity.”
This chart reflects the complete Sweep → CHoCH → BOS → Mitigation → Expansion sequence. A classic SMC Pro model where:
Liquidity is engineered and swept
Structure is shifted
Price returns to mitigate institutional entries
Price expands into external liquidity
📌 Clinton Scalper Outlook:
We don’t chase reversals – we track the footprints of capital. The real edge is understanding where smart money is positioned, and aligning with their narrative.
🔔 Stay tuned for continued updates using this precise and probability-driven Pro SMC framework.
Btcusd techinical analysis.Btcusd techinical analysis next move posibale at h1 time frame not finchinal advice.

If level breaks, the buyers last line of defense will be lost The red-marked zone, which acts as both dynamic and static resistance, is the only hope and the only scenario that could trigger an altseason.

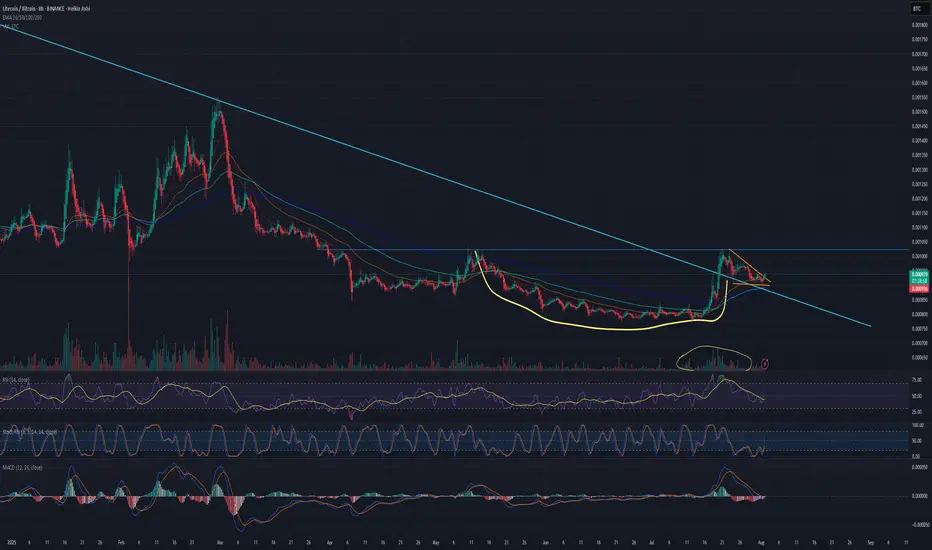
Is Litecoin finally ready to pop for real this time? 1600% gainAs many of you have been, I'm watching crypto prices closely since the BTC jump to $123k, waiting for the next move. Well, today we see that move and the entire market is blood red, except for...
Litecoin.
The patiently waiting little brother of the "big 3", waiting for his time to grow up and shine. Well today I'm impressed, mr. Litecoin is the only green coin in my entire Watchlist.
Zooming in on the chart: there’s a clean, rounded cup and a crisp handle forming, and that handle looks like it’s already breaking out. If Bitcoin can hold the $112K level, I think this could be the start of some serious moves from LTC.
The perfect bull flag that's formed on the chart has good volume too.
That blue line coming down is a long term trendline, and price is consolidating above it.
Still thinking about that "1600%"?
If you zoom out, there's a massive descending wedge forming since 2014 (11 years!!!). If Litecoin finally breaks out of it, the first fib level (.236) is at .01275BTC, that's 1600% up from here.
We'll see.
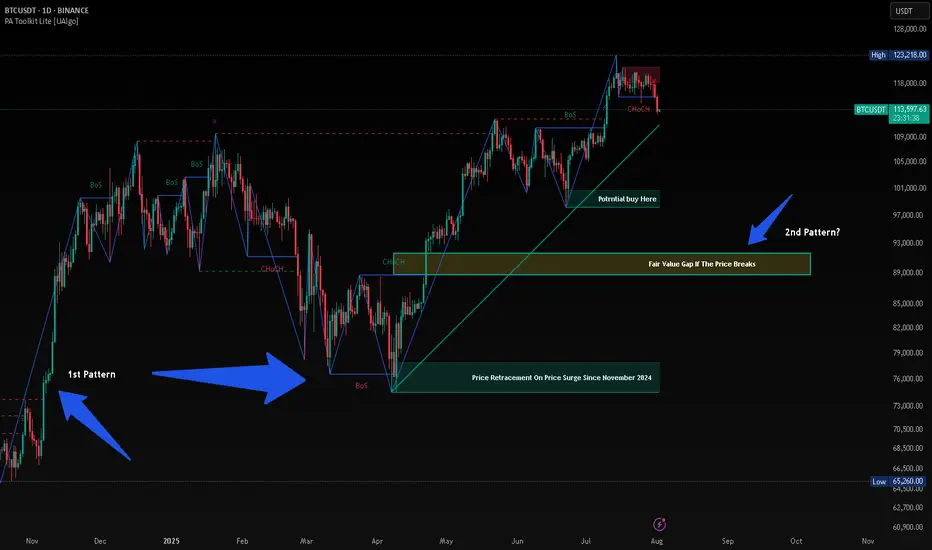
BTC HUNTS LIQUIDITYThis is just my opinion, BTC will hunt liquidity before taking new High. Since November 2024 after President Trump was elected, the price of BTC surge from $74,000 and retrace almost the same price on April 2025 after taking its new High. History will repeat itself and when history failed, there will be a long Bearish at least 90%.
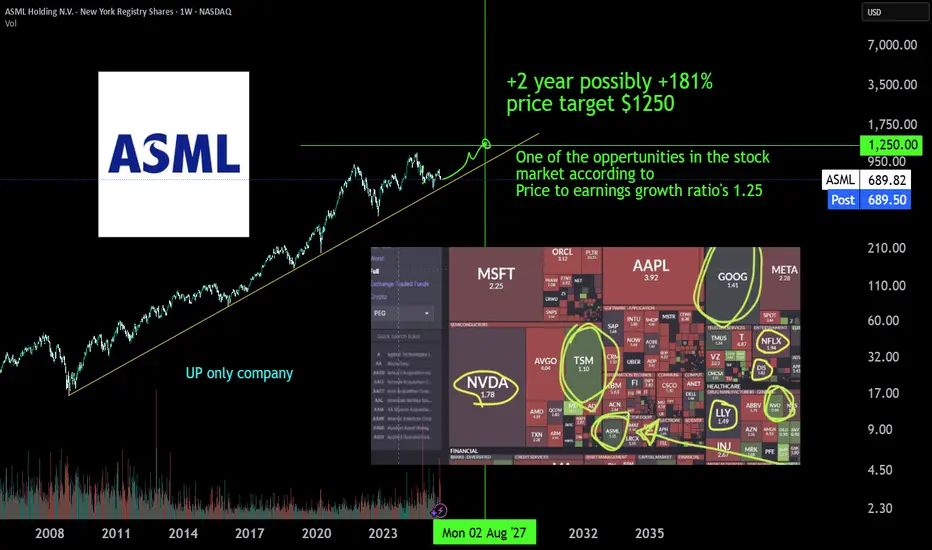
ASML monopolist, a +181% | 2Y oppertunityASML is the monopoly Extreme ultra violet machinery company. There is no one close to it's technology or there is no one investing enough to R&D a thing like it. The whole AI datacenter and cloud chip growth depends on EUV machinery of ASML developed in 2013 (>10y of PhD level R&D deveopment). The first new High-NA EUV systems have been deployed at Intel in July 2025 for research purposes and will scale just like the EUV already does to keep pace with moore's law. TSMC has stated it will not yet buy & depoly the newest machines jet, but has to expand with the 10 year older tech EUV machines just to get the AI chip demand going. AI chip demand at NVIDIA is growing harder than expected comfirmed by latest earnigns of alphabet, microsoft, meta and amazon. The whole AI data center growh depends on 2013 asml tech machines, and they already have a new tech High-NA EUV machine, just figure.
Also don't sleep on BESI a packing machinery wonder, due to hybrid bonding which makes stacking 3D chip structures possible.
#GoHighTechNetherlands
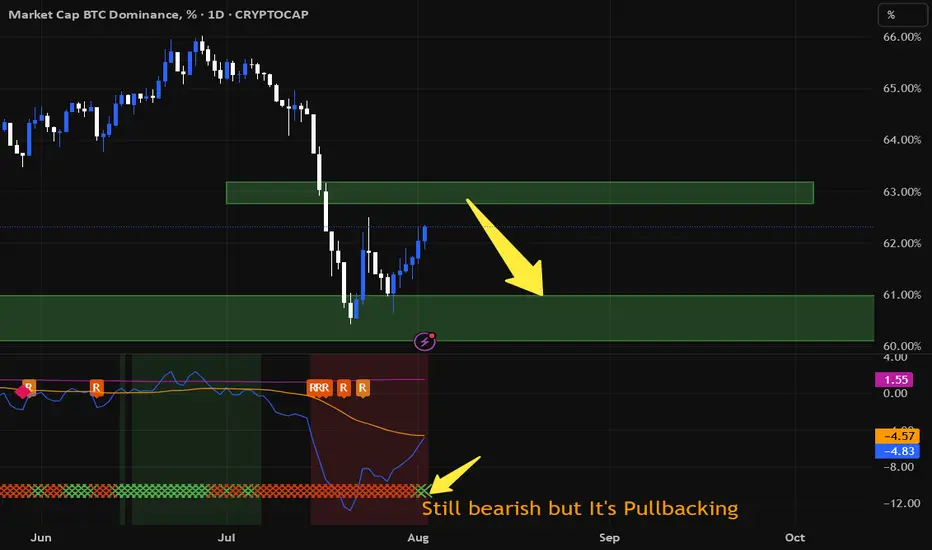
#Bitcoin DominanceWhat I said before is that Bitcoin dominance is in a pull back and the "NEW RSI" indicator also shows it on the daily time frame. Probably, considering the Fibonacci levels at 63%, this pull back is over and after the Bitcoin dominance continues to fall, the pump of altcoins like Ethereum and Ripple will continue.