Bitcoin Go 70k What are you waiting for? It's going to go up more. We have a weekly negative divergence and the correction is now the entire market is bearish.
Trend Analysis

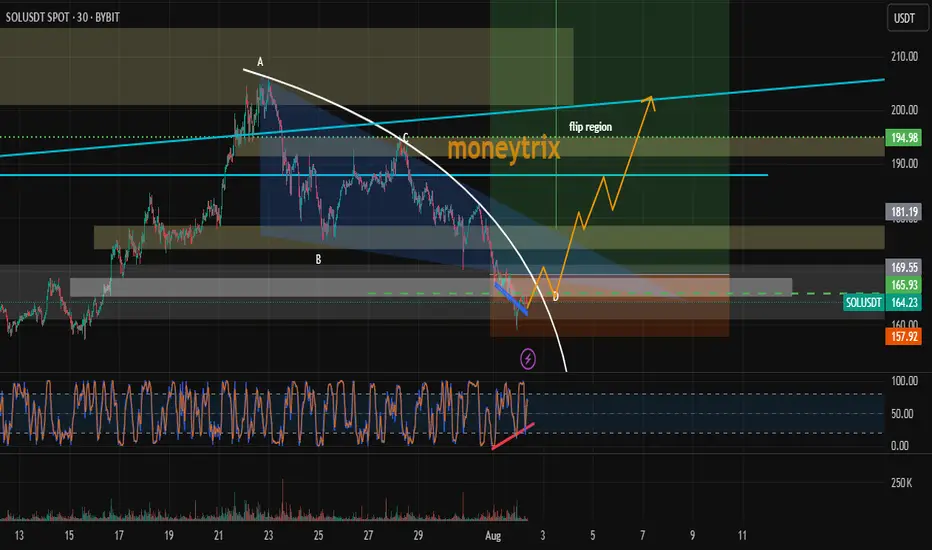
due to rsi divergence and fib zone long sol nowdue to rsi divergence and fib zone long sol now
fib golden zone triggered
demand zone triggred
rsi divergence and many other +ve sentiments
so we longged
its infinit market idea may be wrong so use sl 155$
#dyor too, im not financial advisor
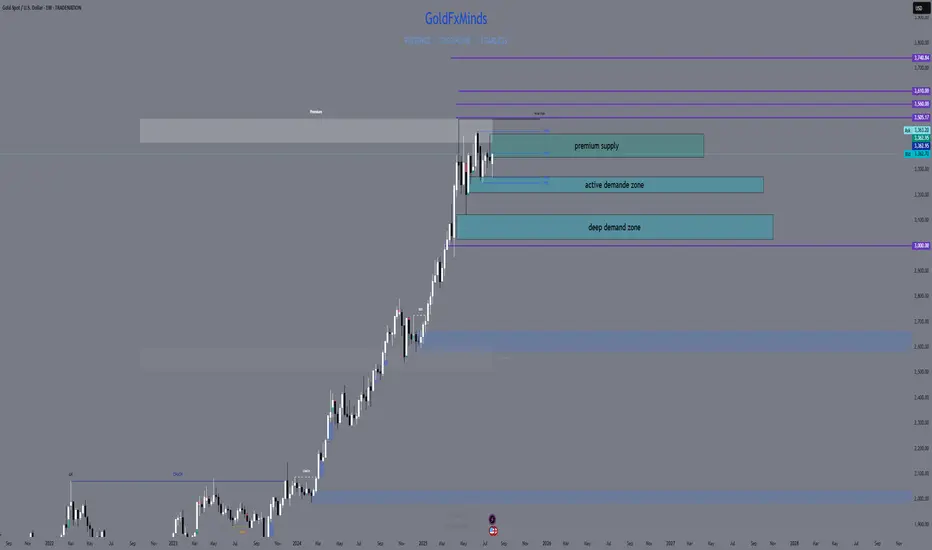
XAUUSD Weekly Outlook – August 4–8, 2025
The question isn’t whether gold is strong. The question is — will price expand, or rebalance?
🔸 Macro Overview
Gold begins the week consolidating just below its final HTF supply zone (3439), while USD weakens amid mixed macro data and growing speculation of future rate cuts. Markets await fresh catalysts, and gold’s recent impulsive rally is now facing the big test: break the wick, or pull back?
🔸 Weekly Structure & Bias
Element Observation
🔹 Trend Bullish continuation — clean structure
🔹 Last BOS March 2025 — impulsive, with imbalance below
🔹 Price Action Top wick rejection forming near 3439
🔹 Bias Still bullish, but entering exhaustion zone
🔹 RSI Above 70 — overheated
🔹 EMAs EMA5 > EMA21 > EMA50 > EMA100 — perfect trend
🔸 Key Weekly Levels (Zones + Confluences)
Zone Type Price Range Confluences
🔴 Supply 3350 – 3439 HTF wick supply + FVG + RSI 70+ + liquidity trap
🔵 Demand 3270 – 3215 Weekly OB + FVG + EMA21 support
🔵 Demand 3120 – 3070 Old BOS + deep FVG + psychological level
🟢 Support 3000 zone EMA50 + historical consolidation
🔸 Fibonacci Extensions (Above 3439)
Extension Level Price Target Confluences
1.0 (Swing Full) 3439 Supply wick high
1.272 3505 Next psychological milestone
1.414 3560 Mid-extension + liquidity
1.618 3610 Golden expansion target
2.0 3740 Full trend extension (max)
🔺 These levels serve as potential breakout targets ONLY if we get a confirmed weekly close above 3439 with clean BOS on LTF.
🔸 Weekly Scenarios
🟢 Scenario 1 – Break and Expand
If gold breaks 3439:
Expect clean continuation to 3505 → 3560 → 3610
Best entries come from new OBs on H4/D1 around 3350–3370
Follow momentum — but don’t chase without retrace confirmation
🔻 Scenario 2 – Rejection + Retracement
If price holds below:
Pullback toward 3270 – 3215 expected
EMA21 acts as dynamic support
If selloff gains strength, next demand = 3120 – 3070
🎯 This zone aligns with macro OB + re-entry for long-term bulls.
🔸 Conclusion & Gameplan
Gold is pressing against its final weekly ceiling.
Structure remains bullish, but every sniper knows — at the edge of premium, timing is everything.
✅ Above 3439 → expansion opens to 3505 → 3560 → 3610
🟦 Below 3439 → retracement into 3270 → 3215 → 3070
The best setups will be born from confirmation, not prediction. Let the market decide.
—
What would you do if 3439 rejects hard this week?
Comment your plan, tag your sniper level, and let’s stay ahead together 💬
—
With clarity, confidence, and perfect timing,
GoldFxMinds 💙
Disclosure: Analysis based on Trade Nation (TradingView) chart feed.
TON/USDT – Daily Price Action Analysis🔹 Price has broken a major descending trendline and entered an ascending channel.
🔹 Currently testing the mid-range resistance zone around $3.60 – $3.70.
🔹 If buyers hold above this area, the next targets could be $4.40 – $4.80.
🔹 If rejected, key supports are at $3.20 and $2.90.

GBP/USD: Post-Impulse Sell Setup from Ending DiagonalThe chart depicts a completed 5-wave impulsive structure, culminating at the top of wave (5). The internal wave structure of the final fifth wave forms a classic ending diagonal pattern, typically signaling a trend reversal or deep correction.
After this extended fifth wave, the price has started rolling over, confirming the start of a corrective decline. The wave count now expects an ABC correction targeting the previous wave 4/2 demand zone, highlighted in red.
Target 1 (T1): 1.33608
Target 2 (T2): 1.32436
Stop Loss (SL): 1.35988
Ending diagonal at the top of wave (5) signals exhaustion of bullish momentum.
Clear bearish divergence (not shown here) is commonly seen with this pattern.
The price has broken the short-term structure and is now forming lower highs.
Target zone aligns with previous wave 2 consolidation – a typical retracement zone for post-impulse corrections.

Long XLMBTC is bouncing from a strong support.
XLM would have another leg up from the local support trendline.
Trade setup is as in chart.

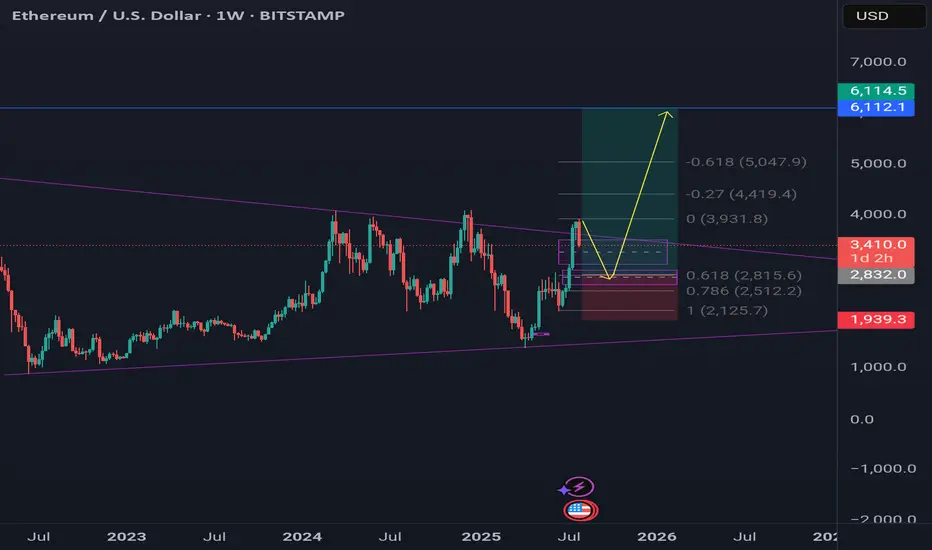
ETHER send it higher and higher and higher.Ether is not going anywhere without makin a new all time high.
Soon 6k ether and even 10k .
The sleeping giant is waking up and when it fully awakes ,it will obliterate everyone.
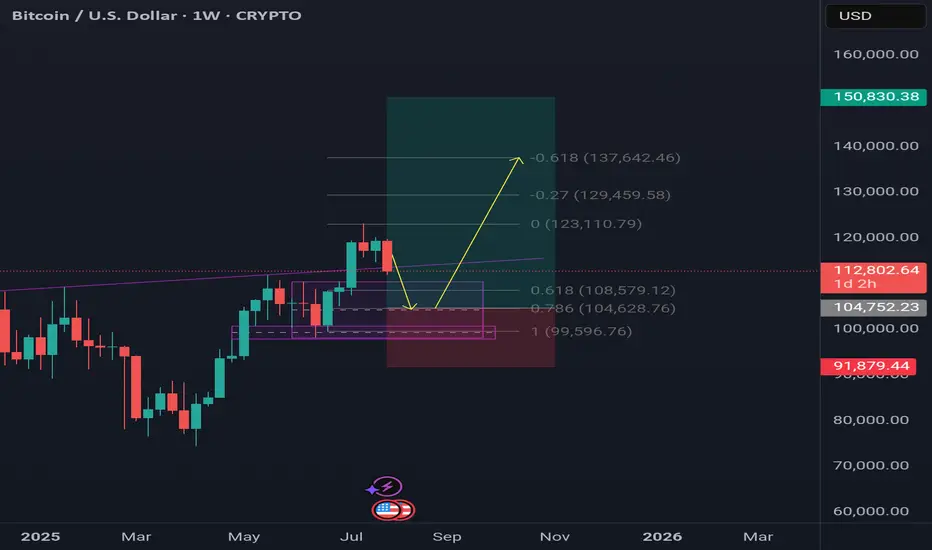
Bitcoin send it higher . I think btc will stop around 104k region amd then it will continue to give us another leg higher.It is not over yet , it still has to offer us another upside movememt.
Lets send it higher.
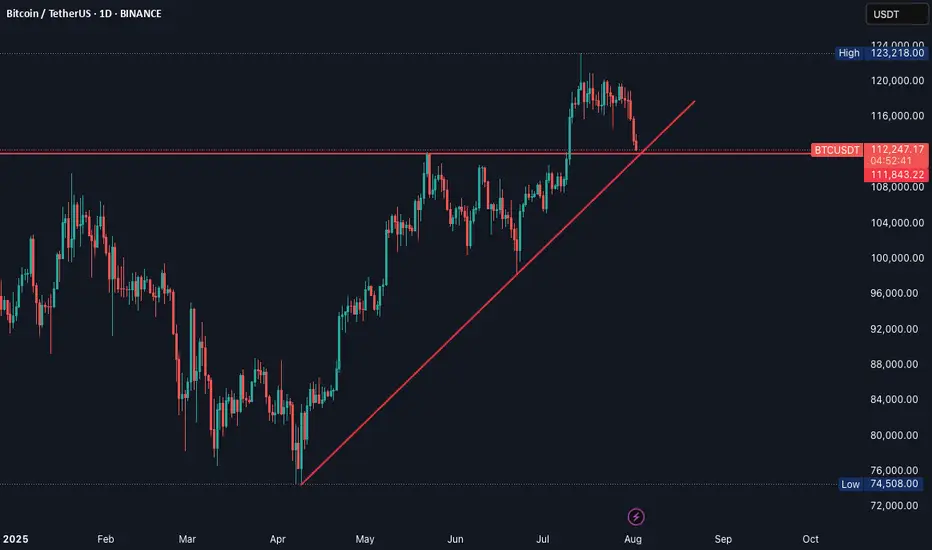
BTC- On a Crucial Testing PointBTC Seems to be testing a strong support point, if it bounce back , it's good opportunity to buy, otherwise sell.
ETHUSDT: Elliot Analysis You can see the Ethereum chart in the long term, which indicates the end of the fourth wave and the beginning of the fifth wave, so with capital management, you can have a good investment.

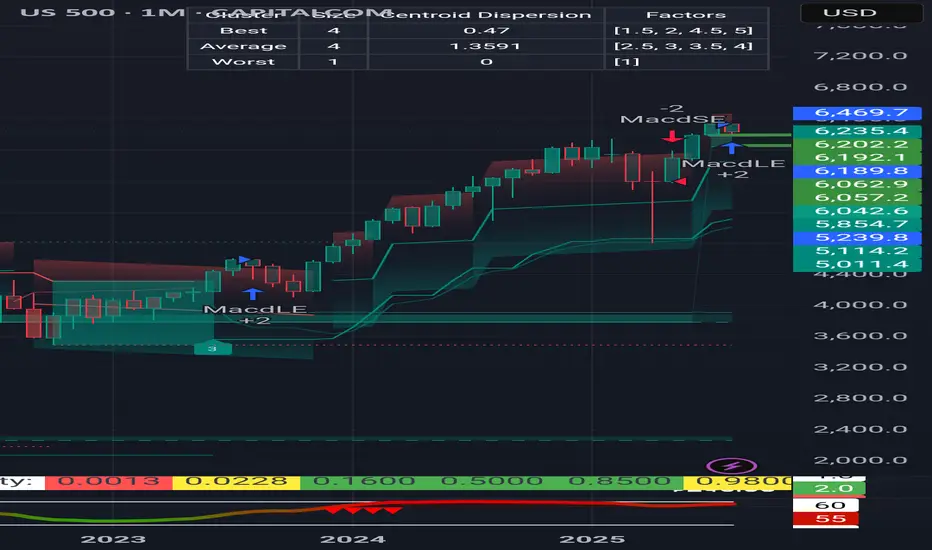
S&P 500 Daily Chart Analysis For Week of August 1, 2025Technical Analysis and Outlook:
During the trading activity of the previous week, the S&P 500 Index displayed a predominantly bearish movement after completing our Outer Index Rally target of 6420, as highlighted in the prior week’s Daily Chart Analysis, with the primary objective now being to plug our Mean Support at 6200.
It is essential to recognize that the current price movement may trigger a significant further pullback to the Mean Support level of 6090. Following this downturn, it is expected that the index will resume its upward momentum, aiming for a retest of the Outer Index Rally peak at 6420.

#SOL Update #7 – Aug 02, 2025#SOL Update #7 – Aug 02, 2025
Solana has broken below the low of its last impulsive move, forming a new, deeper bottom. The first area where it may find support is the $158 level. If this fails, the next support level lies at $147. At the moment, Solana is clearly in a downtrend on the 4-hour chart. For Solana to resume its upward movement and confirm a trend reversal, it needs to break above the $206 level with a strong, high-volume candle. Currently, Solana might be considered a cheap opportunity only for those looking to hold spot positions long-term. Otherwise, I don't see it as a suitable option for trading.

ITC 1D🔺 Triangle Pattern (likely Symmetrical/Ascending Triangle)
Current Price Zone: ₹416
Pattern Type: Likely Ascending Triangle (if higher lows are forming against a horizontal resistance)
Resistance Level: Around ₹416–420
Breakout Confirmation: Needs a strong bullish candle above resistance with significant volume.
📊 What to Watch:
Volume:
A genuine breakout should happen with above-average volume. Watch the 50-period or 20-period average volumes on daily or 1H chart.
Breakout Candle:
Should close above ₹420 ideally. A breakout without closing above resistance is risky.
Retest Possibility:
Sometimes, price may break out and retest the breakout level before continuing the uptrend. Don’t panic if it slightly dips and holds support near ₹416.
🎯 Target Levels After Breakout:
You can calculate the triangle breakout target like this:
Target = Height of triangle + Breakout point
Let’s assume the base of triangle is from ₹375 to ₹416 = ₹41 range
Breakout Target = ₹416 + ₹41 = ₹457
📌 Extended Target (Momentum-based): ₹475–₹500 zone
📌 If volumes + broader market support: ₹500+ is possible, especially in swing or positional setups.
📉 Invalidation (Risk Management):
If after breakout, price falls below ₹410–408 with volume, it could be a false breakout.
Keep a stop-loss below previous swing lows or support trendline.
🧠 Summary:
✅ Triangle breakout with volume = bullish confirmation
🎯 Targets: ₹457 → ₹475 → ₹500
❗ Risk zone: below ₹410
🔁 Retest is common before upmove continues
Disclaimer: The information provided is for educational and informational purposes only and should not be considered as financial advice. Investing in the stock market involves risk, and past performance is not indicative of future results. Please consult with a certified financial advisor or conduct your own research before making any investment decisions. We are not responsible for any losses incurred as a result of using this information. Stock market investments are subject to market risks; read all related documents carefully.

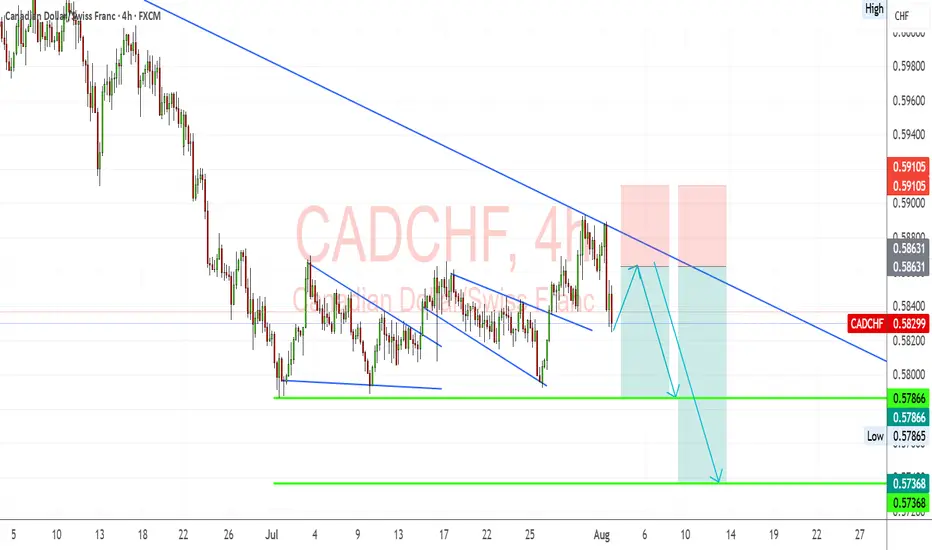
CAD/CHF: Bearish Trend Resumes After Retest of Downtrend LineCAD/CHF continues to respect its prevailing downtrend, with price reacting from the descending trendline and showing signs of renewed bearish pressure. Fundamentals support further downside as CAD remains weighed by weak domestic data, while CHF holds steady as a safe-haven currency amid global tariff concerns.
Technical Analysis (4H Chart)
Trend: Strong downtrend structure, with repeated rejections from the descending trendline.
Current Level: 0.5829, consolidating after failing to break above 0.5863 resistance.
Key Support Levels:
0.5786 (near-term support and first bearish target).
0.5736 (secondary support and next major target).
Resistance Levels:
0.5863 (immediate resistance at descending trendline).
0.5910 (upper resistance if a breakout occurs).
Projection: Likely pullback toward 0.5863 (retest zone) before continuation to 0.5786 and possibly 0.5736.
Fundamental Analysis
Bias: Bearish.
Key Fundamentals:
CAD: Weak Canadian manufacturing PMI and trade risks from US tariffs limit CAD upside.
CHF: Swiss Franc remains supported by safe-haven demand amid tariff uncertainty.
Oil Prices: Stable oil offers partial CAD support but insufficient to change the broader trend.
Risks:
A sharp rise in oil prices could strengthen CAD.
Global risk-on sentiment could weaken CHF and lift CAD/CHF.
Key Events:
BoC policy updates.
SNB stance and global risk sentiment shifts.
Oil market data.
Leader/Lagger Dynamics
CAD/CHF is a lagger, following CAD’s performance relative to oil and CHF’s safe-haven flows.
Summary: Bias and Watchpoints
CAD/CHF remains bearish, with price respecting the downtrend and targeting 0.5786 initially. A break below this level opens the door to 0.5736. The key watchpoints are oil price fluctuations, global risk sentiment, and potential safe-haven demand for CHF.
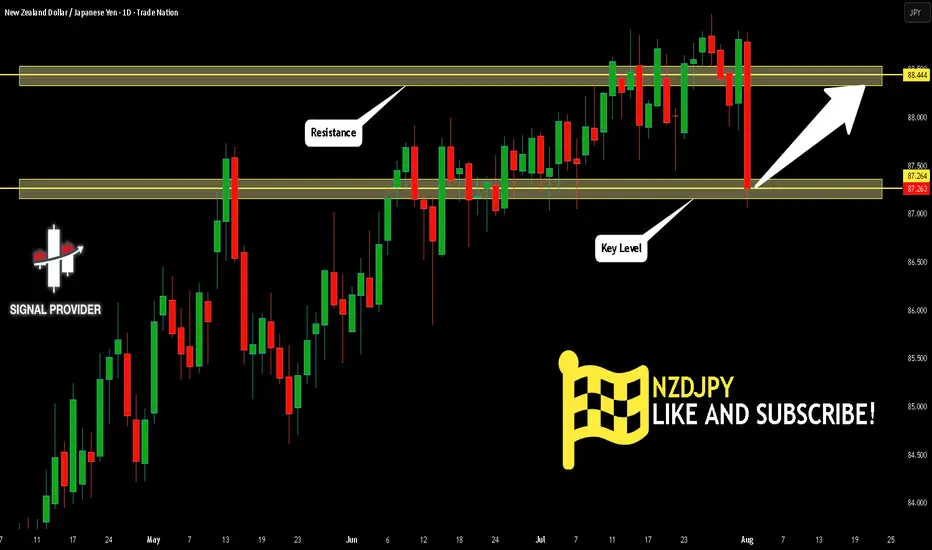
NZDJPY Will Go Up! Buy!
Here is our detailed technical review for NZDJPY.
Time Frame: 1D
Current Trend: Bullish
Sentiment: Oversold (based on 7-period RSI)
Forecast: Bullish
The market is testing a major horizontal structure 87.264.
Taking into consideration the structure & trend analysis, I believe that the market will reach 88.444 level soon.
P.S
Overbought describes a period of time where there has been a significant and consistent upward move in price over a period of time without much pullback.
Disclosure: I am part of Trade Nation's Influencer program and receive a monthly fee for using their TradingView charts in my analysis.
Like and subscribe and comment my ideas if you enjoy them!
Correction will be to 6050-6190, probably the upper limit Now I notice something very important and things and the analyses of many actually coincide. Monthly support from the accumulated volume lies between 6050 and 6170. 4h indicators show a clear reversal. Separately, at these levels are the previous ATH. In my opinion, it is possible to stop even at 6180-6190. We will probably start with a gap on Monday. Now here comes the moment and over the weekend what will take place as conversations and statements in the media, but it is very likely that the minimum could happen as early as Monday night (USA time) or by Tuesday. I agree that this correction was necessary and should have happened as soon as possible because things became difficult even for bulls like me.
Time to catch its breathAfter the break to lower prices in the daily S&P 500 chart, the expectation for Monday is for the market to stop and catch its breath which means are not looking for a big day down on Monday but rather a sideways so only slightly lower move without new fundamental information to stimulate the market.

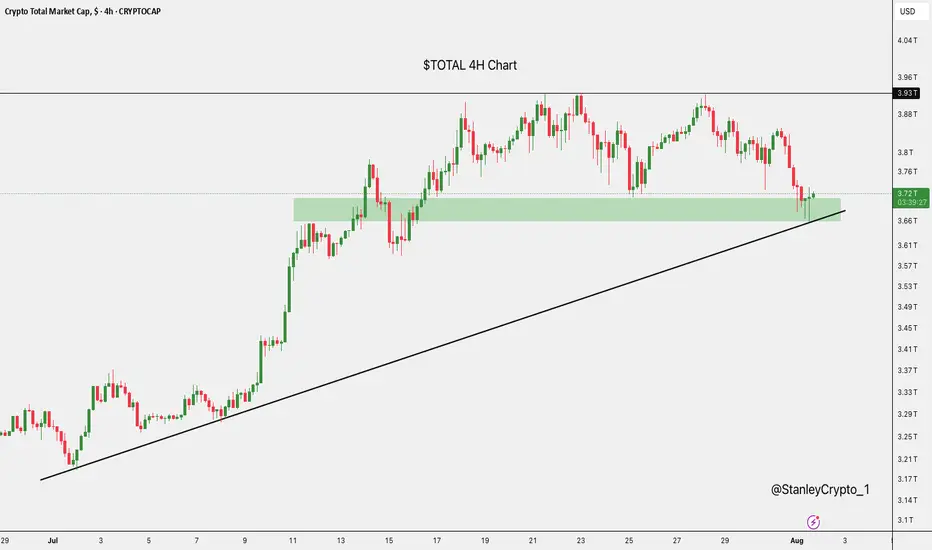
$TOTAL at Key SupportThe crypto market cap has just bounced off a strong support zone around $3.67T, right where it aligns with the rising trendline.
This area has held firm before, and it's doing the same now.
If it continues to hold, we could see a nice recovery.
But if it breaks down, there’s a risk of more downside ahead.
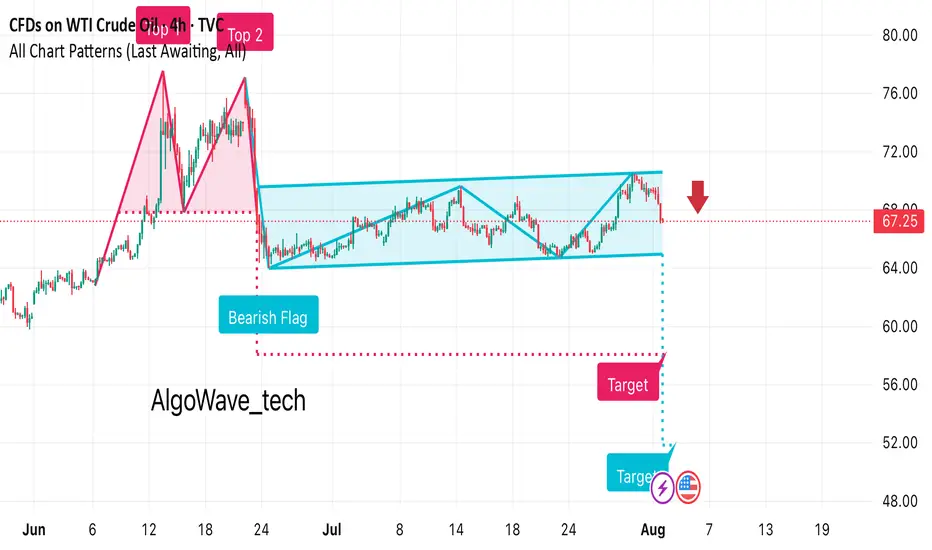
It looks like this chart for WTI Crude Oil is showing a bearish • Previous Move: There’s a strong downward leg before the flag formation, indicating bearish momentum.
• Flag Pattern: Price consolidates in an upward-sloping channel after the drop.
• Breakout: The chart suggests a bearish breakout below the channel, marked with a red arrow at around $67.25.
• Target Projection: The measured move target appears to be around the $53–54 range, based on the flagpole height.
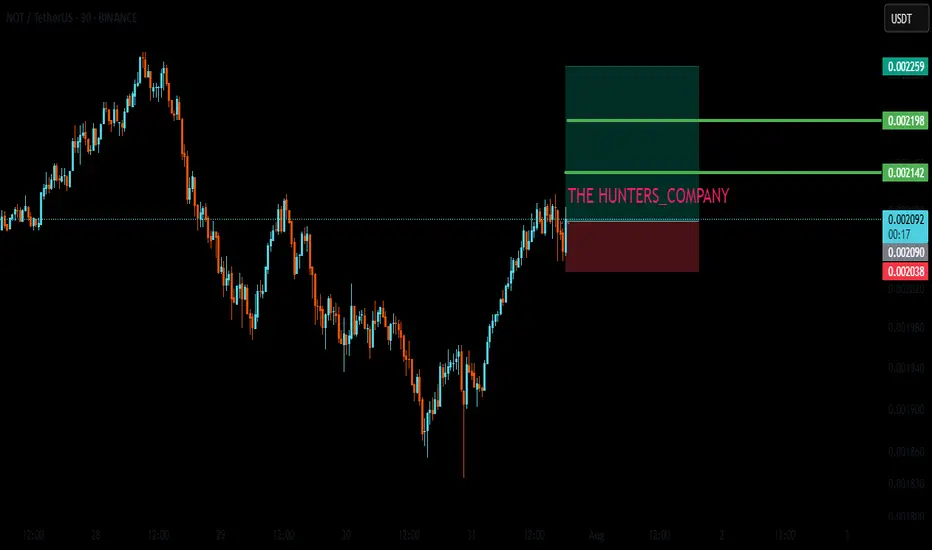
LIVE TRADEHello friends🙌
Given the good trend we had, now that we have had a price correction, we can enter the trade with risk and capital management and move towards the specified goals.
🔥Follow us for more signals🔥
*Trade safely with us*
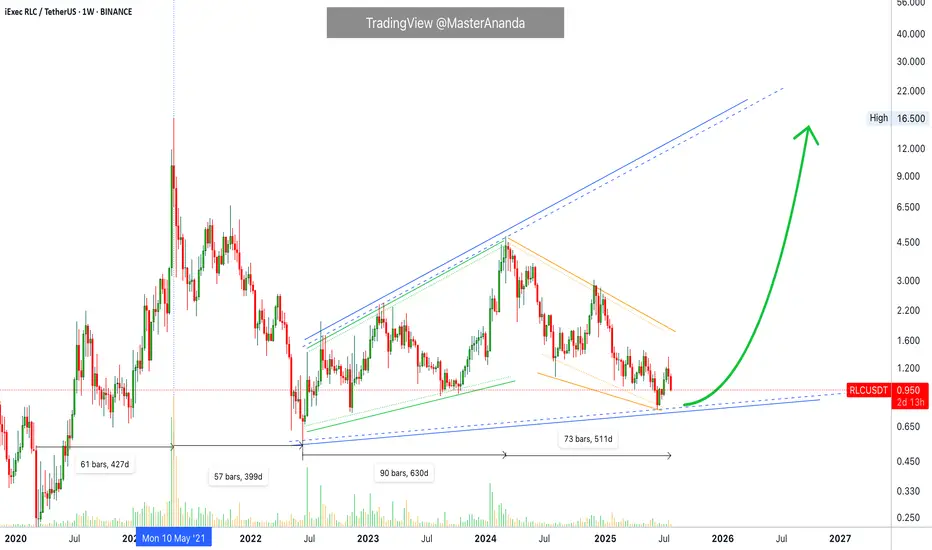
iExec RLC · Trading at Bottom with a Bullish BiasiExec RLC (RLCUSDT) is still trading at bottom prices but the overall market conditions are good. Good for the future because the market moves in waves alternating always between rising and falling.
RLCUSDT went bearish between May 2021 and June 2022, 399 days. Then it went bullish from June 2022 to March 2024, 630 days. Then it went bearish again between March 2024 and present day, August 2025. More than 510 days.
While RLCUSDT has been bearish more than a year, the action is still happening as a long-term higher low. That is, prices today and at the lowest—16-June 2025—are still higher compared to the low in June 2022.
Of course before being bearish in 2022 the market was bullish between March 2020 and May 2021, 427 days. Here we can clearly see the fluctuations between bear and bull, uptrends and downtrends.
The last uptrend came in 2021 and we are due a new one. Crypto grows every four years and market conditions are perfect for the next run. The market has been mixed, sideways and neutral for years on end, the long-term higher low is a single of strength. After the current retrace is over, you can prepare for a major bullish wave.
Namaste.
How to seize the key turning points in the gold market?The market is ever-changing, and following the trend is the best strategy. When the trend emerges, jump in; don't buy against it, or you'll suffer. Remember not to act on impulse when trading. The market is a haven for all kinds of resistance, so don't hold onto positions. I'm sure many people have experienced this: the more you hold onto positions, the more panic you become, leading to ever-increasing losses, poor sleep, and missed opportunities. If you share these concerns, why not try following Tian Haoyang's lead and see if it can open your eyes? I'm always here for you if you need help, but how can I help you if you don't even offer a hand?
Gold did not fall below 3280 during the day on Friday and started to fluctuate in the range of 3280-3300. The non-farm payroll data was bullish, and it directly broke through the pressure of 3315, and then broke through the important pressure of 3335 again. As of now, it has reached a high near 3355. The non-farm payroll data market has almost been exhausted. Next, we will focus on the technical form adjustment. At present, you can consider light shorting in the area near 3355-3370. After all, chasing long is risky, and the technical side needs to be adjusted. If your current operation is not ideal, I hope I can help you avoid detours in your investment. Welcome to communicate with me.
Based on the 4-hour chart, short-term resistance is near 3355-3365, with a focus on the key resistance level of 3370-3375. Short-term buy orders should be taken if a rebound continues. I'll provide detailed trading strategies at the bottom of the page, so stay tuned.
Gold operation strategy: Short gold in batches when gold rebounds to 3355-3370, with the target being the area around 3340-3335. Continue to hold if it breaks through.

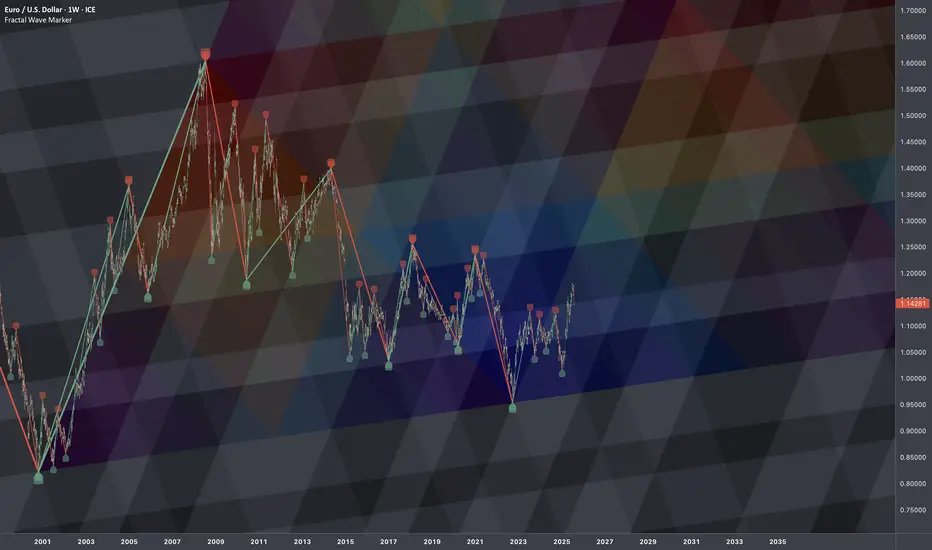
€/$: Fractal Geometry (Cycle 2000-2022)🏛️ Research Notes
Research on order in chaos using scaling laws and math sequences found in nature.
Sierpinski triangle will be used as basic heatmap layer - orienteer for next buildups.
Cross-cycle interconnection 3 cycle knot
Considering the fact that structurally current price is in a new cycle, the core structure which is previous cycle can be extended with another layer that emphasizes phase of the cycle in its angle.
Extended Fibonacci Sierpinski Triangle should look like this: