EURUSD BUYING CORRECTION AND SHORTThe price is now at a strong support level and if it can be a double bottom it will retest the descending channel line and reach the orange resistance, but in the general direction the price prefers to fall due to breaking the black uptrend line. We also have a more beautiful scenario, which is if it can break the strong support we will go with the downward trend.
Trend Analysis

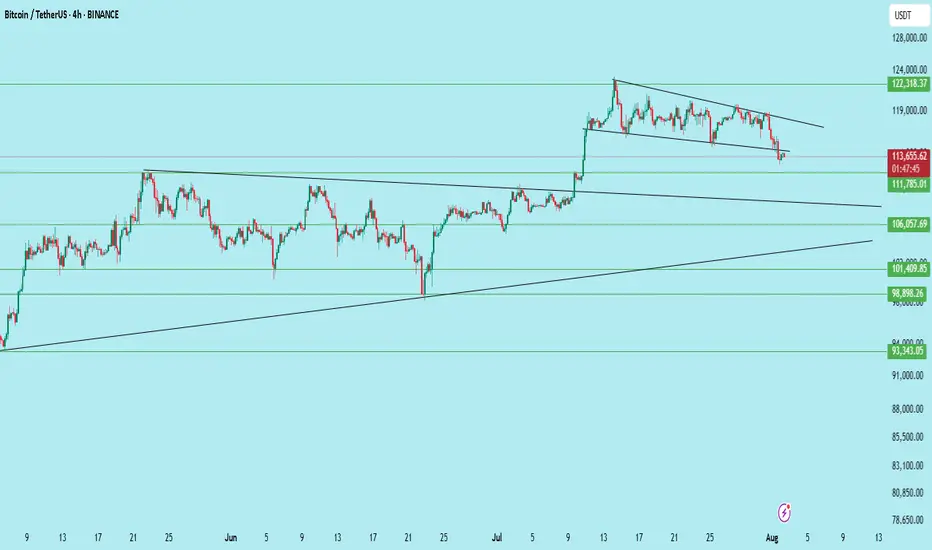
$BTC /USDT – Breakdown from Channel, Bears Gaining ControlBitcoin has broken down from its descending channel on the 4H chart after repeated rejection from the upper trendline. Price is now hovering near key support at $111,785.
Key Technicals:
Rejection from the descending trendline resistance
Breakdown of the mini-channel structure
Current price: $113,637
Support levels:
$111,785 (Immediate)
$106,057
$101,409
$98,398
Bearish continuation is likely if $111,785 breaks with volume
If the $111.7k zone fails to hold, BTC could see further downside toward $106k and even $98k in the coming sessions.
Invalidation: Bullish only on reclaim of $117K+ with strength.
DYOR | Not Financial Advice
SOLANA BULLISH MEGAPHONE PATTERN LOADING! solana continues to move step by step towards higher levels within the bullish megaphone pattern, which will make movements towards ATH and more inevitable in the coming period

Eurusd sell pending order set already. Hopefully on mondayBased on my technical analysis, I strongly speculate EURUSD fall on Monday.
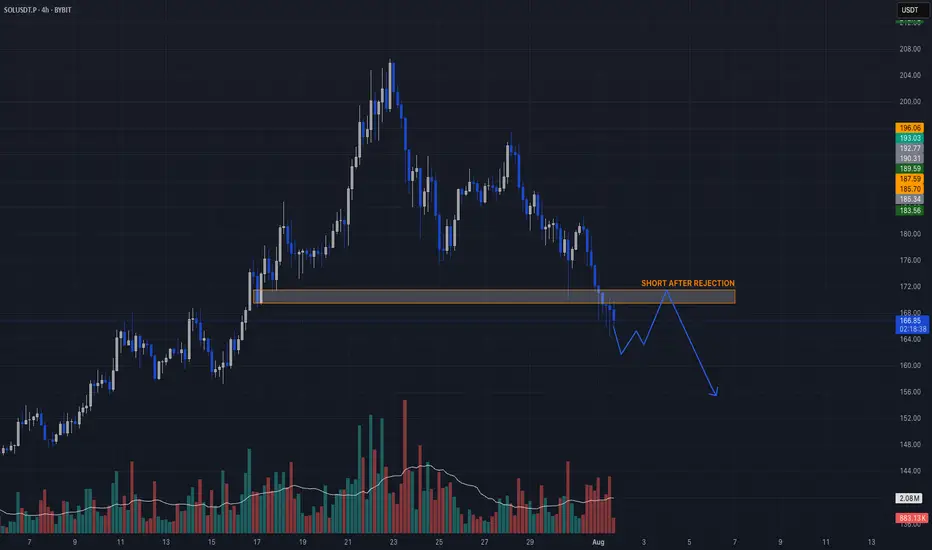
Momentum Continuation after Structural BreakdownHey Candle Fam,
We’re eyeing a clean short setup on SOL after structure broke down and buyers failed to hold key levels. Time to fade the bounce and let the market do the work.
🔥 SOLUSDT.P TRADE IDEA 🔥
Bias: Short
Strategy: Momentum Continuation after Structural Breakdown
Entry: 169.50 – 171.80
Stop Loss: 174.60
Take Profits:
▫️ TP1: 165.10
▫️ TP2: 161.30
▫️ TP3: 158.00 (extension target)
⸻
📊 Rationale:
– HTF structure: Sharp retracement from $215 top, lower highs forming
– LTF structure: Breakdown confirmed, no bullish CHoCH present
– Liquidity targeting: Clean sweep zones below $165 and $160
– Order flow: Sell-side delta dominance, funding positive = longs could unwind
– Volume profile: Imbalance between $172–175 now acting as rejection zone
🎯 Idea: Look for a minor pullback to $170–172, then ride downside liquidity flush. Protect profits fast if market spikes unexpectedly.
⸻
🧠 Stay sharp. Trade smart. Let the market come to us.
Candle Craft | Signal. Structure. Execution.
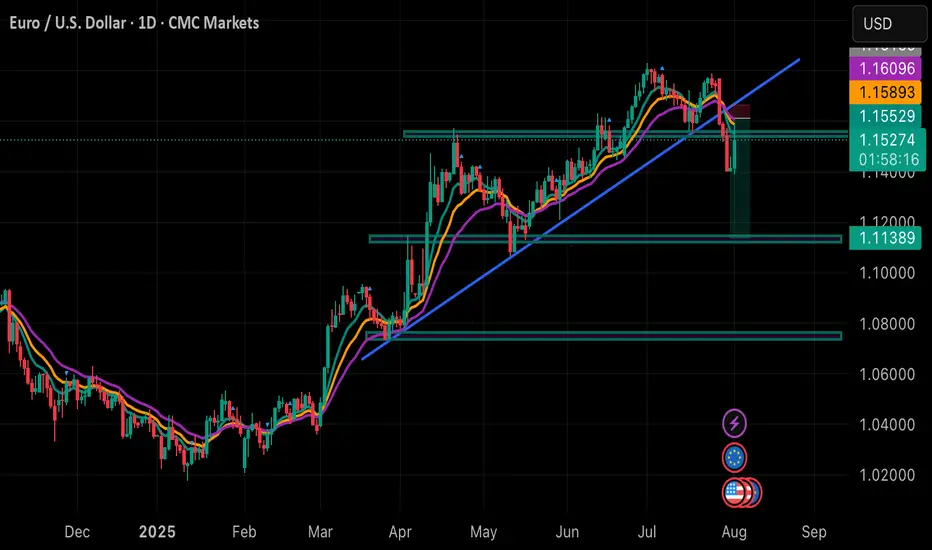
Head & Shoulders on EUR/USD daily!We're currently observing a significant Head & Shoulders pattern forming on the EUR/USD daily chart, with the price just breaking below the neckline on the right shoulder.
Applying standard Head & Shoulders trading principles, we measure the distance from the head's peak to the neckline and project that same range downward from the breakdown point. Based on this, the estimated target price (TP) for the trade lands around $1.135. The stop-loss will be positioned just above the right shoulder to manage risk effectively.
We'll be watching closely to see how this setup unfolds. 🍻

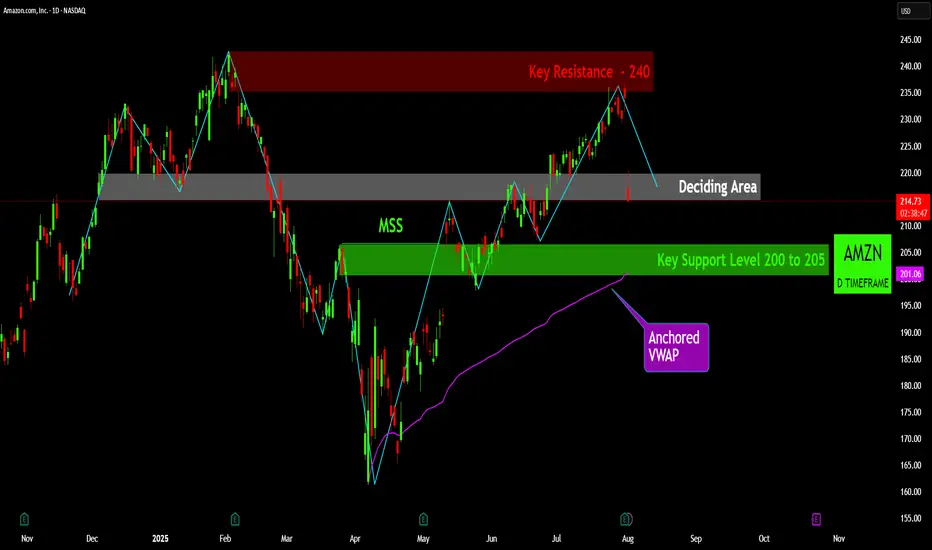
AMZN: The Battle for Direction at a Critical JunctureThe recent price action for Amazon (AMZN) is currently navigating a critical juncture, having pulled back from a significant resistance level and now consolidating within a pivotal "Deciding Area." A detailed review of the key technical levels reveals the following insights:
Key Resistance ($240): A formidable resistance zone is established around the $240 price point. This level represents a major overhead supply area, where prior selling pressure has been strong enough to halt upward price movements on multiple occasions. A decisive breach of this level on strong volume would be a highly bullish development, signaling a potential move to new highs.
Key Support Level ($200 to $205): A robust support zone is identified between $200 and $205. This level has historically served as a strong price floor, absorbing selling pressure and providing a foundation for subsequent rallies. The integrity of the current uptrend is heavily dependent on the price holding above this critical area.
Market Structure Shift (MSS): The formation of a "Market Structure Shift" earlier in the year was a pivotal technical event. This change in market dynamics marked a significant transition, signaling a potential reversal from a prevailing downtrend to the current bullish phase. The subsequent rally from the lows validates this structural change.
Anchored VWAP: The Anchored Volume-Weighted Average Price (VWAP), anchored from the most recent major low, is serving as a dynamic and trend-defining support level. This indicator reflects the average price paid by investors since the start of the current trend. A sustained close below this line would be an early warning sign of weakening momentum.
Deciding Area: The stock is presently trading within a "Deciding Area" situated just below a previous swing high. This zone represents a period of consolidation and indecision as the market digests the recent pullback from resistance. The outcome of this consolidation will likely dictate the short-term directional bias. A break to the upside would suggest a renewed attempt to challenge the $240 resistance, while a breakdown would likely lead to a retest of the primary support level at $200-$205.
Summary of Outlook: The overall technical picture for AMZN indicates that the stock is at a critical inflection point. The health of the underlying uptrend remains intact as long as the price holds above the key support levels and the Anchored VWAP. A definitive move out of the "Deciding Area" will provide the next clear signal for either a renewed push toward resistance or a deeper pullback to test established support.
Disclaimer:
The information provided in this chart is for educational and informational purposes only and should not be considered as investment advice. Trading and investing involve substantial risk and are not suitable for every investor. You should carefully consider your financial situation and consult with a financial advisor before making any investment decisions. The creator of this chart does not guarantee any specific outcome or profit and is not responsible for any losses incurred as a result of using this information. Past performance is not indicative of future results. Use this information at your own risk. This chart has been created for my own improvement in Trading and Investment Analysis. Please do your own analysis before any investments.
ETH/USDT | ETH Under Pressure – Watch $3500 Support!By analyzing the Ethereum chart on the weekly timeframe, we can see that after reaching the $3940 zone, ETH faced selling pressure and is now trading around $3540. If the price fails to hold the key $3500 support, a deeper decline is likely, with potential targets at $3040 first and possibly $2680 as the second bearish target.
Please support me with your likes and comments to motivate me to share more analysis with you and share your opinion about the possible trend of this chart with me !
Best Regards , Arman Shaban

AUDUSD TRADE RECAPIn this video I explained the reasons as to why I didn't take AUDUSD and why I opted to trade GBPUSD! This can be the video that you need to watch before you close up the week. Wishing a good weekend guys

BTCUSD looking for corrective drop towards $111K!1). "Indecisive" weekly Doji retail candle! 2). Price rejection off higher times! 3). Risk indicator is heading south! 4). Trump said "BUY!" 5). There appears to be a cluster of "BUY" orders around $114$K as typically, price drops to trigger those orders!

Pattern targetIn the previous analysis, we spotted a head and shoulders pattern and mentioned that if it gets activated, it will hit the pattern target — and that’s exactly what happened.
A clean and beautiful setup.
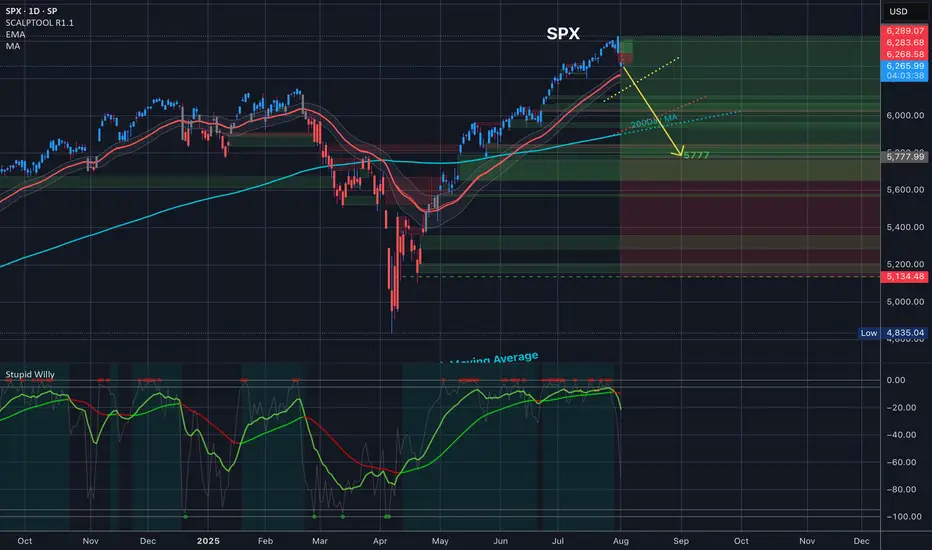
$SPY $SPX 5777 Target for end of AugustAMEX:SPY SP:SPX 5777 Target for end of August
What do you guys think here?
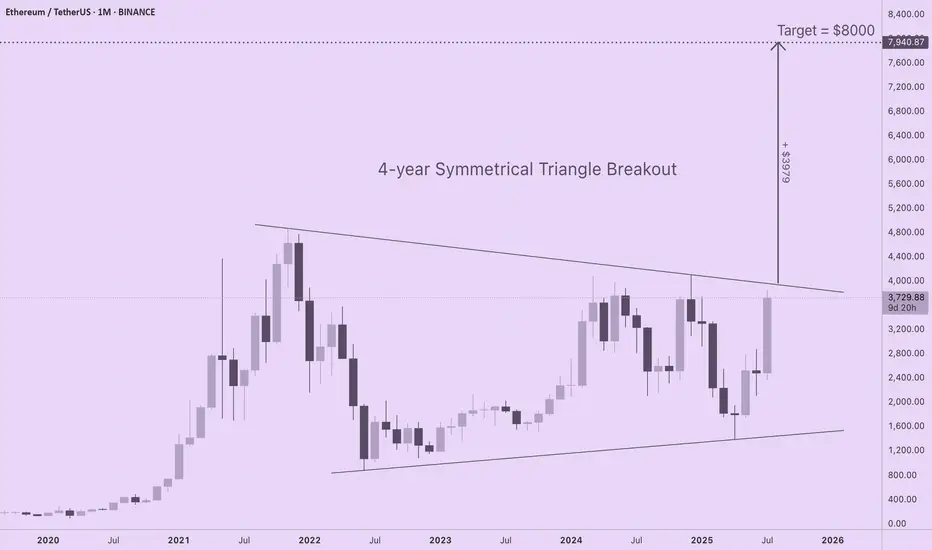
ETH Targets $8000 with 4-Year Symmetrical Triangle BreakoutIf you are seeking realistic ETH price targets based upon solid long-term market structure, check out this 4-year symmetrical triangle forming on the ETH/USD monthly chart. ETH is coiling for a major move to $8000, yet none of the CT "influencers" I follow are talking about this. I am new to technical analysis, so I am interested in learning your thoughts about this pattern and which tools or indicators you prefer for setting price discovery targets.
For those of you new to technical analysis, symmetrical triangle patterns can form on long timeframes (weeks, months, or years), indicating indecision between bulls and bears as price compresses within a continually narrowing range. A breakout from a symmetrical triangle typically follows the direction that preceded their formation, and the longer the consolidation period, the stronger the move.
The chart shows a strong euphoric phase in 2021 followed by a bear market low. Subsequent failure to reach previous ATHs is balanced by a pattern of higher lows. Since ETH was in an uptrend prior to triangle formation, odds are this is a continuation pattern, especially given profound shifts in capital flows and sentiment for the asset over the last several weeks.
With trendlines set at the price extremes, the height of the triangle is roughly $3980. If a breakout occurs at a price of $3960, ETH will target a price of $7940 (height of triangle + breakout price). A more conservative price target of $7000 is obtained by resetting the trendlines at the monthly opening and closing prices (omitting the wicks).
Regardless of the specific method for drawing the triangle, ETH is primed for a major move to the upside that has been four years in the making.
Solana coin Long setupIn this video I go through the current price action and talk about how the 126$ target level was recently reached for a clean long entry and on the daily timeframe we printed a higher low .
I expand on my thoughts for a continuation to the upside and to retest some higher levels of resistance 180$s and time will tell if we print a higher high at the 180$s before retesting the $200 zone .

“Exactly What I Saw” promises value and transparency.
In today's analysis, I’ve identified a clear completion of Wave D, securing a 3% ROI across just two trades – all before the move unfolded.
🔍 What’s inside this breakdown?
• Multi-timeframe analysis: Weekly ➝ Daily ➝ 4H ➝ 1H
• Elliott Wave structure with confluence zones
• Trade psychology at key turning points
• Exact entry & exit insights explained
• Risk management for consistent returns
---
⚡ Highlights:
Precise reversal spotted before it was obvious
No indicator clutter – just clean, confident price action
Part of my 100-day breakdown series: real, raw, and repeatable setups
---
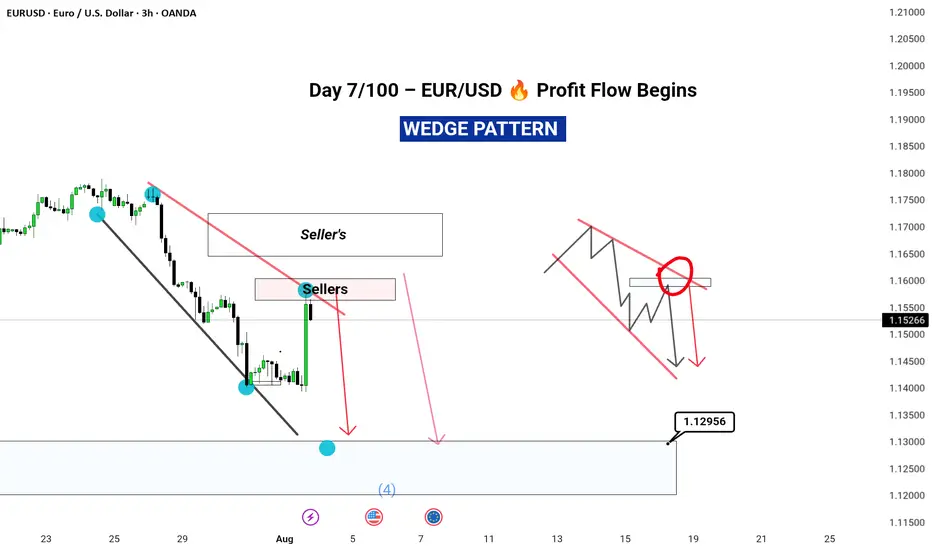
👣 Day 7 of 100 is just the beginning.
Tap Follow to stay ahead of the market – one wave at a time.
#EURUSD #ForexAnalysis #ElliottWave #Forex #TradingViewUK #SwingTrading #PriceAction #RiskReward #FXMindset #ForexTradersIndia #ForexEducation
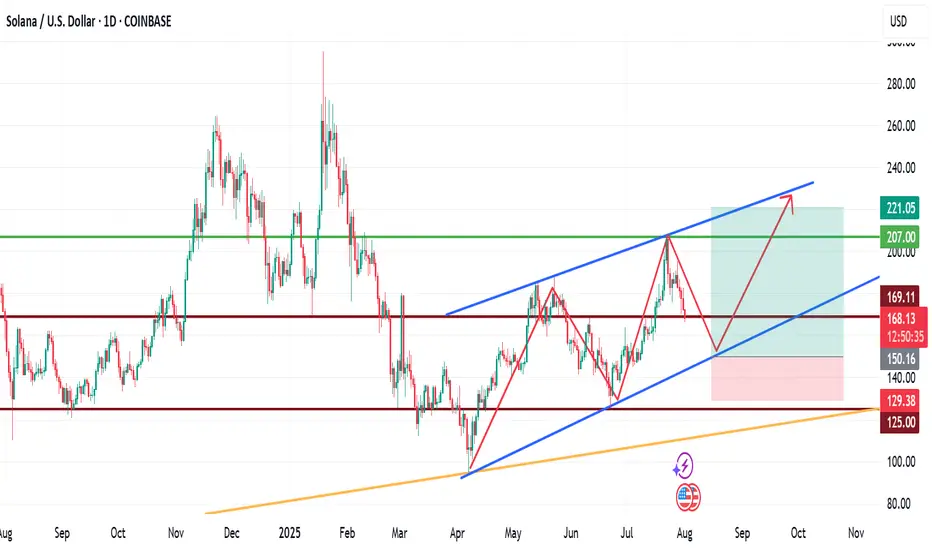
My View for SOLANA next moveMy View for SOLANA next move.
Technically, SOL has been trading within a channel for a while now, with the formation of HHs and HLs.
If fundamentals play out positively long to mid-term, we are likely to see SOLNA fall to $150 zone before another upward leg forms. This leg may rally to as high as $220.
Trade with care.
If you found this helpful, please connect with me.
Like, comment and share
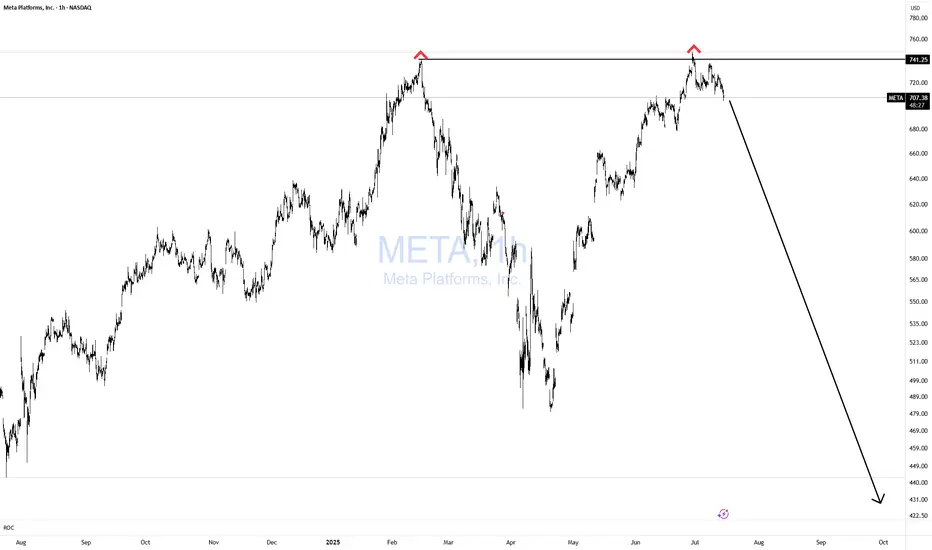
META Double Topping!Does it get any easier than this? NOPE!
If you can't spot this pattern from 1000 miles away, then you need a lot more time in the seat, training yourself in TA.
Simple with great risk reward!
Bulls GTFO!
Gold Showing Signs of Reversal After Hitting Key ResistanceHello Guys.
Gold has reached a major resistance zone around 3439–3425, which has already acted as a strong ceiling in the past. The price tapped into this area again, forming a clear divergence, and failed to break higher.
Here’s what stands out:
Divergence signals a weakening bullish momentum at the top.
The price rejected the resistance and is now breaking structure to the downside.
A minor pullback may occur before continuation, as shown in the projected moves.
First target: 3259.792
Second target (if support breaks): 3136.869, a deeper zone for potential bounce or further drop.
This setup hints at a bearish trend building up. Stay cautious on longs unless the price structure changes again.

SSGC – BUY SIGNAL | 01 AUGUST 2025SSGC – BUY SIGNAL | 01 AUGUST 2025
The stock recently broke out of a bearish channel (marked light pink) and made a high of Rs. 47.41. Since the breakout, it has been undergoing a lateral pullback, which now appears to be complete based on the volumetric profile and recent price action. With momentum shifting back in favor of buyers, SSGC is poised for the next leg upward.

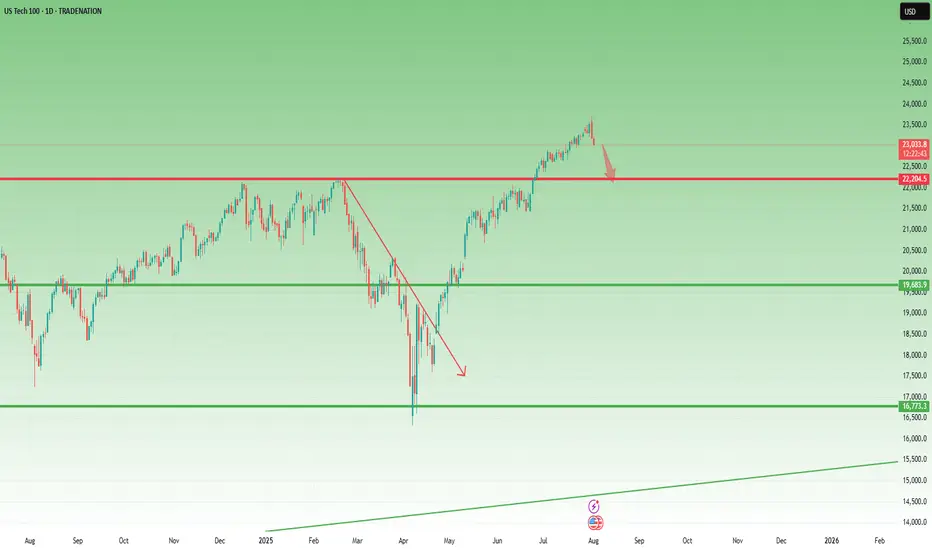
Top in Place? NASDAQ100 Signals Exhaustion After Incredible Run📈 The crazy run since April
NASDAQ100 has had a spectacular run since early April, when the index dipped to 16,300 amid rising tensions caused by Trump’s tax war. From that low, we’ve seen a mind-blowing rally of over 7,000 points, which translates to a 40% gain in just 4 months.
Such a rise is not just impressive— it’s overextended , especially by historical standards. Markets don’t move in straight lines forever, and this one might be showing signs of fatigue.
🕯️ Bearish signal at the top
Fast forward to this week: yesterday, the index marked a new all-time high at 23,700, but closed the day with a strong bearish engulfing candle — one that wipes out the gains of the previous 4 trading sessions.
This is not a small technical detail. Such candles, when appearing after an extended rally, often signal exhaustion and a potential shift in momentum.
❗ Top in place?
In my opinion, there's a high probability that a top has been set, at least temporarily. We might be looking at the beginning of a healthy correction, or even something more meaningful, depending on follow-through in the next sessions.
📉 Where to next?
The first major support to watch is the 22,200 level.
I expect that zone to be tested soon — and honestly, considering how much the index has gone up, this shouldn’t surprise anyone. It’s nothing more than a minor pullback, all things considered.
🧠 Stay smart!
When markets go vertical, it pays to stay disciplined and realistic. Tops rarely announce themselves, but when signals like this appear, it’s wise to listen.
Disclosure: I am part of TradeNation's Influencer program and receive a monthly fee for using their TradingView charts in my analyses and educational articles.
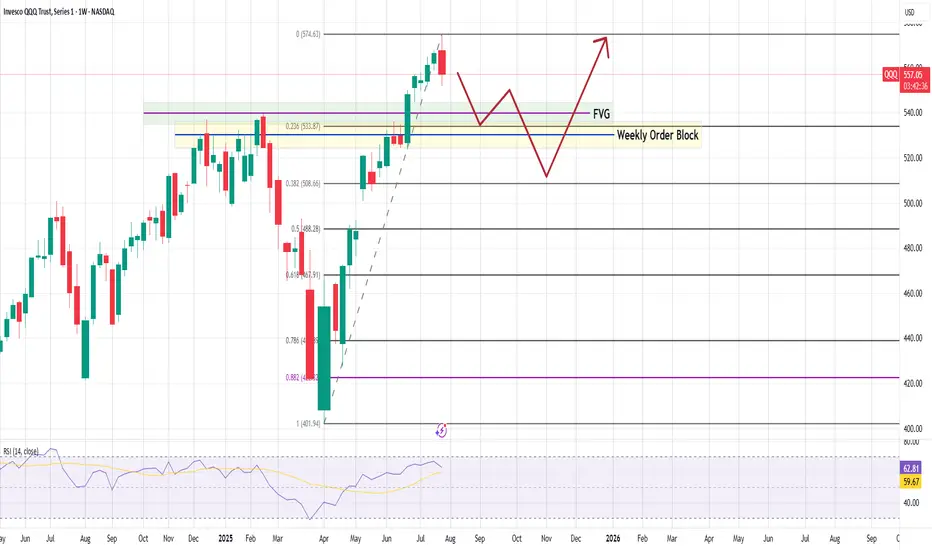
#QQQ Weekly Chart – Technical Breakdown As of August 1, 2025QQQ Weekly Chart – Technical Breakdown
🧠 Key Observations
Bearish Weekly Rejection
A red candle at the recent high ($574.63) suggests buyers are taking profits.
Short-term reversal likely in play.
First Reaction Zone:
0.236 Fib at $533.87 is the first potential bounce zone.
Aligned with:
Fair Value Gap (FVG)
Upper range of the Weekly Order Block (OB)
Deeper Demand Zone:
If $533 fails, the Weekly Order Block becomes critical.
That zone stretches down toward $520–$508 (Fib 0.382).
Strong historical reaction area — may attract long setups if macro aligns.
RSI Divergence Risk:
RSI shows some signs of flattening.
Still above 59, so momentum is intact — but weakening.
📉 Pullback Path (Base Scenario):
Potential move to $533 → $520, consolidating inside the order block
From there, bullish continuation back toward $575+
Invalidated below $500, where structure breaks
📈 Mid-Term Bullish Bias Intact
Strong uptrend, higher lows still in place
Any dip into the OB + FVG zone = buy-the-dip opportunity.
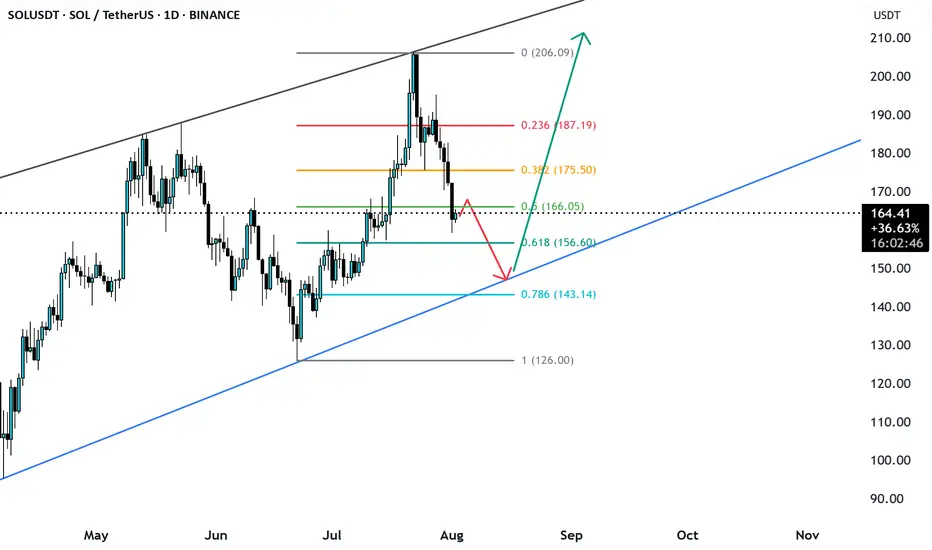
SOLUSD broke the 0.5 fib level is likely to go down SOLUSD yesterday broke the O.5 Fib level and price may further go down to trendline support from where price may get reverse.
GBPUSD MULTI TIME FRIME ANALYSISBased on the TREX method, this analysis is expected to be bearish, but the market is 50-50 and the pound may break the zone and rise.
If the sound quality is bad, forgive your greatness.
