Buy HBARHBAR is the native cryptocurrency of the Hedera network, a high-performance, enterprise-grade public blockchain alternative that uses a unique consensus algorithm called Hashgraph.
Governed by a 39-member global Governing Council, including:Google, IBM, Boeing, Dell, Ubisoft, Deutsche Telekom. These members run nodes and vote on governance, making the network decentralized, but enterprise-friendly.
HBAR still in the box formed since January 2021 but it has potential to break-out. Actually, the first leg-up has started and curently price is consolidating before the second legup. with potential to break out the box.
Trade setup is as in chart Target is estimated based on market cap of 11B.
Trend Analysis

Ascending Channel Bounce – Long SetupAscending Channel Support Test – Potential Reversal Setup 📈
Price has just tested the lower boundary of the ascending channel and reacted strongly, signaling potential buying interest at this level.
RSI is hovering near the oversold zone, adding confluence to a possible bullish reversal scenario.
Trade Idea:
Entry: 0.89
Target 1: 1.178
Target 2: Previous swing high at 1.69
Stop-loss: Below the channel support breakout
A break and hold above 1.178 could pave the way for a continuation toward the previous high. Watching for volume and bullish candlestick confirmation before adding to the position.
#TechnicalAnalysis #AscendingChannel #RSI #CryptoTrading #ChartPatterns #PriceAction #TradingSetup #BullishScenario #SupportAndResistance #SwingTrade #CryptoSignals

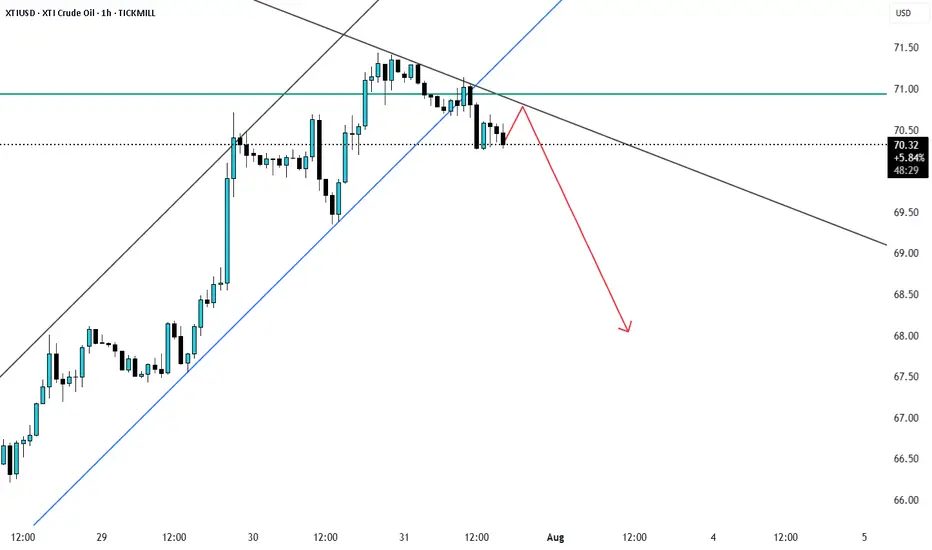
XTIUSD rejection from fib 0.5 XTIUSd recently pulled back to fib0.5 level and is currently looks to be reversering as support trendline broke and price may reject from here.
Natural Gas Rebounds from Key SupportNatural gas has bounced off its strong support level and is showing signs of upward movement, particularly evident on the hourly chart. Dips are being bought up, with the price quickly returning to previous levels.
Downsides: The downtrend is still in place (though it may potentially be broken), and there's a relatively long stop-loss below yesterday’s candle low at 2.98.
📝Trading Plan
Entry: buying gold at the current level
Stop Loss: 2.98
Target: 3.36, 3.62, and 4.20.

XRP at $2.93? They Forgot What’s Coming?XRP isn’t just another coin. With clarity coming from major rulings, its return to previous highs isn’t just possible it’s probable. I like this level. Watching price and fundamentals line up.
I’m not just looking at the chart — I’m looking at the bigger picture.

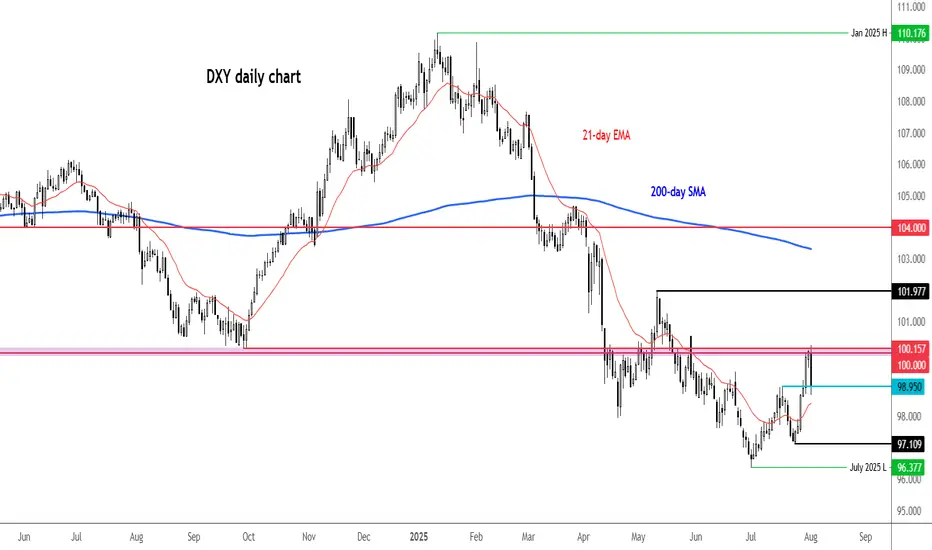
What now for the dollar after a poor NFP report?It is difficult not to link the bad US data to the impact of tariffs. Indeed, it certainly looks that way, especially given that the slowdown in jobs started in early Q2 when reciprocal tariffs were announced. Companies expecting margins to be squeezed by higher duties probably thought twice about hiring workers in order to keep costs down. So, the US labour market has been losing steam fast, undoubtedly due to tariff concerns. Unless the data surprises on the upside soon, the Fed may have no choice but to cut—and cut again. Against this backdrop, the recovery in the dollar is going to a long bumpy road.
We noted the area around 100.00 to be resistance in the previous update, and that level has held, thanks to the weak jobs report (and ISM survey that was released later). The DXY was testing potential support around 98.95 at the time of writing. Will it be able to bounce there? Break that on a closing basis and next week could bring more technical dollar selling.
By Fawad Razaqzada, market analyst with FOREX.com
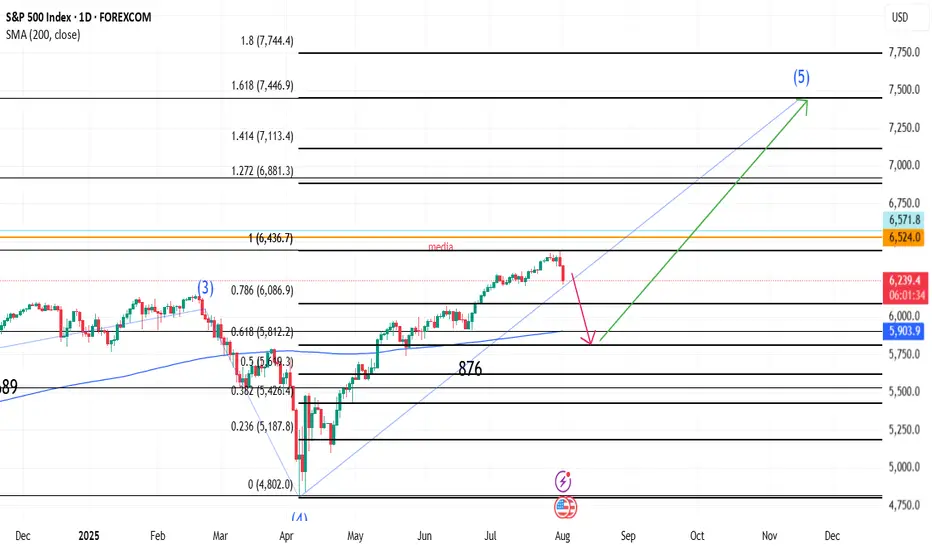
SPX correction to 5800 then 7445In my view current correction could stop in 5800 area where bullish trend could resume to target 7445 area in November
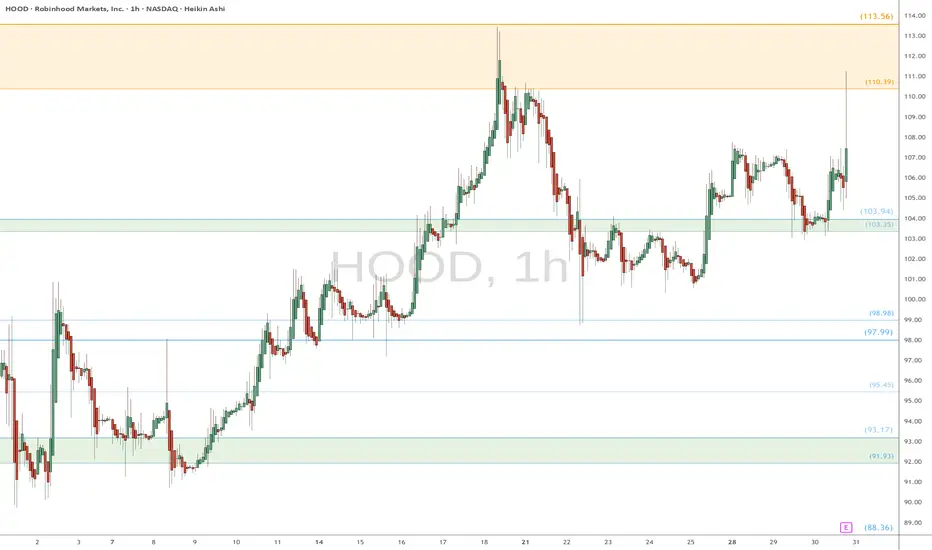
HOOD watch $110 then $113: Dual Golden fibs trying to TOP itHOOD has been a massive bull run since April lows.
Now battling a dual Golden fib zone $110.39-113.56.
Top of the zone is a well proven Golden Genesis fib.
See "Related Publications" for previous charts ------->>>>>>>
Such as this PERFECT catch of a serious bounce:
Hit BOOST and FOLLOW for more such PRECISE and TIMELY charts.
=========================================================
.
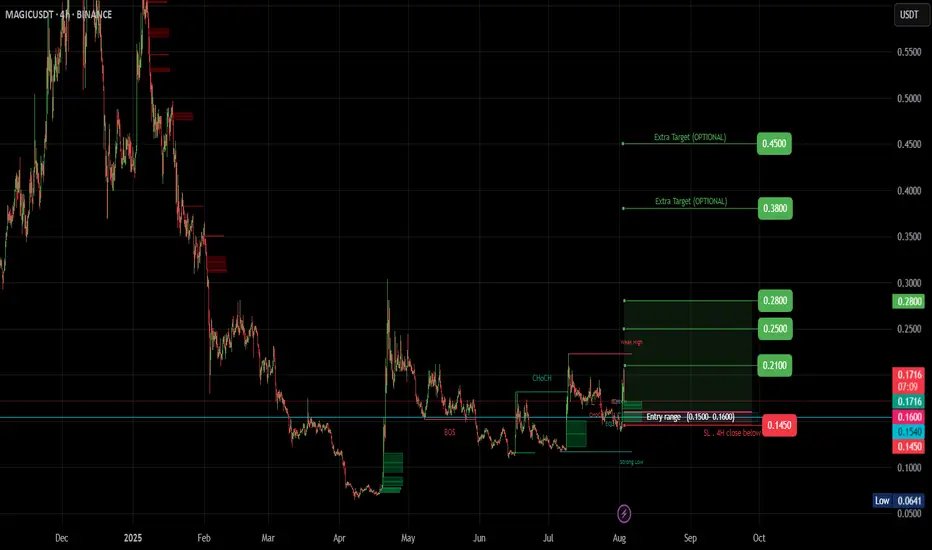
MAGIC (SPOT)BINANCE:MAGICUSDT
#MAGIC / USDT
Entry range (0.150- 0.160) **** Wait for the price to come to the entry range ****
SL 4H close below 0.145
T1 0.210
T2 0.250
T3 0.280
Extra Targets
T1 0.380
T2 0.450
_______________________________________________________
Golden Advices.
********************
* collect the coin slowly in the entry range.
* Please calculate your losses before the entry.
* Do not enter any trade you find it not suitable for you.
* No FOMO - No Rush , it is a long journey.
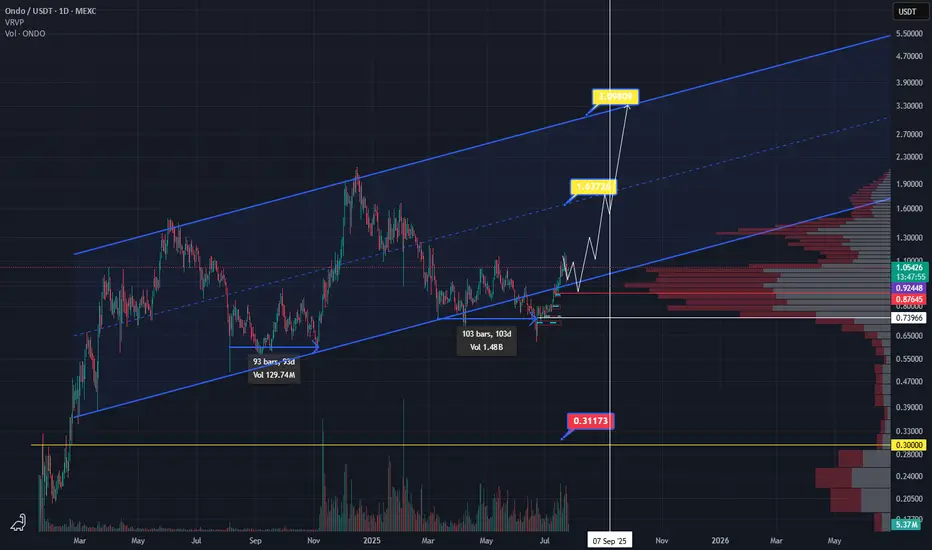
ONDO Bullish structureOndo is back to bullish scenario. We can see long accumulation more then 100 days. As you can see price 0.9 is back and then bullish coming. So 0.85 and 0.9 have to hold and we can buy the dip.
Keep in mind if Ethereum start to attack ATH, Eth ecosystem will grow much higher. So watch this level in next couple weeks and months.
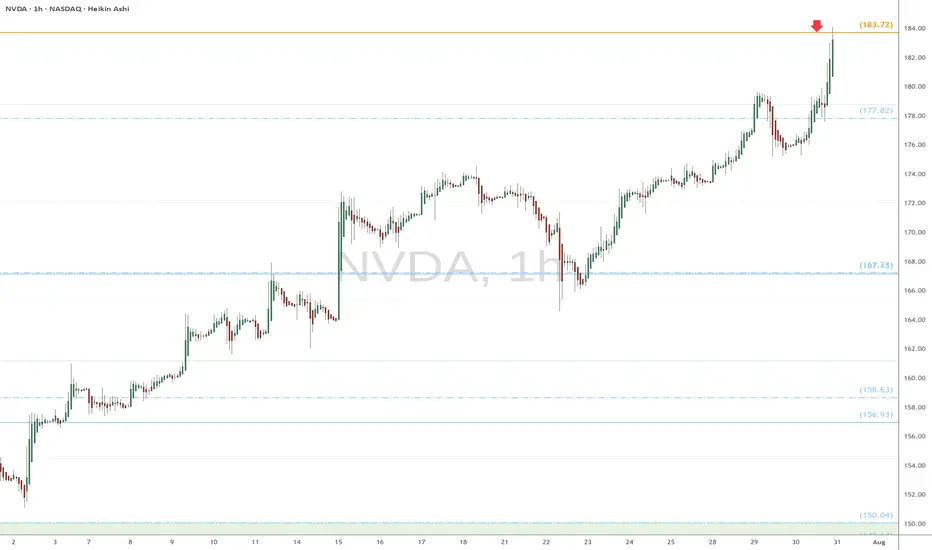
NVDA heads up at $183.72: Golden Genesis fib to mark a TOP?Chips have been flying high since the April lows.
NVDA has just hit a Golden Genesis fib at $183.72
This is a "very high gravity" fib so expect a reaction.
It is PROBABLE that we "orbit" this fib a few times.
It is POSSIBLE that we reject to form a major top.
It is PLAUSIBLE that we Break-n -Retest to continue.\
.
See "Related Publications" for previous EXACT plots ------>>>>>>>>
Such as this post at the last Golden Genesis:
Hit the BOOST and FOLLOW for more such PRECISE and TIMELY charts
============================================================
.
Could this be the end of Bitcoin’s trend?The Current State of Bitcoin’s Trend: Has the Uptrend Come to an End...?
Based on recent analyses, Bitcoin has exited its 4-hour channel over the past few days, and there is still a possibility for further correction. However, this does not mean that the uptrend for Bitcoin is over.
My targets for Bitcoin remain the same as before: 123,700 and 129,710. It’s even possible that we might see a wick above these prices.
For those with more capital who are looking to buy Bitcoin, there are two good entry levels:
110,880
109,770
Everything else is clearly shown on the chart. Please be cautious, as there will likely be high volatility once the market opens.
Be sure to open the analysis link and boost the analysis with your likes.

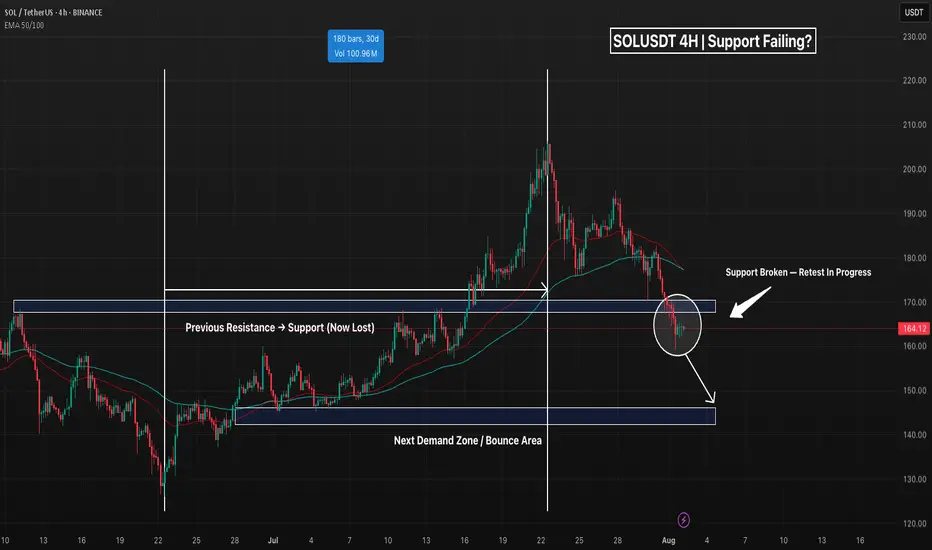
SOL - Support Broke, Is This Just a Retest Before The Pump?Solana just lost a key structural level on the 4H chart — the former range high (~163–166), which had acted as resistance throughout June and flipped to support in mid-July. Price is now sitting just below this zone, forming a weak retest without any real bullish momentum.
This setup often leads to trap scenarios: either a fast reclaim (bullish deviation) or a clean continuation to the next demand. So far, the price is holding below the EMAs and failing to reclaim lost ground — not a bullish look.
📌 Confluence for Further Downside:
Break and close below prior support
EMA 50/100 acting as dynamic resistance
No bullish divergence present (if RSI confirms)
Weak volume on current bounce attempt
If sellers stay in control, eyes are on the next demand zone around 144–146, which supported the last major breakout. Conversely, a clean reclaim above 166 and back inside the range would flip bias neutral-to-bullish.
Bias: Bearish unless 166 is reclaimed
Invalidation: Break above 177–180 (EMA cluster)
Next Key Support: 144–146
Potential Setup: Short on failed retest / Long on demand reaction
Do you see this as a breakdown or a trap? Let me know 👇
ETHUSD The Week Ahead Key Support and Resistance Levels
Resistance Level 1: 3677
Resistance Level 2: 3752
Resistance Level 3: 3833
Support Level 1: 3485
Support Level 2: 3400
Support Level 3: 3316
This communication is for informational purposes only and should not be viewed as any form of recommendation as to a particular course of action or as investment advice. It is not intended as an offer or solicitation for the purchase or sale of any financial instrument or as an official confirmation of any transaction. Opinions, estimates and assumptions expressed herein are made as of the date of this communication and are subject to change without notice. This communication has been prepared based upon information, including market prices, data and other information, believed to be reliable; however, Trade Nation does not warrant its completeness or accuracy. All market prices and market data contained in or attached to this communication are indicative and subject to change without notice.

XRP VS AI ?Hi,
This is fun, come on XRP $4.95
Average Speed (Points/Day) 0.053
Retracement Amount (Points) 0.80
Retracement % 51.28%
Probability of Retracement % 5-10%
Projected Next Move Size (Points) 2.09
Next Projected High Price 4.95
Estimated Duration to Next Target 39.4 days
Projected End Date 2025-09-10
All the best
Not a guru

A comeback trendI think the downward trend will continue.
As you can see on the chart, if there is no news, the trend continues in a channel.
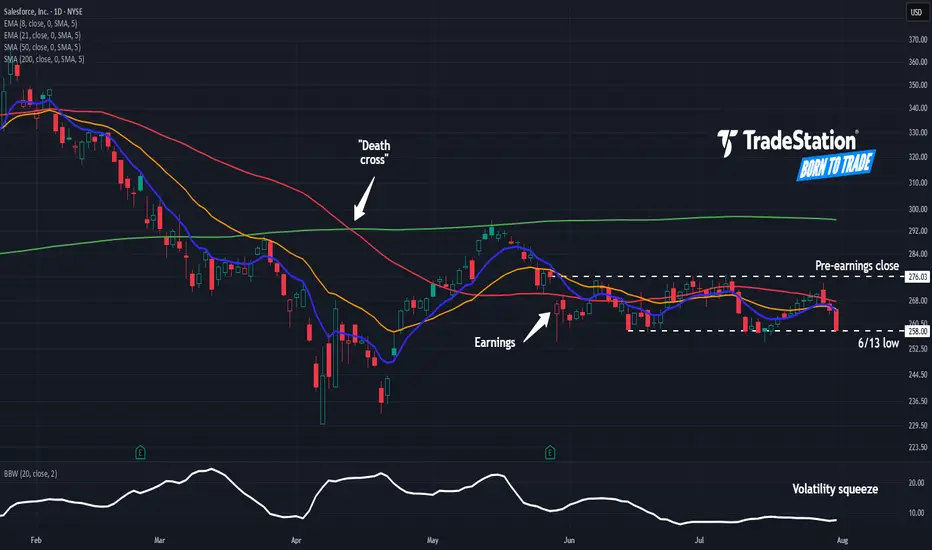
Salesforce May Face DistributionSalesforce has limped as other tech stocks hit new highs, and some traders may think it’s going into distribution.
The first pattern on today’s chart is the bearish price gap on May 29 despite better-than-expected quarterly results. That may reflect waning enthusiasm about the software company’s fundamentals.
Second is the pre-earnings closing price of $276.03. CRM has remained trapped below that level, which may suggest it’s become resistance.
Third is the June 13 low of $258. The stock bounced there in mid-July but may now be at risk of breaking it.
Next, Bollinger Bandwidth has narrowed as the stock formed a tight range between the two levels. Could price movement expand following that period of compression?
Last, the 50-day simple moving average (SMA) had a “death cross” below the 200-day SMA in April. The 8-day exponential moving average (EMA) is also below the 21-day EMA. Those patterns may be consistent with bearishness in the long and short terms.
TradeStation has, for decades, advanced the trading industry, providing access to stocks, options and futures. If you're born to trade, we could be for you. See our Overview for more.
Past performance, whether actual or indicated by historical tests of strategies, is no guarantee of future performance or success. There is a possibility that you may sustain a loss equal to or greater than your entire investment regardless of which asset class you trade (equities, options or futures); therefore, you should not invest or risk money that you cannot afford to lose. Online trading is not suitable for all investors. View the document titled Characteristics and Risks of Standardized Options at www.TradeStation.com . Before trading any asset class, customers must read the relevant risk disclosure statements on www.TradeStation.com . System access and trade placement and execution may be delayed or fail due to market volatility and volume, quote delays, system and software errors, Internet traffic, outages and other factors.
Securities and futures trading is offered to self-directed customers by TradeStation Securities, Inc., a broker-dealer registered with the Securities and Exchange Commission and a futures commission merchant licensed with the Commodity Futures Trading Commission). TradeStation Securities is a member of the Financial Industry Regulatory Authority, the National Futures Association, and a number of exchanges.
TradeStation Securities, Inc. and TradeStation Technologies, Inc. are each wholly owned subsidiaries of TradeStation Group, Inc., both operating, and providing products and services, under the TradeStation brand and trademark. When applying for, or purchasing, accounts, subscriptions, products and services, it is important that you know which company you will be dealing with. Visit www.TradeStation.com for further important information explaining what this means.
ETHUSD - CURRENT OUTLOOK ON ETHEREUMI am currently expecting the dollar to slowly regain strength, and while this is happen, I expect institutions/large funds to begin profit taking from these price ranges.
"May fortune attend thee, and thy trade prosper." .......L2Earned

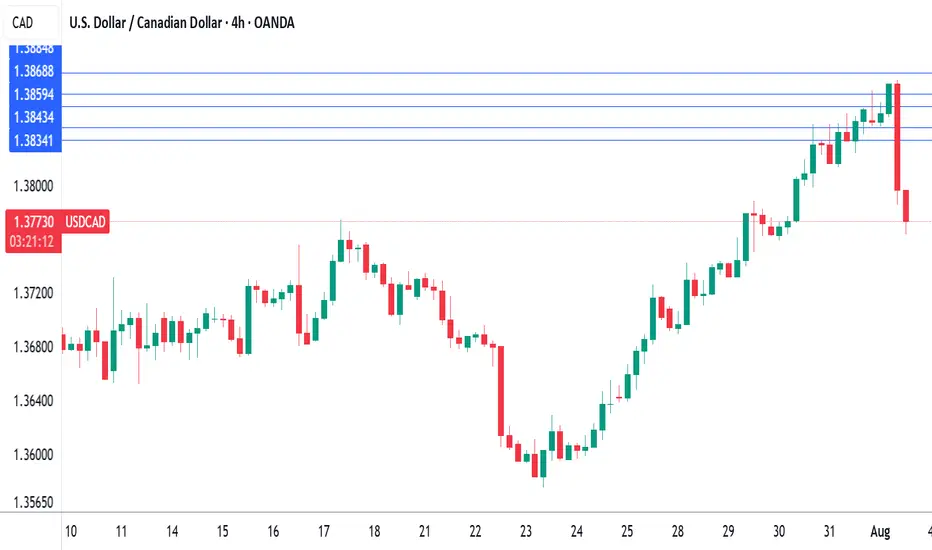
Canada's GDP contracts, US nonfarm payrolls misses forecastThe Canadian dollar continues to lose ground against its US counterpart and is trading at two-month lows. In the European session, the Canadian dollar is trading at 1.3875, down 0.13% on the day. USD/CAD has risen for six straight days, climbing 1.9% during that time.
US nonfarm payrolls for July were softer than expected at 73 thousand, compared to the forecast of 110 thousand. The June report was revised sharply downwards to 14 thousand from an initial 147 thousand.
Canada's GDP posted a small decline of 0.1% m/m in May, matching the market estimate. This followed an identical reading in April, as the economy is essentially treading water. A drop in retail trade was a significant factor in the weak GDP reading, particularly in motor vehicles and parts.
The decline in GDP in April and May can be squarely blamed on the trade war with the US, which has put a chill in economic activity. The markets are expecting a slight improvement in June, with an estimate of a 0.1% gain.
The Bank of Canada held the benchmark rate at 2.75% on Thursday for a third consecutive meeting. The rate statement noted that US trade policy remains "unpredictable" and Governor Macklem reiterated this at his press conference, saying that "some level of uncertainty will continue" until the US and Canada reach a trade agreement.
Meanwhile, the trade war between the two sides is heating up. President Trump announced on Thursday that the US was slapping 35% tariffs on Canadian products, effective Aug. 1. The new tariff will not apply to goods covered under the US-Mexico-Canada Agreement.
Canada's Prime Minister Mark Carney said he was "disappointed" with the US decision and vowed that "Canadians will be our own best customer". These are brave words, but Carney will be under pressure to reach a deal with the US, as 75% of Canadian exports are shipped to the US and Canada can ill-afford a protracted trade war with its giant southern neighbor.
USOIL Is Bearish! Short!
Please, check our technical outlook for USOIL.
Time Frame: 9h
Current Trend: Bearish
Sentiment: Overbought (based on 7-period RSI)
Forecast: Bearish
The market is approaching a significant resistance area 69.178.
Due to the fact that we see a positive bearish reaction from the underlined area, I strongly believe that sellers will manage to push the price all the way down to 66.684 level.
P.S
The term oversold refers to a condition where an asset has traded lower in price and has the potential for a price bounce.
Overbought refers to market scenarios where the instrument is traded considerably higher than its fair value. Overvaluation is caused by market sentiments when there is positive news.
Disclosure: I am part of Trade Nation's Influencer program and receive a monthly fee for using their TradingView charts in my analysis.
Like and subscribe and comment my ideas if you enjoy them!

Brett short to $0.04751Just now opened up a short position on Brett. Aiming for prior weekly demand area.
Sl: $0.04751
Tp: $0.04751
DTT strategy applied
Roughly 2RR

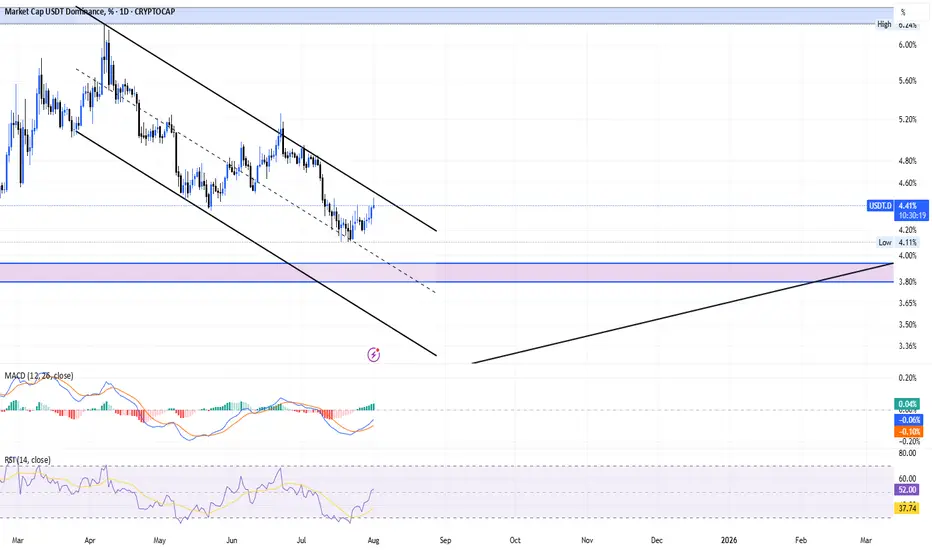
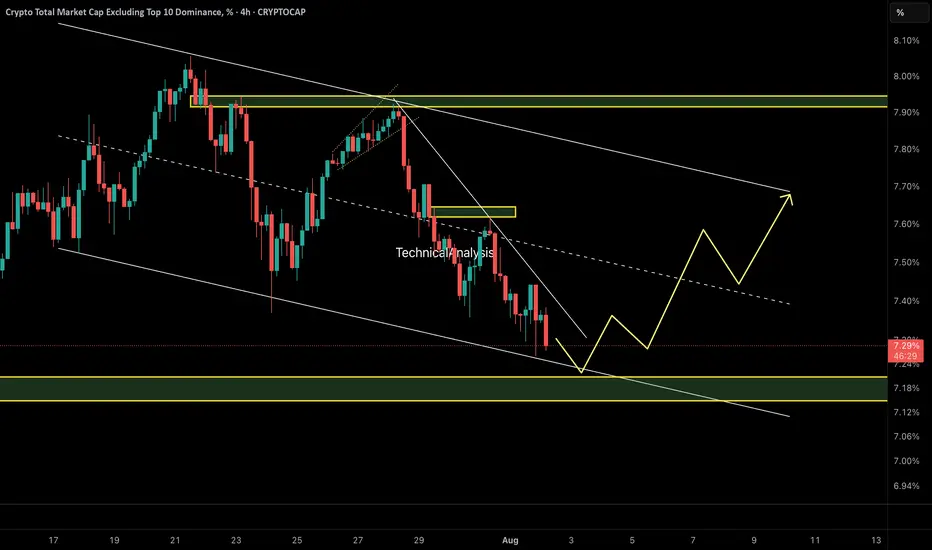
OTHERS.D – Perfect Reaction to Previous AnalysisAs predicted in the last update, OTHERS.D broke structure and dropped sharply toward the 7.20% demand zone — exactly as expected.
Now, we’re waiting for a potential bullish reaction from this key area. If demand holds, a move toward the upper channel boundary (~7.70%) could follow.
🧭 Technical Outlook:
• Price tapped into a key demand zone at 7.20%, which aligns with the lower boundary of a descending channel.
• A bullish reaction is forming, suggesting short-term strength in altcoins.
• A move toward the channel top near 7.70% is now on the table if demand holds.
⚠️ Important Note:
This move is likely to remain a corrective rally unless we see a proper breakout above 7.70% with volume and structure shift. Be selective with altcoin longs.
🔍 Watch for:
• Reaction at 7.50% midline
• Price behavior at 7.70% resistance
• Structure shift or failure pattern near channel top
⚠️ Caution: This remains a corrective rally unless price breaks 7.70% with structure shift.
🔗 Analysis by CryptoPilot
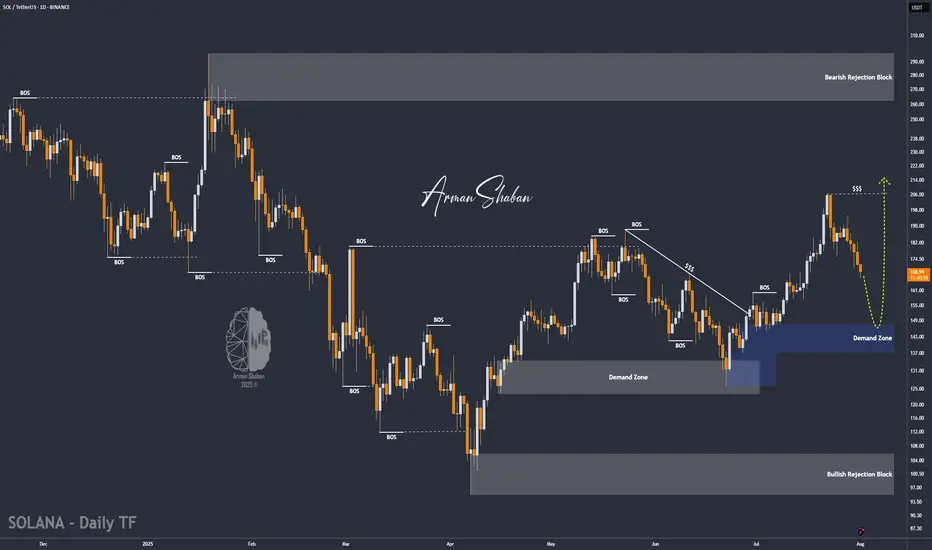
SOL/USDT | NFP Volatility Could Trigger Drop Toward $154!By analyzing the Solana chart on the daily timeframe, we can see that the price is currently trading around $169. If it fails to hold above the $168 level, a deeper drop could follow. With the upcoming NFP data release, increased volatility is expected across the markets. If Solana begins to decline, the potential correction targets are $163, $157, and $154. Watch the $145–$154 zone closely for a possible bullish reaction and buy opportunity.
Please support me with your likes and comments to motivate me to share more analysis with you and share your opinion about the possible trend of this chart with me !
Best Regards , Arman Shaban