$PNUT TO 2.5$ THIS RALLY?🚨 $PNUT breakout from falling wedge confirmed ❗
Target at $0.34 is done for a 70% move off the breakout✅
Now retesting the breakout zone: $0.21–$0.23
Breakout remains intact. Consolidation expected before the next explosive leg. 📈
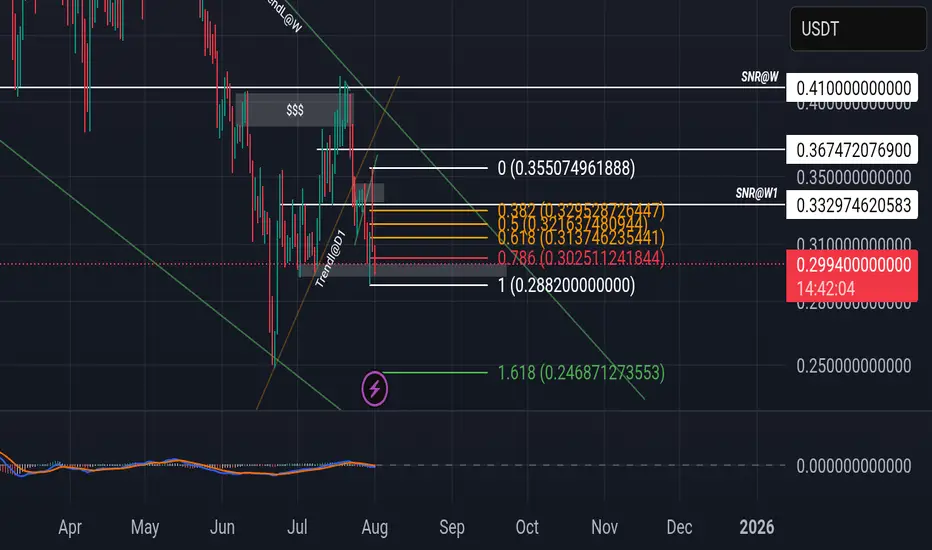
Local breakout above $0.33 → reopens pathway to:
→ $0.50 → $0.68 → $1.00 → $1.33 → $2.00 → $2.50
Trend Analysis

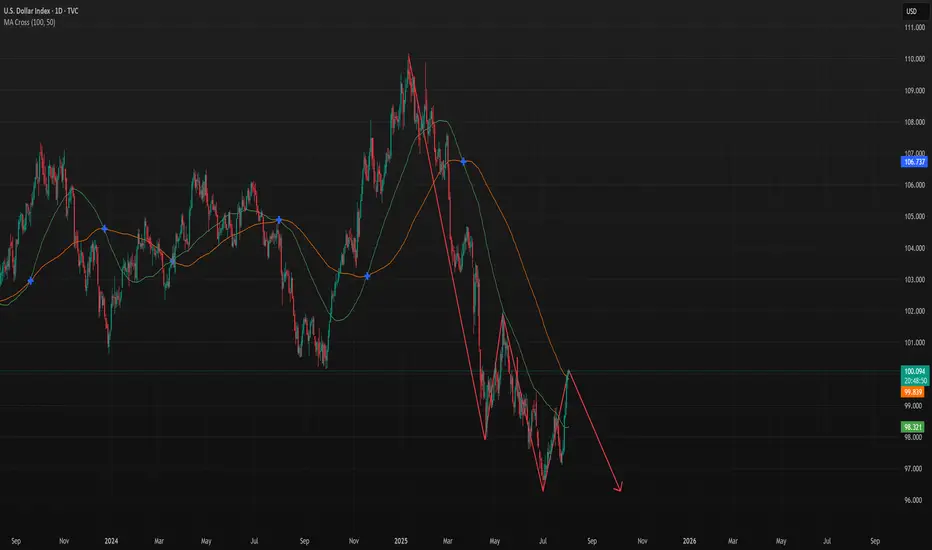
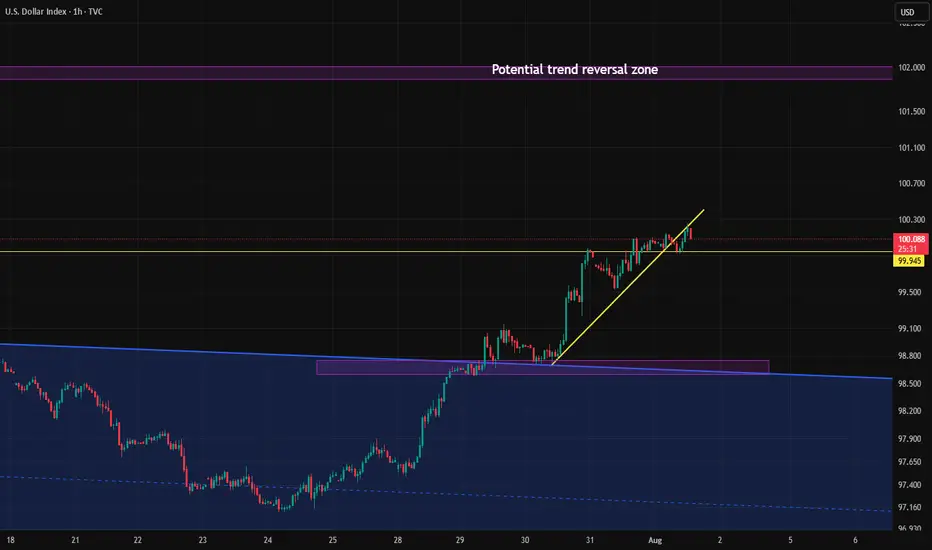
Candle close above 100 after 2 months.If the Dollar Index manages to close above the 100 level today, following the important news release, there's a chance the upward move could continue toward the key 101 zone next week.
However, unless it breaks above the 101 level with strong momentum, the overall trend in the higher timeframes still remains bearish.
**#XAUUSD H5 Higher Timeframe Analysis**
📊 **#XAUUSD H5 Higher Timeframe Analysis**
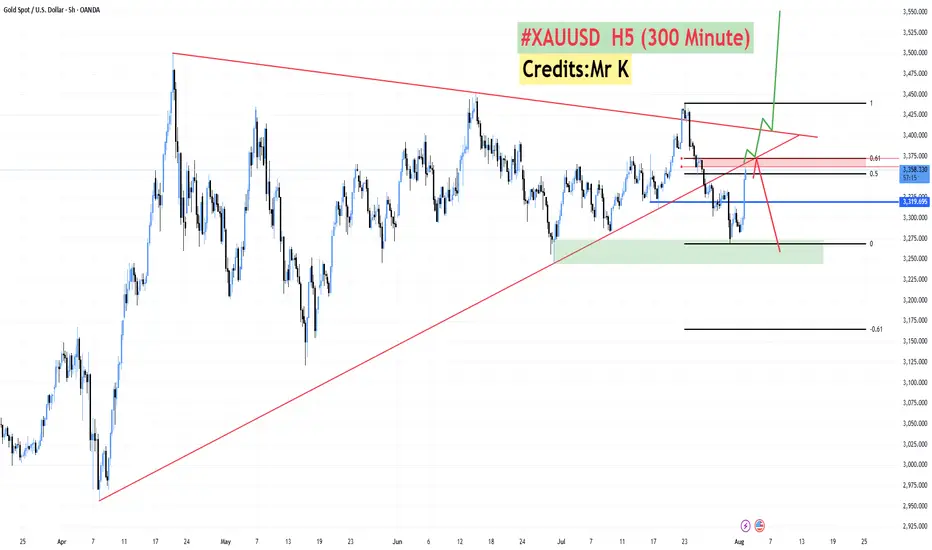
What we witnessed today was a **tremendous recovery in Gold 🟡** after **3–4 consecutive bearish sessions 📉**.
📅 **Today’s candle** has **completely flipped the weekly structure**, turning a fully **bearish weekly candle into a bullish one 📈** — thanks to the **NFP data** that came in **favor of Gold and against the Dollar 💵❌**.
🔍 However, price is now approaching a **critical confluence zone**:
* 🧭 A **long-running trendline** (since April)
* 🔴 An **H4 Bearish Order Block**
* 📐 The **Fibonacci Golden Zone (0.50–0.618)** at **3362–3372**
📌 **From this level, we have two possible scenarios:**
1️⃣ **Sharp Rejection 🔻:**
Price may **reverse sharply** from the 3362–3372 zone and **resume the bearish trend**.
2️⃣ **Breakout & Trap Theory 🔺:**
If price **sustains above this zone**, it may signal that the recent **3–4 day drop was a fake breakdown**, designed to **trap sellers** and grab liquidity for a **further upside move**.
✅ **Confirmation will come if we get an H4–H6 bullish candle close above the trendline** and back inside the **buying zone of 3375–3390**.
🔓 **A breakout above the triangle pattern** will likely lead to a **strong bullish continuation 📈🚀**.
Bitcoin Could Accept bearish TrendBitcoin is currently testing a key resistance zone between 120,000 and 121,000. While price action is attempting to break higher, market conditions suggest the possibility of a false breakout rather than a sustained bullish continuation.
BTC has approached a significant resistance band, and early signs of exhaustion are visible. Unless the price decisively holds above 121,000, any breakout may lack conviction. Given the broader unresolved downtrend, a corrective move remains likely.
If the breakout fails to sustain, we anticipate a pullback toward the 117,000 to 115,000 range. This would align with a retest of previous support zones and continuation of the short-term bearish structure.
Ps: Support with like and comments for better analysis Thanks.

SEI | Full AnalysisHere is the top-down analysis for Sei as requested 🫡
Weekly Timeframe:
We have a potential large structure forming on the weekly chart that will be activated once we break the ATH. Its target zone lies between $1.8 and $2.2.
My sell targets for SEI this cycle are:
TP1: $0.73
TP2: $1.14
TP3: $1.83
These are my sell targets based on my technical analysis. However, I won’t rely on them alone — I also follow several on-chain indicators. Once retail euphoria kicks in and my indicators trigger, I’ll start selling accordingly.
Daily chart:
On the daily, we have a sequence that has already been activated and almost reached its target zone. That’s why the B–C correction level remains a valid buy zone, which I’ll also use for additional long entries.
This would be the second attempt from a B–C correction level, as we’ve already tapped it once (where I went long) and I’ll be entering again here.
Target zone for this sequence: $0.39–$0.44
Local Price action:
On the lower timeframe, we’ve just completed a bearish structure that perfectly overlaps with the B–C correction level. This increases the probability of this setup significantly, as both sides (bulls and bears) want the same thing here: bulls are buying the market, while bears are covering shorts and taking profits.
-----
Thats the my full Analysis for SEI, hope it was helpful if you want me to do another analysis for any other pair just comment down below.
Also, if anyone is interested in how my trading system works, let me know and I’ll post some educational content about it.
Thanks for reading❤️

SPY: I think dollar milkshake is brewing, buying for long term📉 SPY Daily Breakdown – Aug 1, 2025 | VolanX Observations
🧠 Bot failed today, but the market taught more than any trade could have. Sitting out gave me the clarity to reassess structure and edge.
🔍 Market Structure Update:
Gap Down from Premium Zone: Today’s price action rejected the weak high and created a clean daily gap — signaling potential distribution at the top.
ORB (15-min) marked and ready: Likely to be retested on Monday. If price rallies into this zone and rejects, that’s where I’ll look for short entries.
Friday Bearish Close Rule: Statistically, when Friday closes red with strong momentum, Monday tends to follow — especially after a gap-down open.
🧭 Big Picture Outlook:
Liquidity Zones Below:
600 → First institutional reaction zone.
580 → Deeper demand and equilibrium area from previous consolidation.
Dollar Milkshake Brewing: Strong USD thesis could pressure equities short-term. This aligns with potential flow into defensives and out of high beta.
Long-Term Bias: Watching for deep discounts. If price moves into high-value demand zones, I’ll accumulate for the long haul — buying fear when it's priced in.
📌 What I’m Watching Next Week:
Monday open – will we see Gap & Go or a Gap Fill + Fade?
Reaction to ORB zone.
Volatility behavior and volume footprint in the first 90 minutes.
🔻 No trades today due to a bot error, but ironically, that gave me better vision. Sometimes, the best trades are the ones you don’t take.
VolanX Protocol engaged. Standing by.

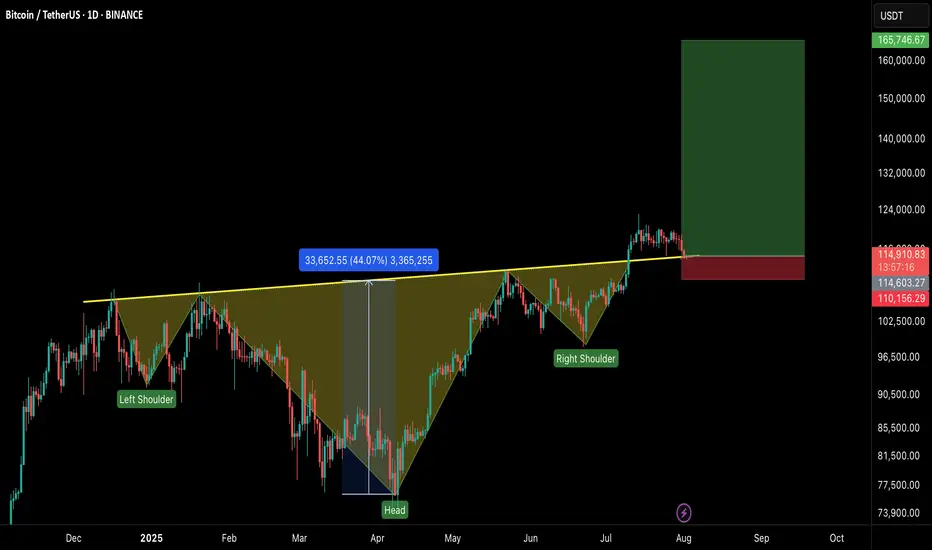
#BTCUSDT – Healthy Correction, Not the End!Bitcoin is currently experiencing a healthy pullback after an impressive run, testing the neckline of the Inverse Head & Shoulders breakout on the 1D timeframe.
🔹 Current Market View:
BTC is retesting the neckline of the IHS pattern, which now acts as a strong support zone.
Price is holding near $113K–$115K, which is crucial for maintaining bullish momentum.
This dip is a healthy correction, flushing out over-leveraged positions and preparing for the next leg up.
🔹 Key Levels:
Support Zone: $113,000 – $115,000
Immediate Resistance: $120,000 – $122,500
Breakout Target: $165,000+ on the next bullish wave
🔹 Market Sentiment:
Holding above the neckline keeps the bullish structure intact.
If the support holds, we can expect continuation to new highs once buying pressure returns.
A daily close below $112K would signal caution and delay the next rally.
💡 Tip: Don’t panic on these red candles. Healthy corrections are part of a sustainable uptrend.
Gold non-farm payrolls are bullish, long and short positions ana
Rather than envying the fish by the river, it's better to retreat and weave your net. We often envy the wealth others can earn by investing in the gold market. We often watch them enthusiastically investing, but we ourselves are afraid to enter the market. The two major factors that drive the market, technology and news, are a topic of constant debate among investors. To navigate the market, one must master the art of attack and defense to remain rock-solid while remaining at the forefront. As the saying goes, trust me, and I will reward you with profits!
Gold Data is Bullish!
The positive non-farm payroll data sent gold soaring, with gains completely erasing all of the week's losses. Currently, gold's trend has reversed the stagnant bullish and bearish trend. After breaking through the 3300 mark and rising all the way to 3348, it shows no signs of stopping. A further test of the 3370 level is not out of the question!
Due to the strong bullish data, if you don't immediately chase longs or place a breakout long order during the first wave, you'll likely have little chance of a pullback. Therefore, you should remain aggressive in your trading strategies. We recommend a pullback to the 3332-30 level to continue the bullish trend. Upward pressure is expected at 3372-75! The market fluctuates violently, and more real-time entry and exit points are mainly based on Yulia's real-time guidance!

Sonic is creating wedge pattern in higher timeframeOn our current market structure, sonic is creating wedge bullish pattern.
If you check the current price using Fibonacci there's a possibility that it will goes to 0.24 or worst 0.1552 before it will break its current weekly structure.
You can accumulate within the pattern but if you're planning to make position and do long...please avoid that.
Point of interest is 0.24 to make create double bottom on it. If it's break, 0.1552.
Smart Money Knows: ETH Is Gearing for a Supercycle...Hello Traders 🐺
In this idea, I wanna break down why $15K ETH isn't just a fantasy — it's a real, reachable target. So stay with me 'til the end, because this is just the beginning for Ethereum and the altcoin market.
If you’ve been following my ideas over the past year, you know I’ve been loudly calling for an incoming altseason — especially since ETH hit $1700. I kept saying: “Load up on ETH while you can,” because smart money was clearly rotating into it.
And now? We’re seeing the result.
Since then, Ethereum has nearly 2x’d, and ETH ETFs are pulling in massive inflows — but the price hasn’t exploded yet. Why? Let’s look closer.
Over the past 90 days, ETH has rallied around +180%, but in a quiet, steady climb — which is actually bullish. A strong move with low hype = accumulation. That’s how smart money moves.
📊 Monthly Chart Breakdown:
ETH is moving inside a perfect ascending channel, with clean touches on both support and resistance. Right now, price is forming a bullish flag pattern at the upper range — a classic continuation structure.
Volume has dropped during this flag, which is a textbook sign of accumulation. Add to that: RSI is sloping downward, signaling that large players are shaking out weak hands while loading up quietly.
So yes — ETH has already done +180% during this consolidation phase, which tells us something big is brewing.
🔁 The current pullback on the daily? In my opinion, it’s just a technical reaction to the flag resistance. RSI is also trying to break above its own trendline. If both confirm, the next wave begins.
🎯 Targets?
First target: All-Time High around $4870.
After that? There's nothing but air until we hit the top of the monthly channel near $15,000.
That breakout above ATH is where the real FOMO begins — not just for ETH, but for the entire altcoin market.
Let’s not miss what’s coming.
And as always, remember our golden rule:
🐺 Discipline is rarely enjoyable, but almost always profitable. 🐺
🐺 KIU_COIN 🐺

USDCHF TRADE IDEA We also had a pullback to our Fibonacci level from usdchf and we're going to the downside. Let's see how the market does it's thing

AAPL: Symmetrical Triangle Breakdown with S-2 in FocusAAPL has now broken below a well-defined symmetrical triangle structure, as well as the ~$208 S-1 support area I’ve highlighted.
I’m watching the $194.91 zone (S-2), which served as a key support and pivot earlier this year. If price heads into that area, I’ll be looking for confirmation and stabilization before initiating a position.
If the setup aligns, I plan to trade it via Sep/Oct put sales around the $170/$175 strikes -- targeting levels I’d be comfortable owning if assigned, and collecting premium if not.
Not stepping in early here… just tracking structure, respecting price action, and planning around risk-defined entries. We’ll see how this one plays out. Stay tuned.

META: Testing Alternative Interconnection TypeResearch Notes
Given expression like this:
Fractal Corridors can be used for horizontal perspective of the same pattern manifestation. Alternative frames of reference exposes how historic swings of various magnitude in some way wire the following price dynamics. www.tradingview.com helps to seek a matching commonality in angles of trends which gives a hint how structure evolves in multi-scale perspective.
I use both when it comes to working with complex waves and making interconnections through fibonacci ratios.
To define emerging wave's limits (probable amplitude), I'll test classic rule of Support/Resistance shift in fibs. (When resistance becomes support or vice versa)
By theory it means a trendline can also shift like that.
In our case this can be applied as:
Fibocnacci Structure:

The Low Is In: Why the S&P 500 Just Confirmed a Bullish Reversal🔥 The Low Is In: Why the S&P 500 Just Confirmed a Major Bullish Reversal 🔥
The market just gave us a gift.
After weeks of drifting lower and sentiment turning cautious, the S&P 500 has touched — and bounced — off a critical rising trendline for the third time since May 2025. That third touch isn't just a technical coincidence… it's often the launchpad for a new impulsive leg higher.
📈 The Power of the 3rd Touch: Trendline Validation Complete
Look at the chart. This isn’t guesswork. Since May, the S&P 500 has been respecting a well-defined ascending trendline, one that connects multiple higher lows during this bull run.
The first touch was the May liftoff after the April consolidation.
The second came in June — a clean retest and bounce.
Now, as of early August, the third touch has held once again, exactly where the bulls needed it most.
This isn’t a random line on a chart. This is institutional flow stepping in to defend structure.
And when a rising trendline holds for a third time after a strong uptrend? That’s a classic continuation signal.
📉 RSI Washout + Structural Support = Perfect Storm for a Bottom
The RSI printed a dramatic dip to ~32, a level that screams “oversold” on the 4-hour timeframe. But notice the context — it happened right at structural support.
This is not weakness. This is accumulation.
Big players shake out weak hands on low timeframes… right before they send it.
🧠 Sentiment Is Offside… Again
Let’s not forget: this retrace came after a huge run-up since March. People expected a deeper correction. Bears started getting loud again.
That’s how bull markets trap you — by convincing you it’s over right before the next leg higher.
And with macro tailwinds (liquidity expansion, fiscal spend, tariff rollbacks), earnings season beats, and global capital rotation into U.S. equities, this setup is ripe for a violent upside squeeze.
🚀 8,700 in Sight: My End-of-Year Price Target Is Very Much in Play
Today’s close around 6,220 means the S&P 500 would need to rally ~40% to hit my target of 8,700 by year-end.
Sounds crazy? Not if you’ve seen what happens during parabolic melt-ups.
This isn’t just hope:
📊 Strong breadth under the surface
🏛️ Dovish policy pivot now expected in Q4
💸 Retail and institutional capital both re-engaging
📉 Bond yields are starting to roll over, supporting equity valuations
When bull markets enter their euphoria phase, they don’t stop at “reasonable” targets. They blast through them.
💡 The Setup Is Textbook — Now It’s About Execution
✅ Trendline defended
✅ RSI reset
✅ Sentiment shaken out
✅ Structure intact
The technicals just aligned with the macro. The low is in — and the runway to 8,700 is wide open.
Strap in. Q4 could be one for the history books.

USD/MXN Bounces Back Ahead of August 2024 LowUSD/MXN appears to be bouncing back ahead of the August 2024 low (18.4291) as it extends the advance from the July low (18.5116), with the exchange rate trading above the 50-Day SMA (18.8993) for the first time since April.
USD/MXN trades to a fresh weekly high (18.9810) following the failed attempt to push below the 18.5090 (23.6% Fibonacci retracement) to 18.6330 (50% Fibonacci retracement) zone, with a move above 19.3720 (38.2% Fibonacci retracement) bringing the June high (19.4441) on the radar.
A move/close above 19.6280 (23.6% Fibonacci extension) opens up the May high (19.7820), but lack of momentum to hold above 18.7780 (50% Fibonacci retracement) may push USD/MXN back toward the July low (18.5116).
--- Written by David Song, Senior Strategist at FOREX.com

LINK/USDT: A+ Long Setup at Key Support with Daily OversoldHello traders,
I am monitoring a high-probability long setup on LINK/USDT on the 4H timeframe. The chart is presenting a classic reversal scenario where multiple technical factors are aligning perfectly, suggesting the recent corrective move may be over.
1. Trend & Context (The "Why")
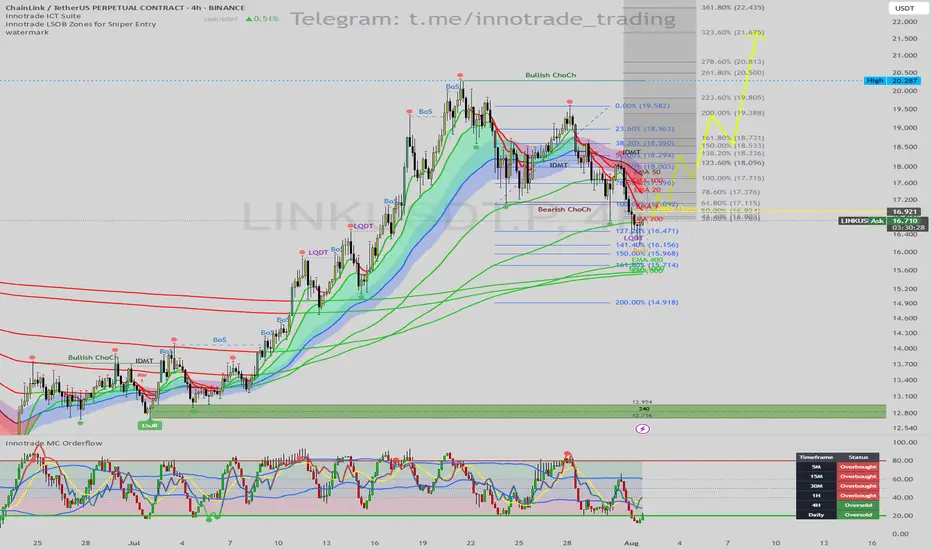
After a strong uptrend, LINK experienced a necessary pullback, confirmed by a Bearish Change of Character (ChoCh). The price has now reached a critical zone where we can anticipate a bullish resumption.
Here are the key confluences for this setup:
Major Dynamic Support: The price is finding strong support directly on the EMA 200, a significant long-term moving average that often marks the end of a correction in a larger uptrend.
Price Action Signal (Liquidity Sweep): The most recent candle performed a perfect Liquidity Sweep (LQDT), wicking below the prior low to take out stop losses before quickly reclaiming the level. This is a classic institutional pattern that often precedes a strong move up.
Momentum Confirmation (MC Orderflow): The momentum oscillator provides the final, high-conviction confirmation:
The MC Orderflow is deep in the OVERSOLD territory, indicating that selling pressure is completely exhausted.
CRITICAL MTF CONFLUENCE : The Multi-Timeframe Cycle Table is showing that both the 4H and Daily timeframes are "Oversold". This HTF alignment is extremely powerful and significantly validates the strength of the reversal signal from this support level.
2. Entry, Stop Loss, and Targets (The "How")
The confluence of these signals provides a clear trade plan with an excellent risk-to-reward profile.
Entry: An entry around the current price ($16.70 - $16.90) is optimal, directly at the EMA 200 support.
Stop Loss (SL): $16.25. This places the stop loss safely below the low of the liquidity sweep wick, providing a clear invalidation point for the trade.
Take Profit (TP) Targets:
TP1: $18.20 (Targeting the cluster of short-term EMAs and the recent consolidation zone).
TP2: $19.50 (The next major swing high resistance).
TP3: $20.28 (The major high of the range, a full trend-reversal target).
Conclusion
This trade presents a textbook "A+" setup. The synergy between a key price action pattern (liquidity sweep) at a major technical level (EMA 200), combined with validated momentum exhaustion on both the 4H and Daily timeframes, creates a very high-probability environment for a significant bullish move.
Disclaimer: This is not financial advice. This analysis is for educational purposes only. Always conduct your own research and manage your risk appropriately.
USDJPY: Breaking Out With Macro Backing 🟢 USDJPY | Breakout Opportunity Above Resistance
Timeframe: 1H
Bias: Bullish
Type: Break and Retest
📊 Technical Setup
USDJPY is currently consolidating at a key 4H resistance zone (147.75–147.90). A clean breakout and retest of this area will confirm bullish continuation.
• Entry: Above 147.90 (after confirmed candle close + retest)
• SL: Below 147.30
• TP: 148.90 / 149.60
• RR: ~1:2.5
• Indicators: RSI showing strong upside momentum, holding above 50
🧠 Fundamentals + Macro Confluence
• USD Strength: Strong macro & delayed rate cuts support USD upside
• JPY Weakness: BOJ remains dovish; risk-on sentiment weighing on JPY
• COT + Conditional Score: USD score increased to 17, JPY dropped to 8
• Risk Sentiment: VIX at 14.2 = RISK ON → bearish JPY bias
🧭 Gameplan
“Wait for confirmation above resistance before entering”
🔔 Set alerts around 147.90 and monitor lower timeframes for retest and bullish candle structure.

GBPCHF TRADE IDEA We were in on a continuation trade to the downside on GBPCHF.
Price moved back to our Fibonacci level and pulled back down south.

New targets for Reddit RDDT In this video I recap the previous reddit analysis where we looked for the long which is playing out really well .
I also look at the current price action and simulate what I think could be a target for the stock moving forward using Fib expansion tools as well as levels below for price to draw back too.
Welcome any questions below the chart . Thanks for viewing

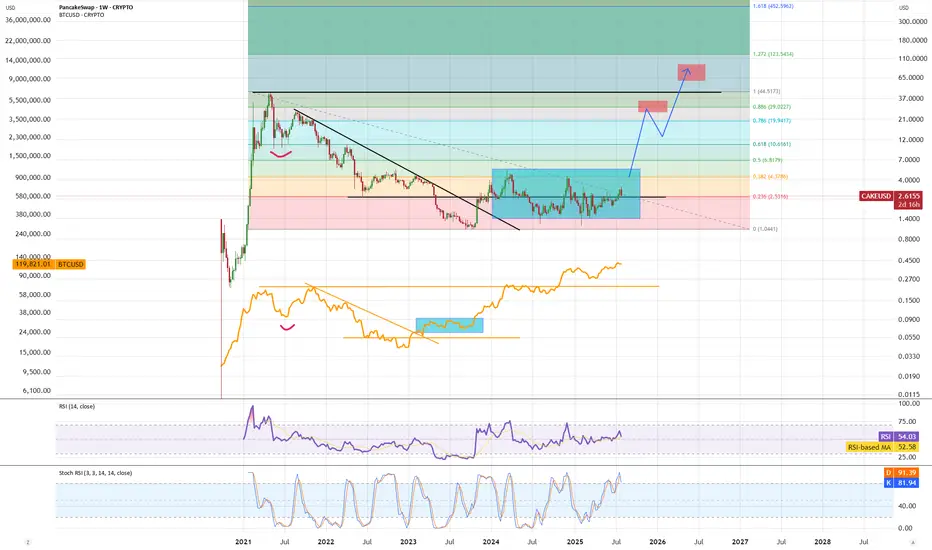
CAKE - positive signs for move upCAKE is still in accumulation range. When looking at pattern we see similarities with BTC where CAKE has completed 1st impulse from the bottom and as long as we stay above fibb 0.236 S range we are ready for next impulse moving price higher, going for test of fibb 0.886 range where a bit of consolidation and then wick to new ATH to complete bigger impulse up.
LTCUSD Possible Scenario breakout of trendline resistanceLTCUSD is at major support and has now broken the resistance and price will likely will move up.

XRP/USDT: Bullish Reversal Setup at EMA 200 & Daily OversoldHello traders,
I'm seeing a compelling long setup forming on the XRP/USDT 4H chart. While the immediate trend has been bearish, multiple key indicators are now signaling that a significant bounce or reversal is highly probable.
1. Trend & Context (The "Why")
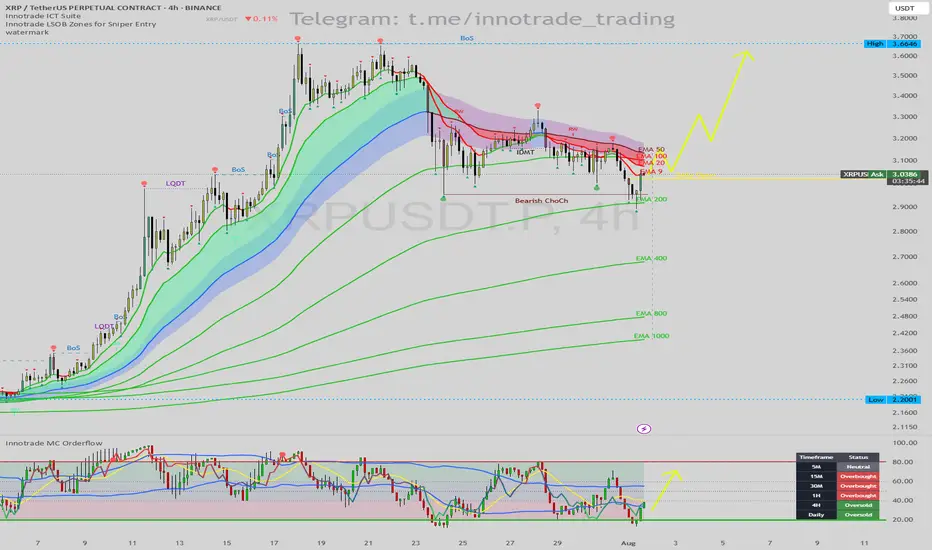
After a strong uptrend, the price has experienced a pullback, confirmed by a Bearish Change of Character (ChoCh). However, the price has now reached a critical support level where we can look for long opportunities.
Key Price Action Support: The price is currently finding support directly on the EMA 200. This is a major long-term moving average that frequently acts as a strong floor for price during a pullback.
Momentum Exhaustion Signal: The Innotrade MC Orderflow oscillator is giving a powerful confirmation for a potential bottom:
The oscillator is deep in the OVERSOLD zone (below 20), indicating that selling pressure is exhausted.
CRITICAL MTF CONFLUENCE: The Multi-Timeframe Cycle Table is the key to this trade. It shows that both the 4H and Daily timeframes are "Oversold". When higher timeframes like the Daily show exhaustion, it significantly increases the probability of a strong reversal on lower timeframes.
2. Entry, Stop Loss, and Targets (The "How")
This setup provides a clear, high-probability trade plan with a good risk-to-reward ratio.
Entry: An entry around the current price ($3.03 - $3.05) is viable as we are at the EMA 200 support. For a more conservative entry, wait for the MC Orderflow oscillator to cross back above its yellow MA.
Stop Loss (SL): $2.89. This places the stop loss safely below the recent swing low and the EMA 200. A break below this level would invalidate the bullish thesis.
Take Profit (TP) Targets:
TP1: $3.25 (Targeting the cluster of short-term EMAs and the recent swing highs).
TP2: $3.40 (The next logical area of resistance from the previous price structure).
TP3: $3.66 (The major swing high, a longer-term target if the bullish trend resumes).
Conclusion
This trade idea presents a strong case for a long position. The combination of a major technical support level (EMA 200) with a confirmed multi-timeframe momentum exhaustion signal (Daily Oversold) creates a high-probability environment for a bullish reversal.
Disclaimer: This is not financial advice. This analysis is for educational purposes only. Always conduct your own research and manage your risk appropriately.
DXY - Possible Down Swing to continue furtherTVC:DXY
CMCMARKETS:USDCAD
OANDA:NZDUSD
CMCMARKETS:EURUSD
We may have a further down swing pattern forming let's continue to see if it passes the resistance area.