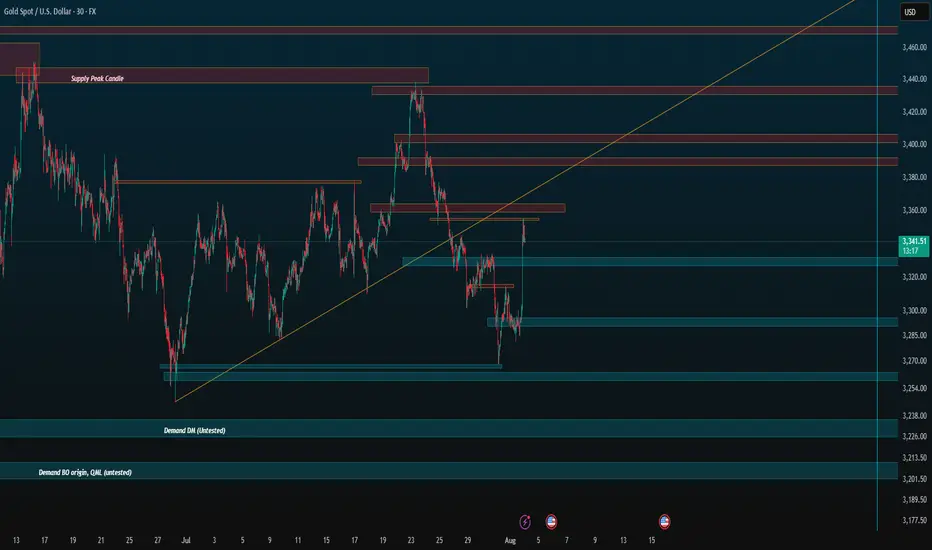
Zones for the rest of August (if no ATH)Just simple zones, ignore. I want to compare to the end of the month later.
Keep trading simple. These are the zones I made after drawing from 4H all the way to 5 minute candle for precision. I already have my own speculation but feel free to use it for your own.
Goodbye, trade safe.
Trend Analysis
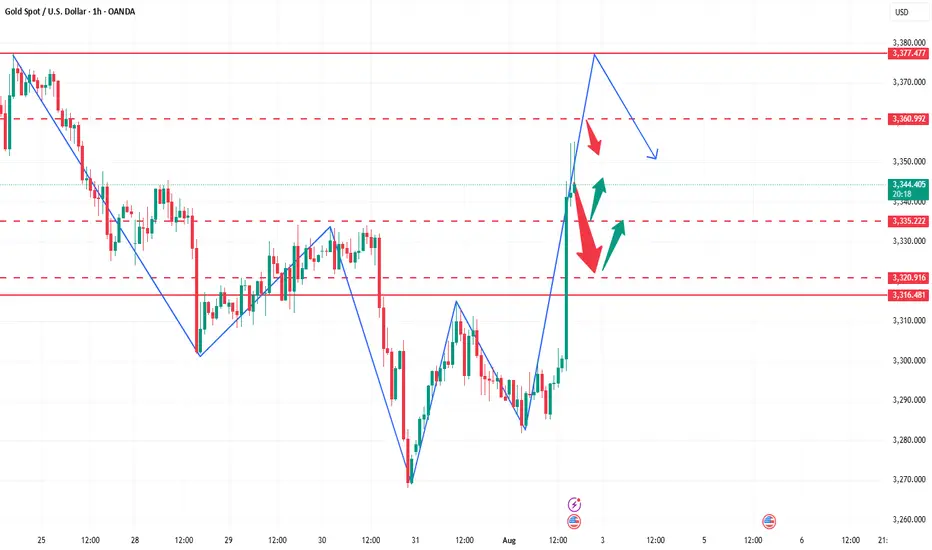
How to accurately grasp the gold trading opportunitiesGold was greatly affected by the positive non-farm payroll data, and it rose strongly, with the increase completely covering all the losses this week. The current gold trend has completely reversed the previous bull-short balance. After breaking through the 3300 level and rising to around 3355, it maintains strong upward momentum, and the possibility of further testing the 3360-3375 area cannot be ruled out. Due to the strong positive data, if everyone fails to chase the long position or set a breakout long position in time in the first wave of the market, the subsequent pullback opportunities may be relatively limited, so it is necessary to maintain an active strategy in operation. It is recommended to continue to be bullish when it retreats to the 3335-3320 area, and the upper target is the 3360-3375 pressure range.
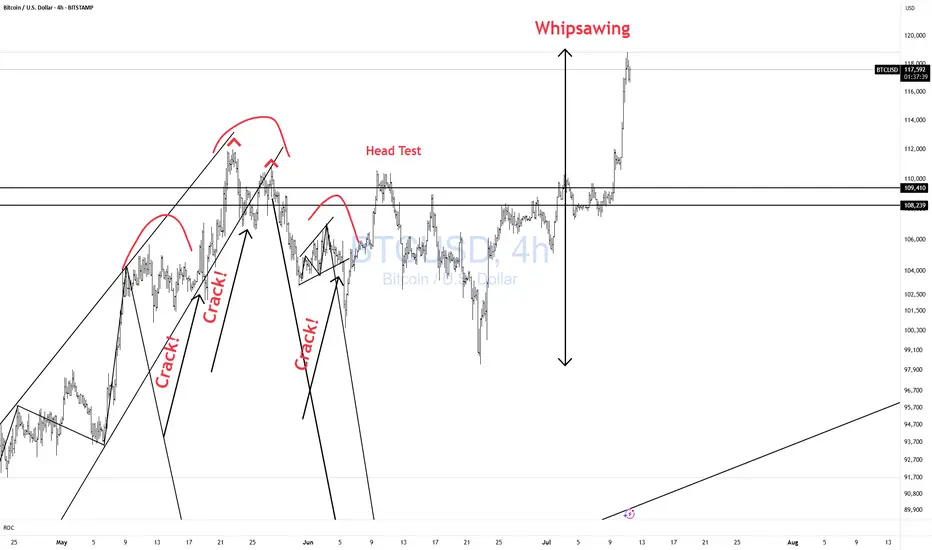
BTCUSD Whipsawing! CAUTION!Bulls CAUTION! Price is whipsawing all over the place.
Better to be out of the market wishing you were in than in wishing you were out!! Don't chase!!
NATF – SECOND STRIKE | 01 AUGUST 2025 NATF – SECOND STRIKE | 01 AUGUST 2025
The stock is standing in an upward channel (marked light blue) and recently hit a high of Rs. 383. A healthy pullback followed, consolidating near the axis line, and briefly dipped below it as a spring. Today’s strong rebound confirms the pullback is likely over, signaling a second strike opportunity for continuation towards higher quantified targets.

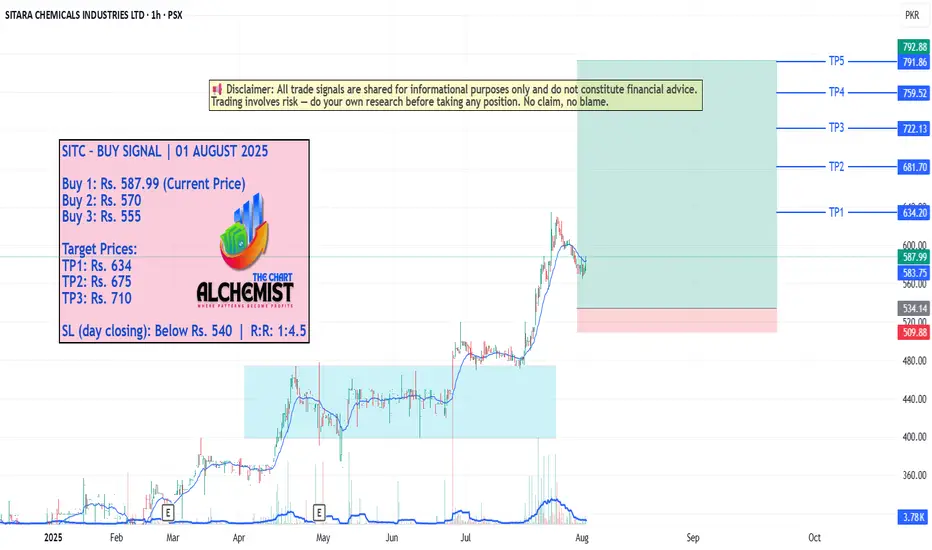
SITC – BUY SIGNAL | 01 AUGUST 2025 SITC – BUY SIGNAL | 01 AUGUST 2025
The stock previously broke out of a trading range (marked light blue channel) and marked a high of Rs. 634. After a shallow pullback to Rs. 478, it spiked upwards again, creating multiple bullish structures. Recently, it rebounded from a key bullish structure and is now entering a new upward leg with good momentum. Quantified displacement targets lie ahead.
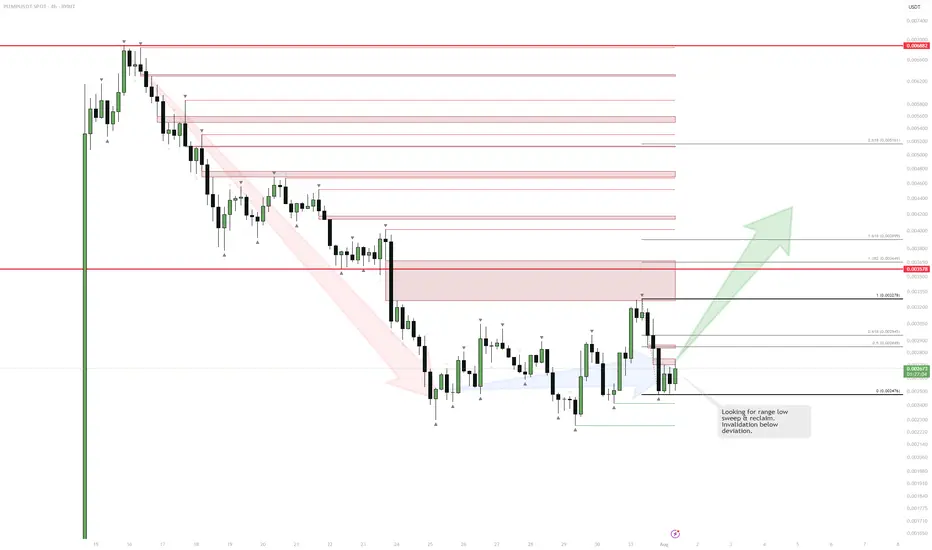
PUMP | Watching for Base ConfirmationThe sharp downtrend is showing signs of exhaustion as price starts to consolidate and build a potential range.
If we see a sweep and reclaim of the range low, that would confirm the start of a new accumulation phase and signal a potential reversal.
The invalidation for any long attempt is a confirmed breakdown below the deviation or the origin of the reclaim.
Plan:
Wait for a clean sweep and reclaim of the range low to trigger a long entry.
Target resistance levels above, with stops set below the reclaim origin.
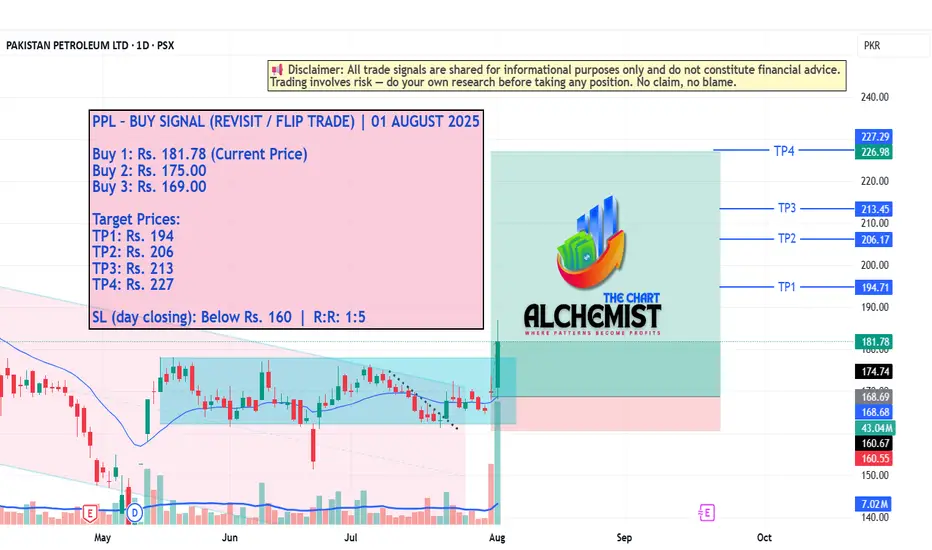
PPL – BUY SIGNAL (REVISIT / FLIP TRADE) | 01 AUGUST 2025 PPL – BUY SIGNAL (REVISIT / FLIP TRADE) | 01 AUGUST 2025
The stock has recently been moving within a bearish channel (marked light pink), which structurally qualifies as a bull flag. A decisive breakout from this flag has now occurred, followed by the formation of a strong bullish structure. This confirms upward momentum and provides solid structural support for a sustained rally.
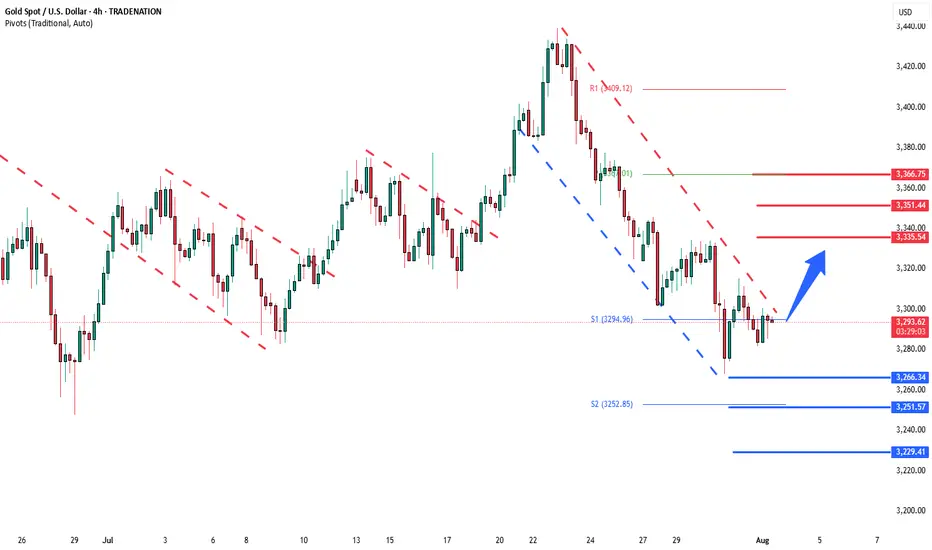
Gold deeper consolidation supported at 3266The Gold remains in a bullish trend, with recent price action showing signs of a continuation breakout within the broader uptrend.
Support Zone: 3266 – a key level from previous consolidation. Price is currently testing or approaching this level.
A bullish rebound from 3266 would confirm ongoing upside momentum, with potential targets at:
3335 – initial resistance
3351 – psychological and structural level
3366 – extended resistance on the longer-term chart
Bearish Scenario:
A confirmed break and daily close below 3308 would weaken the bullish outlook and suggest deeper downside risk toward:
3250 – minor support
3230 – stronger support and potential demand zone
Outlook:
Bullish bias remains intact while the Gold holds above 3266. A sustained break below this level could shift momentum to the downside in the short term.
This communication is for informational purposes only and should not be viewed as any form of recommendation as to a particular course of action or as investment advice. It is not intended as an offer or solicitation for the purchase or sale of any financial instrument or as an official confirmation of any transaction. Opinions, estimates and assumptions expressed herein are made as of the date of this communication and are subject to change without notice. This communication has been prepared based upon information, including market prices, data and other information, believed to be reliable; however, Trade Nation does not warrant its completeness or accuracy. All market prices and market data contained in or attached to this communication are indicative and subject to change without notice.
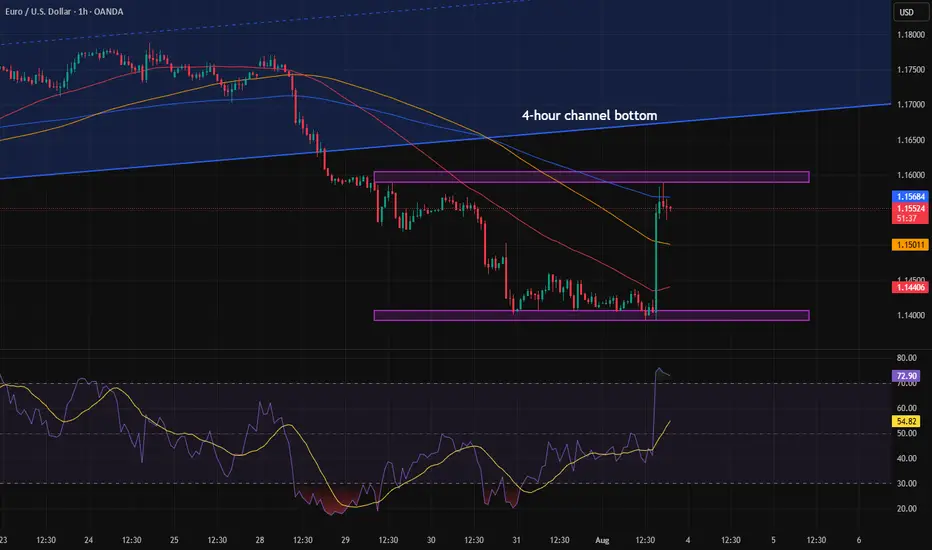
Trend decision after the newsAfter the news, the price nearly reached the bottom of the higher time frame channel and paused. We need to see whether the price can break into the channel or not. Personally, I don’t think that will happen. I believe a range will form within the marked zone, and then the price will drop further.
KSE 100 Technical Analysis | 01 AUGUST 2025 (corrected)KSE 100 Technical Analysis | 01 AUGUST 2025
The KSE 100 index is moving in a textbook bullish pattern, having recently completed a trading range marked by a horizontal channel in light blue. This pattern has provided a strong base for the index's renewed uptrend. We expect the index to be more stable and stronger than in recent days.
Key Levels
- *Immediate Support*: 140300
- *New Immediate Target*: 142840
Current Trend
- The index is highly bullish and always in an uptrend, with multiple strong supports in place.
Expectation
- The index is expected to continue its upward movement, driven by its strong bullish pattern and support levels.

Silver XAGUSD is forming a bullish IB pattern The market of silver XAGUSD is in Up trend
it formed a correction wave
near the previous levels of multi bullish price action between 36 and 36,30
this market is forming an IB pattern
buy stop order must be place at the HH of the MB at the price 37.35
SL 36
TP 39

Daily Bitcoin AnalysisBitcoin is at support at $115,000. Personally, I think this support will not hold and it will reach the next level of 112,000. Why? Because the downward momentum of the price is high.
This is not financial advice

XAU/USD GOLD NFP DIRECTIONThis chart analysis is for XAU/USD (Gold vs. U.S. Dollar) on the 4-hour timeframe. The focus is on a bearish market structure, highlighting potential Price of Interest (POI) zones for a short (sell) setup.
Key Elements:
Market Structure: Clear downtrend with lower highs and lower lows.
POIs Identified:
Optional POI: An initial supply zone where price might react.
Extreme POI: A more significant supply zone marked for a stronger potential reversal.
Labels & Notes:
The price levels are marked between 3,320 – 3,340, showing where the reversal is expected.
Interpretation:
The chart anticipates a retracement upward into the POIs before continuing the bearish move. Traders may look to enter short positions around these zones, especially the Extreme POI, which is seen as a high-probability reversal area.

Classic Liquidity Trap on TRX -TRXUSDT-4HPrice hunted buy-side liquidity with a sharp fakeout move, trapping breakout traders.
After breaking structure (BOS) and forming internal liquidity, the short setup was confirmed.
Entry placed on the mitigation of the order block with clear risk defined above the fakeout.
Targeting sell-side liquidity for maximum R:R. Clean and calculated.

Gold Approaches Key Reversal Zone After Liquidity Sweep.Gold has recently broken out of a parallel channel during the New York session, followed by a strong upward move triggered by the NFP (Non-Farm Payroll) news event. Currently, the market is trading near a key trendline resistance zone. In this area, the price has also swept the liquidity residing above recent highs, indicating that potential buy-side liquidity has been taken out.
This level now becomes critical for observation. If the market forms a Market Structure Shift (MSS) or provides any valid bearish confirmation — such as a strong rejection candle, bearish engulfing, or a break of lower timeframe support — then there is a high probability that a downward move may follow from this zone.
As always, conduct your own research (DYOR) and wait for price action to confirm the bias before executing any trades. Acting on confirmation rather than assumptions protects both capital and strategy.

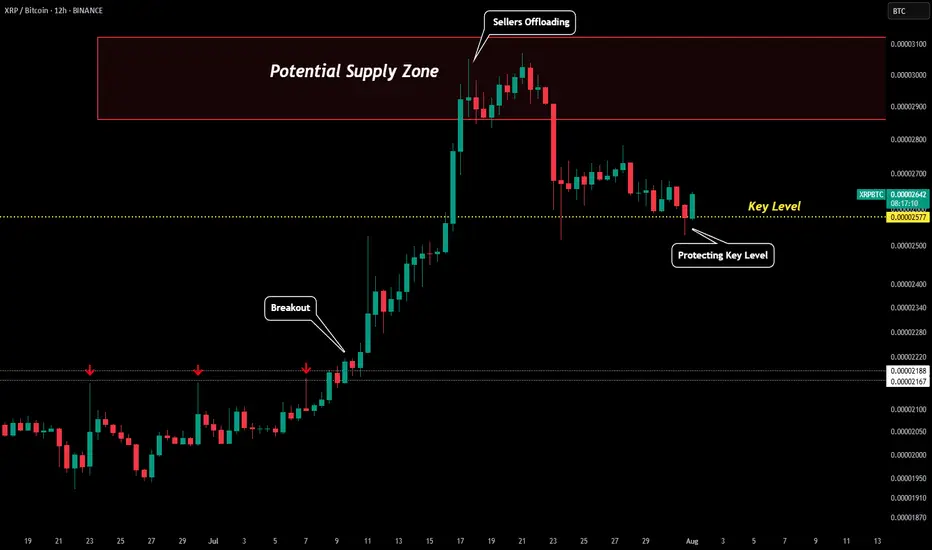
XRP/BTC - Perfect Prediction Please refer to our previous post:
After the XRP breakout we outlined that XRP/BTC was the most important pair to watch. Also, we outlined that the XRP/BTC pair was likely to push into our "potential supply zone" that ranges between around 0.0000285 and 0.000031.
This is exactly what happened with our XRP/BTC pair topping out around 0.0000307. Thus confirming resistance as sellers started offloading in this range. Once the pair broken down from the supply zone it tanked to our yellow dotted line "key level".
So far price has been respecting this key level with all candle bodies above. This has also been in alignment with the psychological $3 level. If XRP/BTC closes a 12H/1D candle body below the yellow dotted line the uptrend is likely not to stay in tact.
For now, with the pair respecting the yellow line a move back to test the bottom of our supply zone (0.0000285) is on the table.
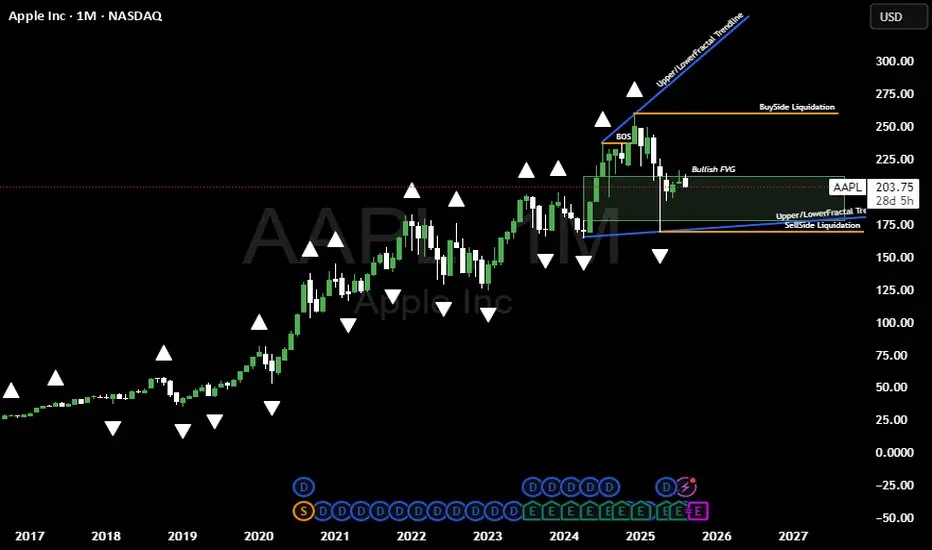
Bullish Idea on APPLNASDAQ:AAPL / Lovley day its been a while, am planing to share my views on the markets atleast once a week from now going forward. Basically on this bias idea above here @LutthMage we are leaning more on long term holding, WITH AN ADVANTAGE OF TAKING SHORT TERM TRADES BASED ON OUR LONG TERM INVESTMENT IDEA WE ARE SURE YOU WILL UNDERSTAND AS TIME GOES BY.
NOW LET THE GAMES BEGIN```
On the chart above we a basically bullish due to 4 reasons
1. The trend is our friend its currently bullish, because AAPL is BREAKING STRUCTURE NO VISIBLE Change of character as of yet
2. We got a widening channel currenly bouncing of the lower level line of the channel.
3. Price is playing around a Bullish FVG
4. APPLE JUST CREATED SELL SIDE LIQUIDITY.
We will keep you posted on the short term trades we execute based on this bullish bias on APPL, ofcourse only if they do appear for now we sit and do the hardest thing to do wich is NOTHING.
AS TIME GOES BY YOU WILL CHARACTERIZE A WASH RINSE AND REPEAT PROCESS FROM US @LutthMage NASDAQ:AAPL
Gold Price Target: 3380-3400+, Set a Trailing StopGold Price Target: 3380-3400+, Set a Trailing Stop
As shown in Figure 4h:
Gold finally rallied this weekend.
Despite recent heavy losses for long positions, the past two days have been encouraging.
We ultimately managed to successfully buy the dip in the 3280-3300 range and recover all our losses.
Gold prices continue to rise, and everyone is asking if it's time to sell.
Now is the critical time to exit.
We must acknowledge one fact:
Gold currently presents a huge opportunity.
Of course, the risks are also increasing.
At times like these, I always emphasize that the best approach is to set a 10-point trailing stop.
Even if gold prices soar, we can move with them.
This non-farm payroll data was a huge disappointment.
It was a truly positive surprise for gold.
The market expected 110,000 new jobs, but the result was a disappointing 73,000, a decrease of half from the previous month.
The market went into a tizzy after the outperformance. But even more shocking news is yet to come: Non-farm payrolls for May and June were revised downward by a combined 258,000.
This means the June gain was revised downward from 140,000 to 14,000.
The May gain was abruptly revised downward from 140,000 to 19,000.
The strong data of the past two months was completely false.
Market followers have become the "clowns" of the Fed and Trump.
Now you understand why everyone praised Powell's hawkish speech two days ago.
Because Powell said: "Only if there is a severe decline in employment will we consider cutting interest rates."
Just this Wednesday, some good non-farm payroll data was released.
This undoubtedly gave the market a false impression.
Everyone believed that a rate cut was impossible, and the probability of a September cut had dropped to 40%.
However, today's poor non-farm payroll data, combined with revisions to May and June data, revealed the truth.
The job market has been dismal over the past quarter.
The market reacted quickly, and gold prices soared on this sentiment.
My advice is to buy gold at a low price and hold on.
For investors who have successfully bought in the 3280-3300 level in recent days, I recommend setting a 10-15 pip trailing stop-loss.
Gold prices are likely to continue their upward trend next Monday.
Our next target is above 3380-3400 points.

Silver Remains a Buy on DipsIt seems the precious metals market didn’t mourn the Fed’s decision and subsequent press release for long.
The uptrend remains intact, and the previously supportive factors are still in play.
Even amid the negative news, there was no sharp sell-off — everything stayed within the trend. This clearly signals that rate cuts are on the horizon, and metals are likely to continue their upward move.
We only trade from the long side — nothing has changed.
At the moment, we've seen a pullback, and it feels strange not to take advantage of it and add more silver to the portfolio.
Stop-loss is set below yesterday’s candle low at 36.15.
We’ll see how the position develops. For now, the idea is to hold as long as the stop-loss holds. The long-term target is 48. Obviously, we won't reach it quickly, so I’ll trail the stop as the trade progresses — first to breakeven, and eventually into profit.

GBPCHF Break of trendline resistance GBPCHF has formed W pattern at the support and price looks to be reverses after the trendline resistance has been broken the first target will be the fib 0.5 of recent swing high if breaks down then it may go to Fib 1 . let us see

Market Stuck in Limbo? XAGUSD Update & Likely Range AheadLet’s talk silver.
The market's clearly undecided — no real momentum, just hesitation.
We’re approaching overextended RSI levels, so don’t expect fireworks just yet.
Im Skeptic from Skeptic Lab and In this quick update, I’ll show you what I’m watching for both long and short triggers …
and why a range might dominate the next few days.
👉 Watch till the end to avoid getting trapped by fake breakouts.

TRADE IDEA – EUR/USD SHORT (T2 TRAP REVERSAL)🔻 TRADE IDEA – EUR/USD SHORT (T2 TRAP REVERSAL)
📍 ENTRY ZONE: 1.1560 – 1.1580
🎯 TARGETS:
• TP1 = 1.150
• TP2 = 1.140
• TP3 = 1.130
• TP4 = 1.120
🛡️ STOP LOSS: 1.1600 (above Tier 2 trap extension)
📐 STRUCTURE SNAPSHOT:
• T1 (Macro): 🔻 Down
• T2 (Structure): 🔻 Trap Zone Active (161.8%)
• T3 (Execution): ⚠️ Rejection confirmed via M1 spike + engulf
• T4 (Micro): 🧨 Trap spike → lower high forming
📊 EXECUTION LOGIC:
• M1 rejection at 1.1580 confirmed
• Bearish engulf candle formed post-spike
• Multiple shorts laddered (1.1565 / 1.1580)
• SL held above extension zone
• Price now below both entries
🚦 TRADE STATE: ⚔️ ARMED
• Add-on only valid under 1.1560
• SL trail after 1.1550 break
• No long bias unless 1.1610 breaks with body close
#Renko #FractalCodex #EURUSD #ShortSetup #TrapReversal #Fibonacci #PriceAction

XAUUSD ultra-short-term sell trade.The hourly chart still shows a downward trend. Short-term downward pressure will continue. If you want to trade in the London market, consider selling at high levels and pursuing short-term trend trading.
3300-3295 SELL
TP3285-3280
