EURUSD: Move Down Expected! Short!
My dear friends,
Today we will analyse EURUSD together☺️
The price is near a wide key level
and the pair is approaching a significant decision level of 1.15337 Therefore, a strong bullish reaction here could determine the next move up.We will watch for a confirmation candle, and then target the next key level of 1.15208.Recommend Stop-loss is beyond the current level.
❤️Sending you lots of Love and Hugs❤️
Trend Analysis

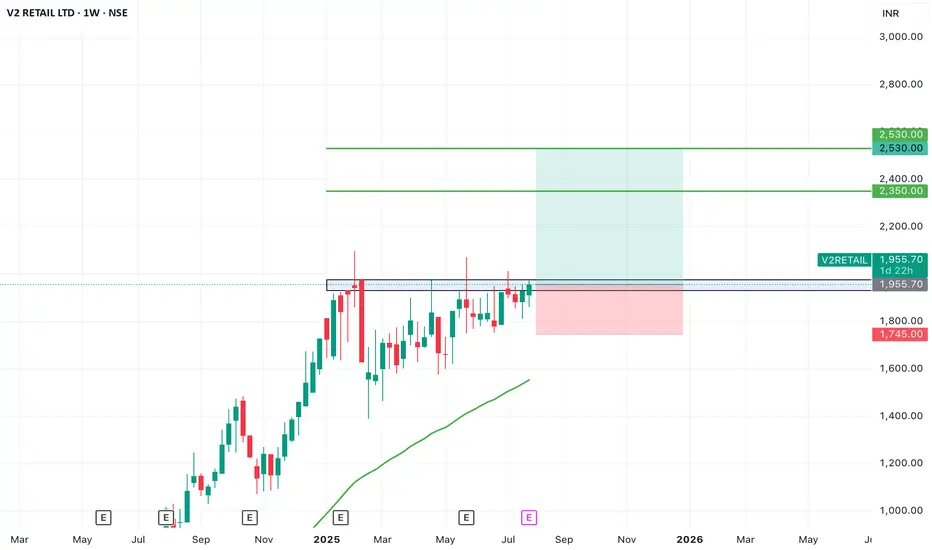
SWING IDEA - V2 RETAILV2 Retail , a small-cap value fashion retailer with a pan-India presence, is showing strong bullish momentum and a textbook swing trade setup backed by multiple breakout signals.
Reasons are listed below :
Breakout from a VCP (Volatility Contraction Pattern) – indicating accumulation and strength
Ascending triangle breakout – classic continuation pattern
Cleared major resistance zone, confirming bullish intent
Maintains a clear uptrend with higher highs and higher lows
Target - 2350 // 2530
Stoploss - weekly close below 1745
DISCLAIMER -
Decisions to buy, sell, hold or trade in securities, commodities and other investments involve risk and are best made based on the advice of qualified financial professionals. Any trading in securities or other investments involves a risk of substantial losses. The practice of "Day Trading" involves particularly high risks and can cause you to lose substantial sums of money. Before undertaking any trading program, you should consult a qualified financial professional. Please consider carefully whether such trading is suitable for you in light of your financial condition and ability to bear financial risks. Under no circumstances shall we be liable for any loss or damage you or anyone else incurs as a result of any trading or investment activity that you or anyone else engages in based on any information or material you receive through TradingView or our services.
@visionary.growth.insights
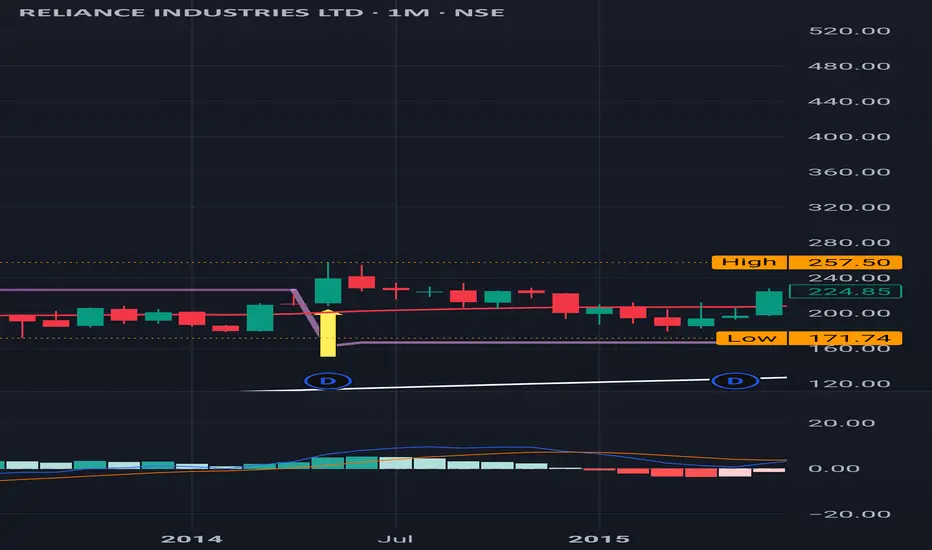
Reliance : A brilliant Journey from May 2014 from 200Reliance : A brilliant Journey from May 2014 from the price level of 200 to until now
It has never been a Sell on a monthly time frame since then.
Even during the Covid time in March 2020 it ditched a Sell signal on a Monthly Time Frame.
It started it's run at around the price level of mere 200 ish in May 2014 and never looked back. Splits / Bonuses/ Dividends / Jio stocks options are all extras apart from the price actions.
It seems this is why it's known as MOTABHAI
( Not a Buy / Sell Recommendation
Do your own due diligence ,Market is subject to risks, This is my own view and for learning only .)
GBPJPY holds momentum, waiting for the final pushThe GBPJPY pair is moving sideways between 197.400 and 199.000, while maintaining its position inside the ascending price channel. Each pullback is quickly absorbed near the lower support, indicating that buying pressure is quietly building.
💡 Bullish factors supporting the trend:
– UK Services PMI beats expectations, strengthening economic outlook.
– BOJ maintains negative interest rates, weakening the JPY.
– Risk-on sentiment drives capital back into the GBP.
🎯 Suggested strategy:
Buy near 197.400 or on a breakout above 199.000.
Target: 201.500 | Stop-loss: below 196.800.

EURJPYPrice just broke key internal structure with a clear BoS (Break of Structure) after liquidity sweep above the previous highs. We're now watching for a clean retracement to the supply zone to execute a sniper short.
📍 Setup Details:
BoS Confirmed: 172.00 level cleanly broken
Area of Interest: Supply zone 172.90–173.60
Stop: Above liquidity zone ~174.55
Target: Downside continuation toward 168.00–167.00
📉 RSI shows momentum weakness on the pullback

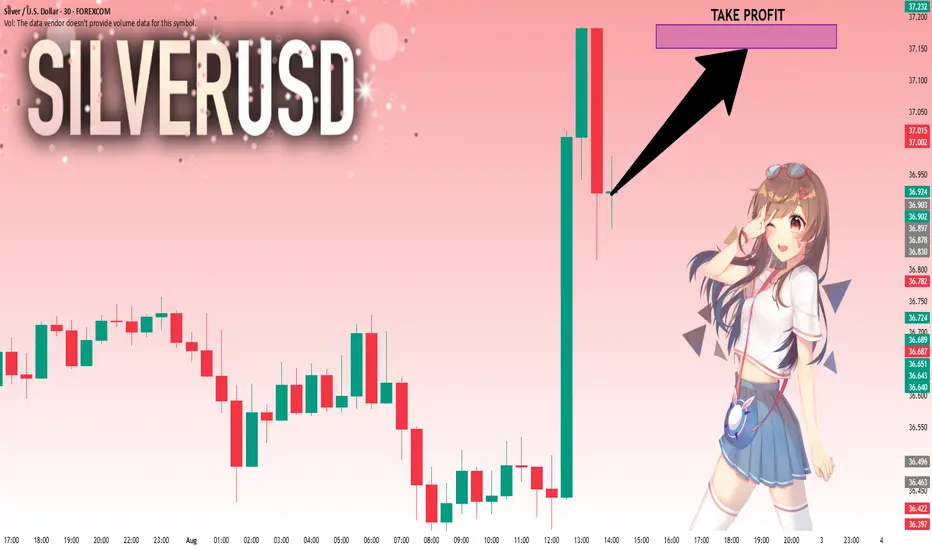
SILVER: Local Bullish Bias! Long!
My dear friends,
Today we will analyse SILVER together☺️
The recent price action suggests a shift in mid-term momentum. A break above the current local range around 36.920 will confirm the new direction upwards with the target being the next key level of 37.150 and a reconvened placement of a stop-loss beyond the range.
❤️Sending you lots of Love and Hugs❤️
GOLD falls sharply, fundamental analysis and technical positionOANDA:XAUUSD fell sharply below the $3,300/oz price level as Chairman Jerome Powell did not signal any rate cuts at his next press conference on September 16-17. He only said that “no decision has been made on September” and that “more data will be evaluated in the coming months.” Economic data undermined the case for a rate cut, while geopolitical play remained a potential support.
The Fed and Interest Rates
The Federal Reserve kept interest rates unchanged for a fifth straight meeting on Wednesday, defying persistent pressure from President Donald Trump and White House officials.
However, two members of the central bank's board dissented, a rare move in three decades that underscored growing divisions within the central bank over the impact of Trump's tariff policies.
At the meeting, the Fed kept its benchmark federal funds rate in a range of 4.25% to 4.5%, in line with policy through 2025. Last fall, the Fed cut rates by a total of 100 basis points.
However, Federal Reserve Board Governors Christopher Waller and Michelle Bowman opposed cutting interest rates by another 25 basis points, marking the first time since Alan Greenspan in 1993 that two board members have opposed a majority resolution at a meeting.
At the press conference, Chairman Jerome Powell did not signal a rate cut at the next interest rate meeting on September 16-17, saying only that “no decision has been made about September” and that “more data will be evaluated in the coming months.” Powell also noted that despite Trump’s call for a sharp 3% rate cut to reduce interest costs on US debt and stimulate the housing market, the Fed will continue to monitor the longer-term impact of tariffs on the path of inflation and economic recovery.
Market expectations for a Fed rate cut in September fell to 47% in Powell's speech.
Economic data
ADP jobs data beats expectations and is bearish
US ADP payrolls jumped 104,000 in July, beating market expectations of 75,000 and marking the biggest gain since March. The data showed continued strength in the labor market, reinforcing the Federal Reserve’s stance on keeping interest rates high. Meanwhile, the preliminary estimate of annual GDP growth in the second quarter came in at 3% (2.4% expected), and the core personal consumption expenditures price index rose 2.5% year-on-year (2.3% expected), indicating both economic resilience and inflation stability, further weakening expectations for a rate cut.
Keep an eye on the ISM manufacturing PMI and non-farm payrolls data on August 1. If the jobs numbers continue to be strong, this could reinforce the Fed’s dovish stance.
Geopolitical and Policy Plays
News of a 90-day extension of the US-China tariff deal has eased some safe-haven demand, but Trump’s August 8 deadline for a new Russia-Ukraine deal, coupled with tensions in the Middle East, continue to provide potential support for gold.
Continued purchases by central banks (such as China and India) are a positive signal in the medium to long term, but are unlikely to offset short-term pressure from the Federal Reserve’s policies.
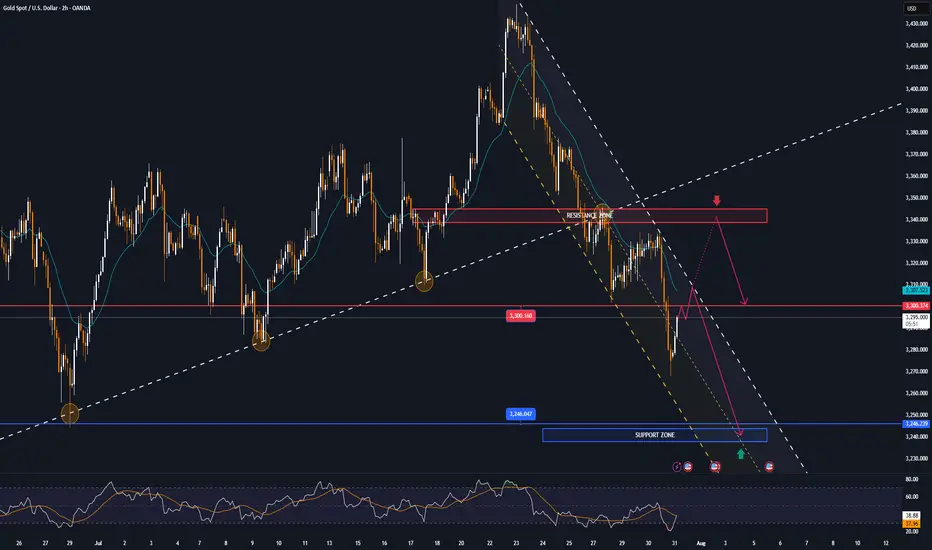
Technical outlook for OANDA:XAUUSD
On the daily chart, gold has been sold below the $3,300 level and now the $3,300 level has become the nearest resistance at present. For now, gold will be limited by the area of the 0.382% Fibonacci retracement with the original price point of $3,300, along with that it has formed a short-term downtrend with the price channel, the next target will be around $3,246 in the short term followed by the Fibonacci retracement level noted with readers in previous publications.
On the momentum front, the Relative Strength Index is operating below 50 and is far from the oversold zone (20-0), indicating that there is still plenty of room for downside ahead.
In addition, the gold trend will also be pressured by the EMA21, as long as gold remains below the EMA21, the current technical conditions continue to favor the downside.
For the day, the technical outlook for gold is bearish with notable positions listed as follows.
Support: 3,246 – 3,228 USD
Resistance: 3,300 USD
SELL XAUUSD PRICE 3345 - 3343⚡️
↠↠ Stop Loss 3349
→Take Profit 1 3337
↨
→Take Profit 2 3331
BUY XAUUSD PRICE 3240 - 3242⚡️
↠↠ Stop Loss 3236
→Take Profit 1 3248
↨
→Take Profit 2 3254
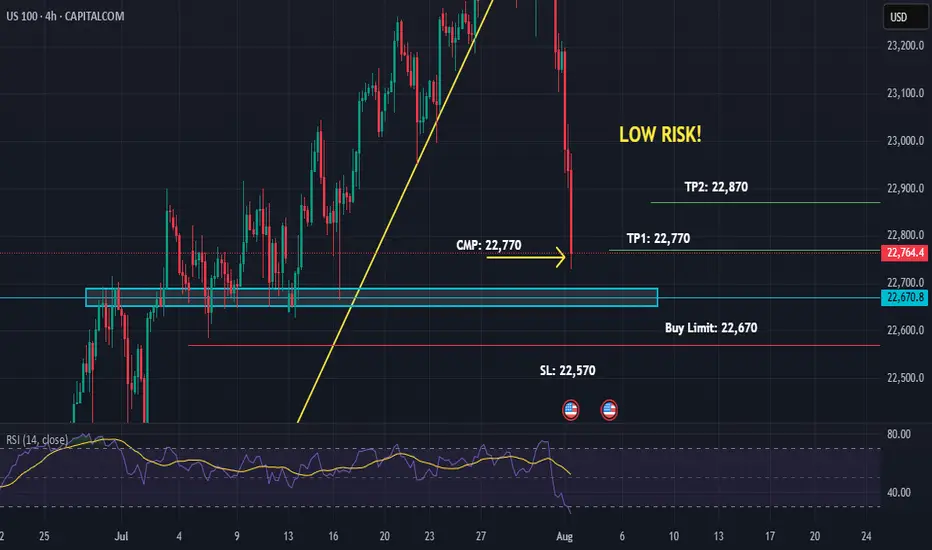
US100 Buy-Limit on Support 4HUS100 Buy-Limit on Support 4H
01-08-25
06:57 PM
Low Risk Trade because market is bearish!
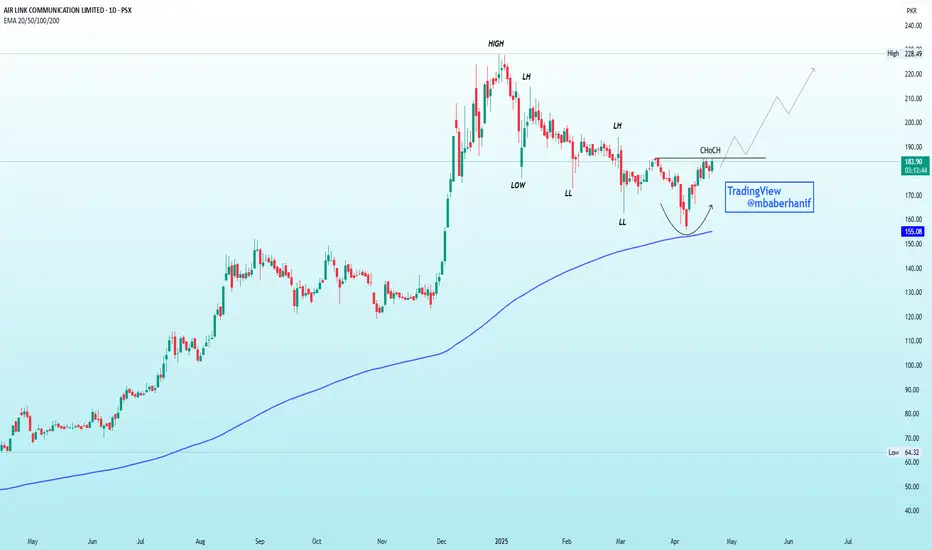
AIRLINK | An Imminent Reversal!!!Previous Trend: Bearish, confirmed by Lower Highs (LH) and Lower Lows (LL).
CHoCH (Change of Character): Bullish signal—price broke previous LH.
Pattern: Rounded bottom forming near the 200 EMA (~155), acting as strong support.
Volume: Slight pickup near bottom—early sign of accumulation.
Outlook: Bullish reversal likely. Break above CHoCH with volume confirms uptrend.
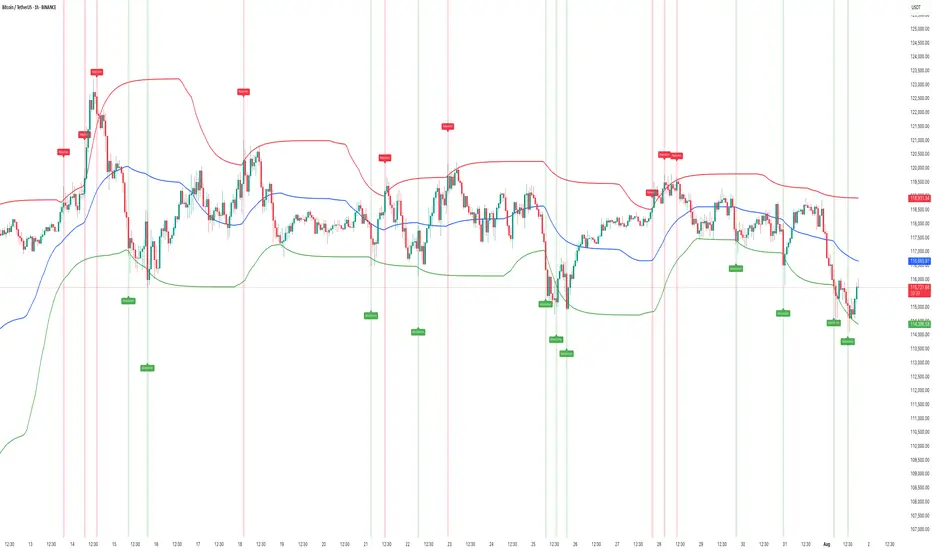
HOW TO Spot Liquidity-Driven Reversals & Market TrapsAdaptive Liquidity Pulse
🎯 Spot Liquidity-Driven Reversals & Market Traps
The Adaptive Liquidity Pulse is designed to help traders detect high-volume rejections and absorptions, revealing where big players are likely defending or accumulating positions. This indicator is especially useful for spotting market traps, liquidity sweeps, and swing reversals.
⸻
🧠 How It Works
1. Dynamic Liquidity Zones
• Red Band (High EMA) → Potential supply/rejection zone
• Blue Band (Mid EMA) → Equilibrium / magnet zone
• Green Band (Low EMA) → Potential demand/absorption zone
2. Signal Labels
• 🔴 Rejection → Price spikes into high liquidity with volume → Bearish bias
• 🟢 Absorption → Price flushes into low liquidity with volume → Bullish bias
3. Volume-Weighted Detection
• Only triggers signals when volume exceeds a configurable threshold
• Filters out weak moves, highlighting true liquidity events
⸻
📊 Best Use Cases
• Scalping & Intraday Trading: Identify early reversal points
• Swing Trading: Track absorption/rejection cycles to time entries/exits
• Liquidity Sweep Detection: Spot where false breakouts occur with volume confirmation
⸻
⚡ Trading Tips
• Use Rejection (Red) for short entries or take-profits near highs
• Use Absorption (Green) for long entries or short exits near lows
• Combine with support/resistance zones or trend structure for higher accuracy
• Midline (Blue) often acts as a mean-reversion magnet in ranging markets
⸻
📢 Alerts
• 🔴 Rejection Alert → Strong selling pressure at liquidity zone
• 🟢 Absorption Alert → Heavy buying at demand zone
⸻
🧠 Why Traders Love It
• ✅ Visualizes hidden liquidity interactions
• ✅ Highlights trap zones before reversals occur
• ✅ Works across crypto, indices, forex, and commodities
• ✅ Designed for confluence with other strategies
⸻
This script gives you a real-time pulse of liquidity shifts, allowing you to trade like institutions and avoid falling into retail traps.
⸻
How to maintain stable operations before NFP dataYesterday, gold closed the month with a long upper shadow doji candlestick, indicating strong upward pressure, with monthly resistance at 3439-3451. Today marks the beginning of the month, and with the release of numerous data indicators such as NFP, unemployment benefits, and PMI, there is considerable uncertainty, so intraday trading should proceed with caution.
Judging from the daily chart, the current MACD indicator is dead cross with large volume, and the smart indicator is running oversold, indicating a low-level fluctuation trend during the day. At present, we need to pay attention to the SMA60 moving average and the daily middle track corresponding to 3327-3337 on the upper side, and pay attention to the intraday low around 3280 on the lower side. The lows of the previous two days at 3275-3268 cannot be ignored. There is a possibility that the low-level oscillation will touch the previous low again.
From the 4H chart, technical indicators are currently flat, with no significant short-term fluctuations expected. Low-level volatility is expected to persist within the day. Then just focus on the support near 3275 below and the middle track pressure near 3307 above. Looking at the hourly chart, gold is currently oscillating below the mid-range band, with resistance at 3295-3307 to watch in the short term.
Overall, the market is expected to remain volatile before the release of today's data. Based on Wednesday's ADP data, this round of data is also expected to be around $100,000. The contrast between ADP and NFP last time deserves our caution. The current market is basically optimistic about the short-selling situation, which is exactly what I am most worried about. If the gold price can stabilize above 3,300 before the NY data, the possibility of NFP data being bullish cannot be ruled out.
Intraday European trading suggestion: if the current gold price falls back to 3285-3280 and stabilizes, you can consider short-term long positions, with the target at 3295-3305. If the gold price tests the low of 3275-3268 again and does not break through, you can consider a second chance to go long. After making a profit of $10-20, you can consider exiting the market with profits. The market is volatile and unstable, so be sure to bring SL with you and pay close attention to the impact of the NFP data. Conservative investors can enter the market after the data is released.
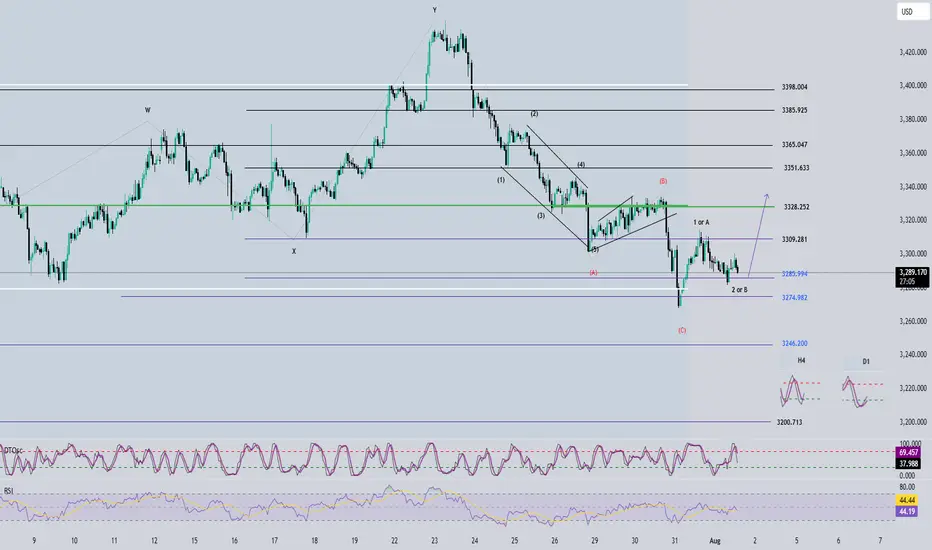
Elliott Wave Analysis – XAUUSD August 1, 2025📊
________________________________________
🔍 Momentum Analysis:
• D1 Timeframe:
Momentum has reversed to the upside. Based on this signal, we expect a bullish trend to continue for the next 5 daily candles — likely until mid-next week.
• H4 Timeframe:
Momentum has also turned upward → This suggests that from now until the U.S. session, the price will likely continue to rise or consolidate with an upward bias.
• H1 Timeframe:
Momentum is currently turning down → We anticipate a short-term corrective move. We should wait for H1 to enter the oversold zone and give a bullish reversal signal before looking for long entries.
________________________________________
🌀 Wave Structure Analysis:
The current wave structure remains complex and lacks clear confirmation. Thus, the current wave labeling should be considered provisional. However, the wave count has not been invalidated, and D1 momentum supports a bullish outlook — so we continue to maintain our wave structure bias.
Important Note:
Wave (C) in red appears relatively short. This leaves open the possibility that the price may continue lower, targeting:
• ⚠️ 3246
• ⚠️ 3200
→ This scenario will be triggered if price breaks below 3268, especially given today's Nonfarm Payroll (NFP) report.
________________________________________
📌 Two Possible Wave Scenarios:
1. Scenario 1: Black Waves 1 – 2 – 3
o Wave 1 (black) is complete.
o We are now in Wave 2 (black) → Preparing for Wave 3.
o Wave 3 tends to be strong, impulsive, and sharp with large candle bodies.
o Target: 3351
2. Scenario 2: Black ABC Correction
o The market is currently in Wave B (black).
o Potential target for Wave C: 3328
________________________________________
🛡 Support Zones & Trade Strategy:
• Support Zone 1: 3290 → A good area for potential buying, but we must wait for H1 to enter the oversold region and show a bullish reversal.
• Support Zone 2: 3275 → Deeper buy zone if the price corrects further.
________________________________________
💡 Trade Plan:
📍 Option 1 – Buy Limit:
• Buy Zone: 3290 – 3289
• Stop Loss: 3280
• Take Profit 1: 3309
• Take Profit 2: 3328
• Take Profit 3: 3351
📍 Option 2 – Buy Limit:
• Buy Zone: 3275 – 3273
• Stop Loss: 3265
• Take Profit 1: 3309
• Take Profit 2: 3328
• Take Profit 3: 3351
________________________________________
📎 Notes:
• Experienced traders should wait for clear confirmation signals on H1 before entering trades.
• New traders may consider using limit orders in the proposed buy zones.
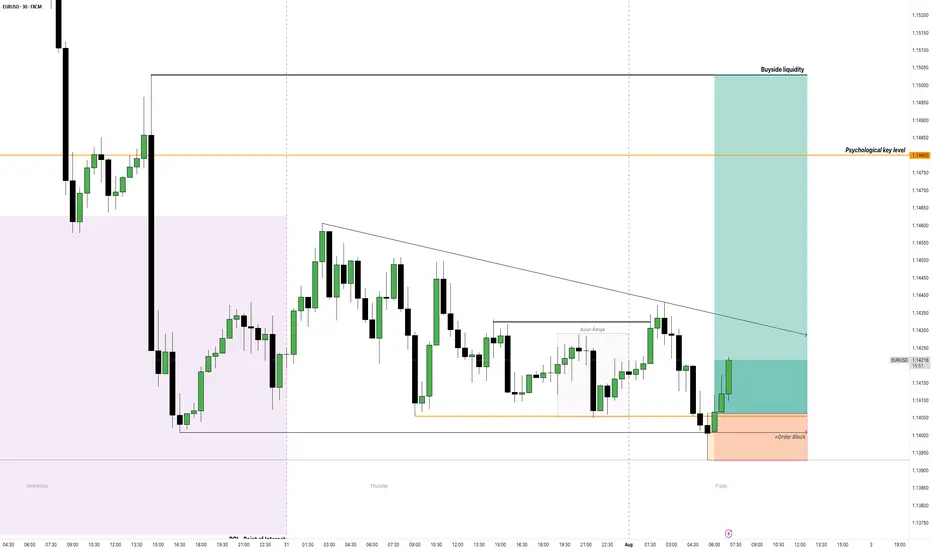
My Trading Journal on EU 01.08.2025On the first day of August 2025, I am entering a new month filled with opportunities. I am eager to see how the EU performs today, as it has influenced my last two trades. I hope that today marks either a strong or weak start to the month. Let's see how the market reacts in New York.
Be cautious with your trades and remember to pay attention to the high-impact news today: the Non-Farm Payrolls (NFP) and Employment Change reports.
GBPUSD - 31/7/25 - Bullish reversalThe setup is not great, but im expecting a pull back on the dollar which should result in a bullish move on the GBP and EUR.
There is an extreme zone that i would like price to reach to with the possibility of not taking out the previous HL. But lets see.
+ve:
1. Extreme zone that resulted in the bullish move.
2. slight imbalance above the extreme zone
3. Dollar setting up for a pull back that will result in a bullish move on GBP
4. TP is just above the equal high liquidity zone
-ve:
1. close to the higher low and that may be swept

XAUUSD – Smart Money Sell Setup during New York Session | ICT St
Gold (XAUUSD) has just completed a classic liquidity grab above the London session highs, forming a potential Judas Swing as New York begins.
On the 4H timeframe, we clearly have a bearish BOS (Break of Structure), and price has returned to a Premium zone within a bearish FVG and OB (Order Block).
Today is NFP Friday, and after the Fed kept rates steady mid-week, we’re expecting high volatility.
Current price action has swept the overnight liquidity and is now reacting inside a Repricing Block, aligning perfectly with the NY Midnight Open level.
🎯 My Sell Plan (Live Execution):
Sell Limit: 3306.50
SL: 3317.50 (Above OB high)
TP1: 3281.20
TP2: 3268.50
TP3: 3253.90
🧠 Bias: Bearish
🕒 Session: New York
🧮 ADR: 43 pts
📉 Market Structure: Bearish
This setup follows the ICT methodology using time, liquidity, structure, and displacement.
If we break above 3317.50 with strong displacement, the idea becomes invalid.
Let's see if Smart Money takes it down into Friday’s close.

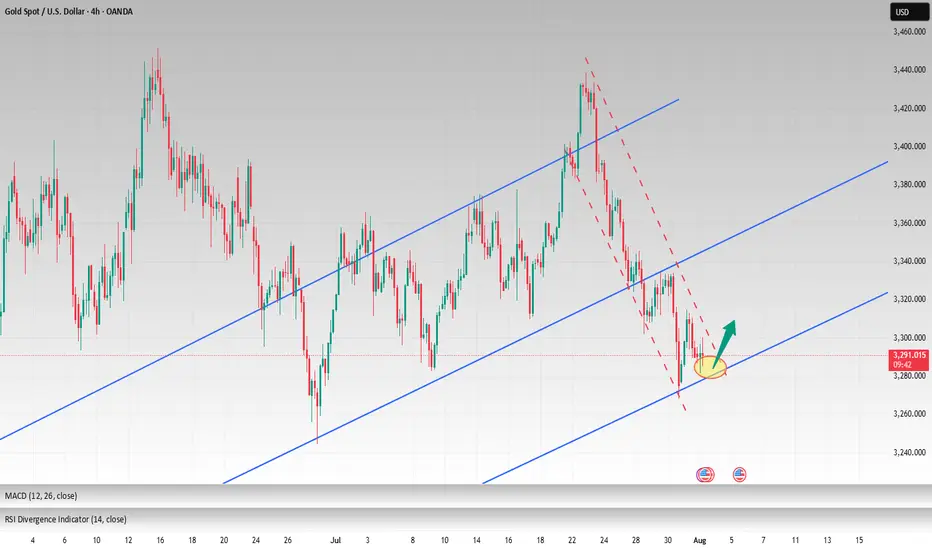
XAUUSD Possibility of a small correction towards 3330, re-entering the bearish phase and moving towards the specified targets

xauusdGold enters support by reaching daily trend line
If gold continues to hold support
Gold is expected to reach its previous high again

xauussWe will probably have a minor correction in this direction. We will wait for the trend line to break, if it breaks, the targets will be touched in order.

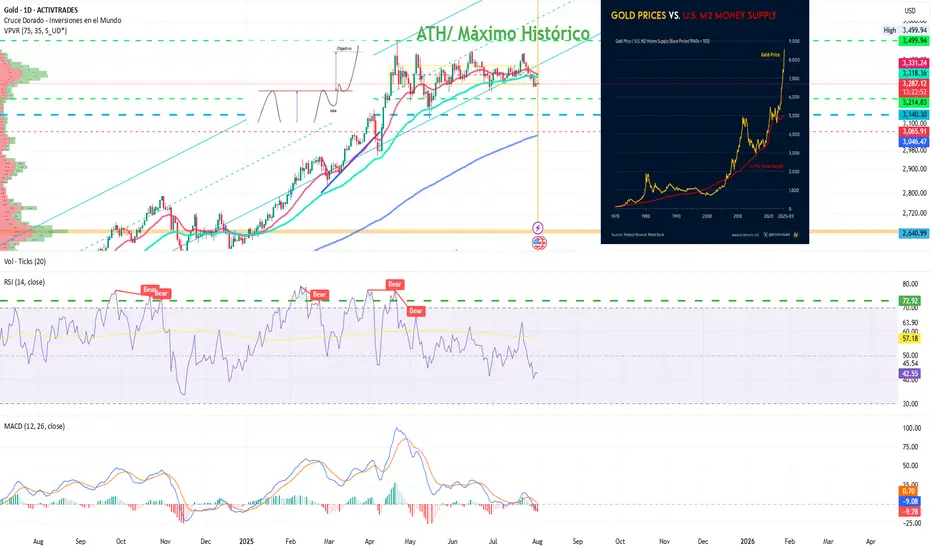
Gold: Are the Bulls Still Behind It?Ion Jauregui – Analyst at ActivTrades
Fundamental Analysis
In 2025, gold has appreciated around 27% year-to-date, reaching a peak of 33.37% at the end of April, driven by structural factors. Its strength is based on global de-dollarization, central bank purchases, persistent inflation, and expectations of real rate cuts in the U.S. Since real interest rates peaked in July 2023, gold has risen 74%, reinforcing its role as a hedge against monetary policy.
In addition, countries like China and Russia continue to accumulate gold as protection against the dollar and potential sanctions, supporting long-term structural demand. Diversifying with physical and financial gold (ETFs, mining stocks) is an increasingly common strategy in an environment of high debt, geopolitical tensions, and doubts about traditional safe-haven assets. A suggested allocation in a classic model portfolio could range between 10% and 25%, depending on the risk profile, in a typical equity-focused investment portfolio.
Technical Analysis
From a technical standpoint, gold has completed a long-term “cup with handle” formation that began in 2012, with an upside projection toward the $4,000 per ounce area. This pattern supports the continuation of its long-term upward structure.
In the short term, however, the price is in a consolidation phase after reaching all-time highs of $3,499.94 at the end of April. Since then, the lateral movement suggests a pause within the primary trend.
Technical indicators are showing mixed signals: RSI and MACD are pointing toward a possible oversold condition, suggesting a risk of short-term correction. Additionally, a bearish crossover between the 50-day and 100-day moving averages may reinforce selling pressure.
If this corrective scenario unfolds, gold could retrace toward a key support zone around $3,140, a level that has served as the base of the current range and where renewed buying interest could emerge.
Despite a possible pullback, the broader technical outlook remains constructive. Any correction would likely present tactical opportunities to re-enter the market—especially if expectations of real rate cuts or global geopolitical tensions persist.
Gold Consolidates After Highs
All in all, despite potential short-term pullbacks, gold continues to offer value as a tool for diversification, wealth protection, and a hedge against systemic risks. Its inclusion in portfolios remains relevant, even at current levels.
*******************************************************************************************
The information provided does not constitute investment research. The material has not been prepared in accordance with the legal requirements designed to promote the independence of investment research and such should be considered a marketing communication.
All information has been prepared by ActivTrades ("AT"). The information does not contain a record of AT's prices, or an offer of or solicitation for a transaction in any financial instrument. No representation or warranty is given as to the accuracy or completeness of this information.
Any material provided does not have regard to the specific investment objective and financial situation of any person who may receive it. Past performance and forecasting are not a synonym of a reliable indicator of future performance. AT provides an execution-only service. Consequently, any person acting on the information provided does so at their own risk. Political risk is unpredictable. Central bank actions can vary. Platform tools do not guarantee success.
US30 Robbery Blueprint: Breakout, Pullback, Escape Setup💎 Dow Jones Robbery Blueprint: The US30 Vault Crack Plan 💎
(Maximized for reach — within TradingView title limit)
🌟Hi! Hola! Ola! Bonjour! Hallo! Marhaba!🌟
Dear Market Robbers & Money Movers 🕵️♂️💰🚨
This ain't your average analysis — it’s a Thief Trader-style 🔥tactical mission🔥 aimed at the mighty "US30/DJI" (Dow Jones Industrial Average). We're talkin' about a precision heist with a full blueprint: entry zones, trap setups, and escape exits. Read carefully — this ain’t for the faint-hearted traders! 🧠🦾
🧠 Entry Zones (The Break-In) 📈
🛠 ENTRY 1: Crack the wall near 44700.00 – that’s the resistance gate. Wait for confirmation.
🎯 ENTRY 2: Sneak in at the Market Makers’ Trap around 43500.00 – a dirty zone where retailers get baited. Perfect time to strike long!
🧱 DCA/Layering strategy recommended. Stack those buy orders like a thief layering explosives on a safe. 💣💸
🛑 Risk Levels (Escape Routes/Stop Loss)
🔊 "Listen up, vault raiders! Never drop your SL until breakout is confirmed. If you jump early, you might land in a bear trap! 🪤"
🔐 Stop Zones (Based on Strategy):
📌 Swing Buy SL (2H TF): Place at 44100.00 for the stealth buy.
🏦 Institutional SL (Swing Zone): Drop it around 43000.00
🔐 Max Risk SL (3H TF): If you're deep, your last stand is at 39200.00
☝️ SL depends on your position sizing, number of entries, and risk appetite. Trade like a thief, not a gambler.
🎯 Heist Target (Profit Exit)
🏁 Escape Point: 46200.00 — or exit before heat rises! Don’t be greedy. Rob and vanish. 💨💰
🔥 Market Mood: Why the Heist Is On
"US30/DJI" is bullish AF — thanks to:
📊 Macro-Economic Wind at Our Back
📈 Institutional momentum
📰 Strong sentiment and intermarket flows
Check your chart radar: Fundamentals + technicals aligning = green light for robbery! 🟢
⚠️ Tactical Reminder: News Can Jam the Plan
📵 Avoid new entries during major economic releases
🛡 Use trailing SLs to protect running trades
Stay alert, stay alive. 💡
❤️ Support the Robbery Crew
Hit that 💥BOOST💥 — your love fuels our next mission.
Join us and ride daily heist plans with Thief Trading Style 🏴☠️🚀💰

ETHUSDT - FUTURES SIGNAL FUTURES SIGNAL
Coin: ETH
Direction: LONG
🟢Input range: market/3578
✔️ТР: 3726/3902
❌SL: 3501
We work from the order block zone, in which I expect a price reversal.

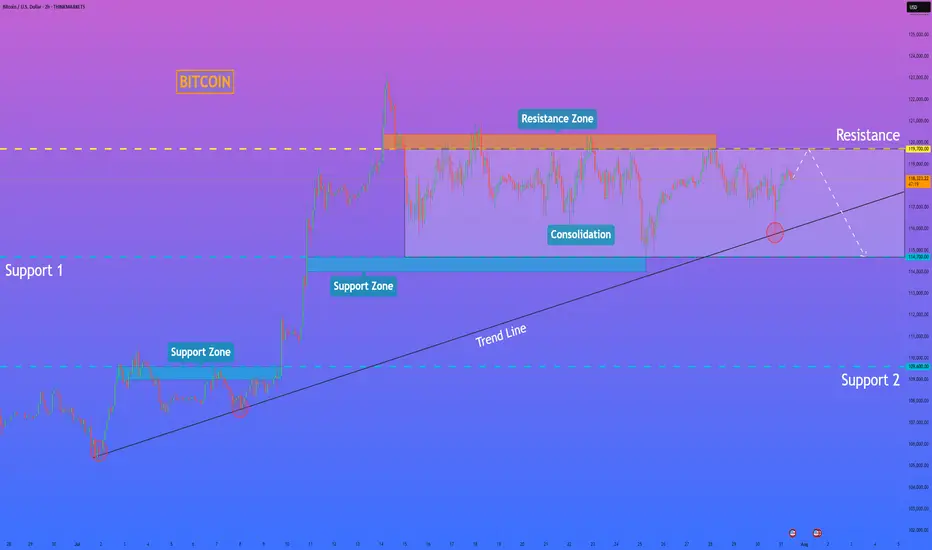
HelenP. I Bitcoin will rebound down from resistance levelHi folks today I'm prepared for you Bitcoin analytics. A technical review of the chart reveals a prolonged period of horizontal consolidation, during which the price has been trading within a well-defined range between support at 114700 and resistance near 119700. This phase of balance follows a significant prior uptrend, and a major ascending trend line is currently intersecting this range. My analysis for a short position is based on the expectation of a final 'test and fail' at the top of this consolidation. I believe the price will make one more attempt to rally towards the resistance zone around 119700. A strong rejection from this area, demonstrating sellers' control, would serve as the main confirmation for a bearish bias. Such a rejection would likely initiate a powerful downward move across the range, with sufficient momentum to break the critical ascending trend line. This would be a significant structural event, signaling a potential reversal of the larger trend. Therefore, the primary goal for this scenario is logically set at the 114700 support level, the bottom of the consolidation range. If you like my analytics you may support me with your like/comment ❤️
Disclaimer: As part of ThinkMarkets’ Influencer Program, I am sponsored to share and publish their charts in my analysis.
EUR/AUD BEARS ARE GAINING STRENGTH|SHORT
EUR/AUD SIGNAL
Trade Direction: short
Entry Level: 1.777
Target Level: 1.768
Stop Loss: 1.782
RISK PROFILE
Risk level: medium
Suggested risk: 1%
Timeframe: 2h
Disclosure: I am part of Trade Nation's Influencer program and receive a monthly fee for using their TradingView charts in my analysis.
✅LIKE AND COMMENT MY IDEAS✅
