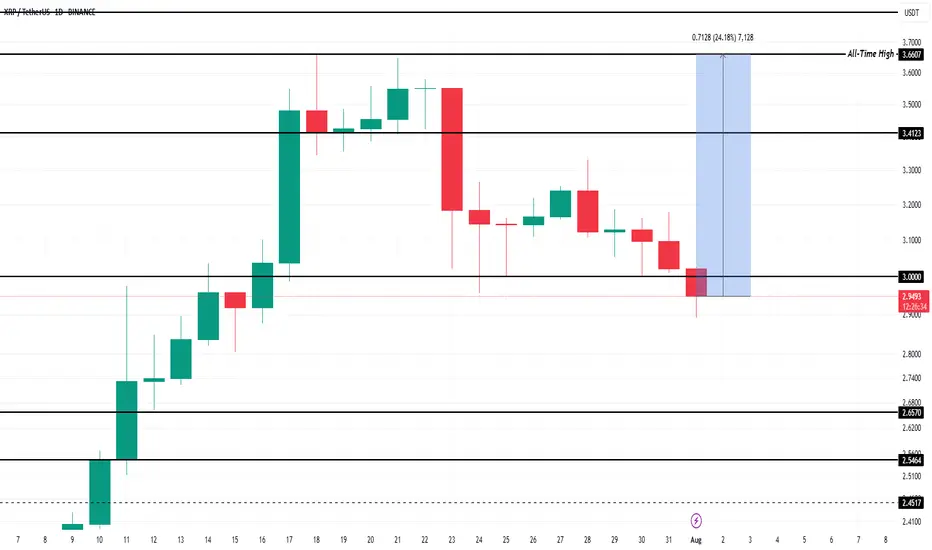
What To Expect From XRP In August 2025?Currently, BINANCE:XRPUSDT is trading at $2.99, slipping through the key support level of $3.00. While the altcoin is still over 22% away from its ATH of $3.66 , the foundation for potential growth remains strong. Historical data has shown that August typically brings bearish momentum for BINANCE:XRPUSDT , with median monthly returns of -6% .
However, given the strong buying activity observed recently and the positive technical indicators, this August might defy the usual trend. If BINANCE:XRPUSDT manages to secure support above $3.41, the altcoin could push towards its ATH once again . Alexis Sirkia, Captain at Yellow Network, discussed with BeInCrypto how XRP’s future could be looking like.
“Institutions that have been in the market for a while are gaining momentum. We're also, in the meanwhile, in a macro environment where funds are doing risk rotation… BINANCE:XRPUSDT is taking its stand with regulation and infrastructure, not hype. That's what will endure in the long run. Short-term flows are fleeting, but the groundwork laid today will define the cycle to follow.”
However, there’s a downside risk. If BINANCE:XRPUSDT fails to reclaim the $3.00 support, the price could fall to $2.65, invalidating the bullish thesis. A drop to this level would mark a four-week low and would likely lead to further selling pressure.
Trend Analysis
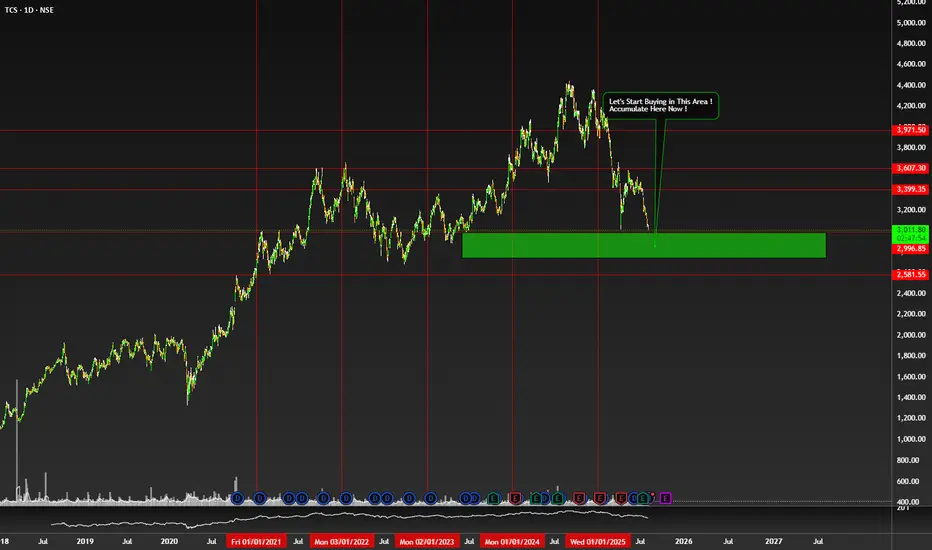
Time To Accumulate $NSE:TCS NSE:TCS
My Trade Opinion
Let's Accumulate here in Green area.
Best time to Buy here.
Don't Buy if Some One Think IT will Dead in india. :D
Future is at Some Time Ahead.
Don't Listen Just Observe it.
Company is Going to Aggressively Progress in Future.

USDZAR Bullish ideaAs we can see this is our USDZAR quarterly shift idea were we are anticipating price to rally to the upside toward our draw on liquidity objectives. We had a weekly volume imbalance and monthly mean threshold order block show us support after we took out major liquidity points. We also showed more support on our daily FVG and a market shift taking place after a displacement. We are anticipating a rally for USDZAR and will be looking to see how price plays out.
USDZAR is an exotic pair that is part of the emerging markets and emerging markets/exotic pairs can usually lead ahead of major forex pair or lag between major forex pairs so this can also help us with our intermarket analysis of forex pairs when determining our dollar strength against other basket currencies.

Insiders are selling Roblox ! Heres the levels you need to knowIn this video I lay out a solid plan for a move to the downside for Roblox after a 100% move to the upside since April of this year .
I demonstrate why I believe we will take a 30% retracement and provide confluent evidence to support this theory.
There are some fundamental reasons that I also did include alongside the technical analysis which is not my regular style but important given the context.
Tools used in the video 0.382 Fib , Standard Fib pull, Trend based fib and pivots .

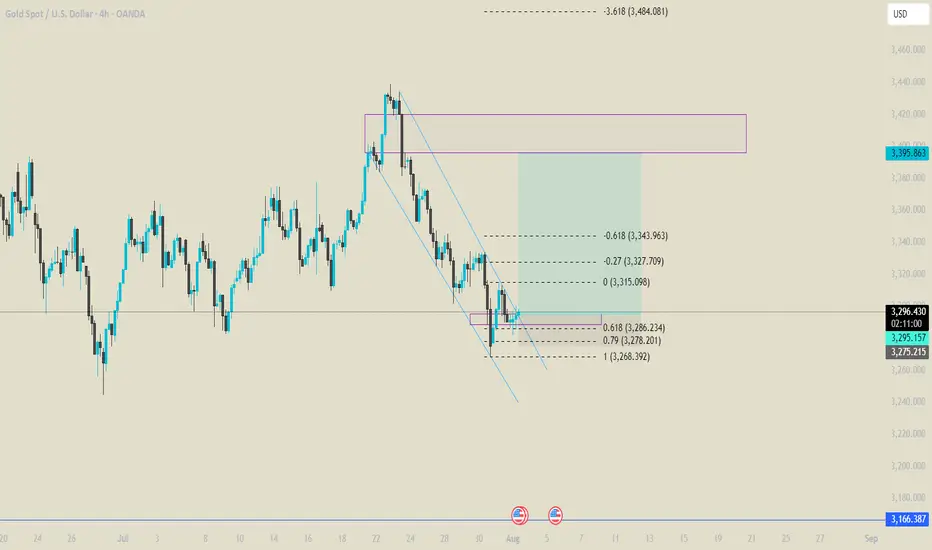
Gold (XAU/USD): Supply Zone Rejection & Bearish Breakdown Chart Breakdown:
Supply zone rejection: Gold revisited the “supply zone” (light green/grey area) and failed to break above — a classic signal of seller dominance.
Uptrend invalidated: A sharp rise (steep black trendline) ended with a peak marked by the green arrow, followed by a decisive breakdown.
Ichimoku Cloud test: Prices slipped through the Ichimoku components, reinforcing the shift to bearish sentiment.
Potential targets: The red/green risk‑reward box highlights a short position, targeting ~3,347 then ~3,318 levels (blue labels) as initial support zones.
Strong supply base: The extensive grey zone below marks a "stronger supply zone" — this could cap any modest bounce and keep the downtrend intact.
🔍 Interpretation:
Bias: Bearish — sellers have taken control after a failed breakout.
Strategy: Short on rallies toward the mid‑green/red box (~3,373–3,380), targeting ~3,347 first and then ~3,319. Watch for support at the strong supply region (~3,292) for potential reversal or consolidation.
Risk management: Keep stop above the red zone—above recent highs (~3,380+) to limit risk.
🚀 In a nutshell: After failing to break supply and losing its short‑term uptrend, gold appears poised for a pullback. The next key levels to watch are ~3,347 and ~3,319—where buyers might step back in, or the downtrend continues toward the deeper supply base.

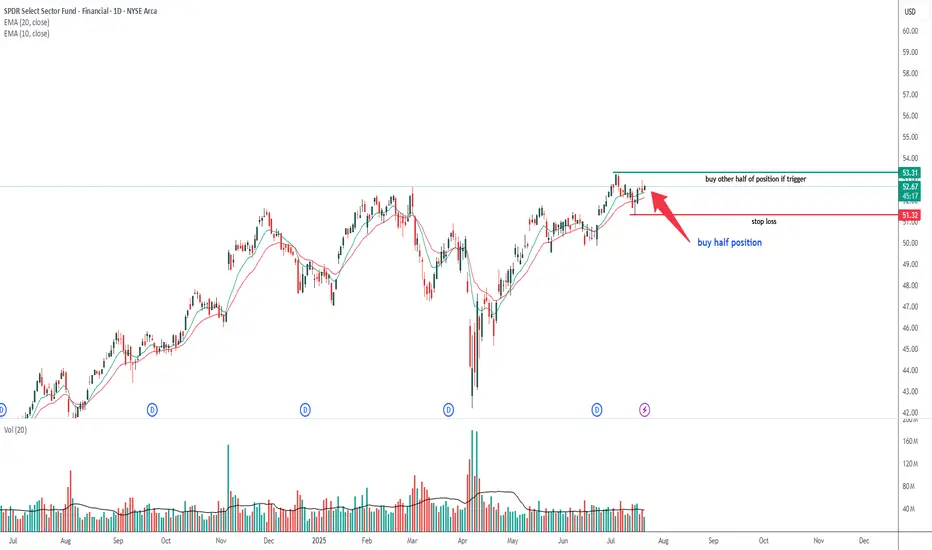
XLF -- Possible trade opportunityXLF -- Possible trade opportunity based of price, volume and chart pattern
The Loudmouth Pattern: It Yells, We Trade!
On the 30-minute chart, ETH is forming a classic Broadening Formation – or as some traders like to call it, “The Big Mouth Pattern” 😄. It’s noisy, unpredictable at first glance, but when it speaks, you’d better listen.
Right now, price is moving through the bullish leg of this setup, and if momentum holds, we’re eyeing the $4,000 psychological level, followed by the $4,120 – $4,170 supply zone.
🔹 Bullish Scenario (our expected outlook):
🎯 Target 1: $4,000
🟩 Main Resistance: $4,120 – $4,170
❌ Invalidation: Confirmed close below $2,946
If price breaks and holds below that red support zone, this setup gets thrown out the window.
📊 Risk Management:
Scale in on pullbacks – if structure remains valid
No chasing without confirmation
Keep risk under 1% of total capital
📈 The market’s big mouth is open – and until it closes below $2,946, we’re listening for bullish signals. 🤑

Gold (XAU/USD) Analysis:Gold remains in a downward trend and is currently moving sideways in a consolidation phase in the short term. The bearish outlook still dominates, with a potential move toward levels like $3,245.
1️⃣ A break and close below $3,276 may trigger a drop toward the strong support zone at $3,245.
2️⃣ However, if bullish momentum pushes the price above $3,310, this opens the path toward $3,330, a key level where a bearish rejection might occur.
📈 If the price holds above $3,330, a continuation toward $3,350 becomes likely.
⚠️ Disclaimer:
This analysis is not financial advice. It is recommended to monitor the markets and carefully analyze the data before making any investment decisions.

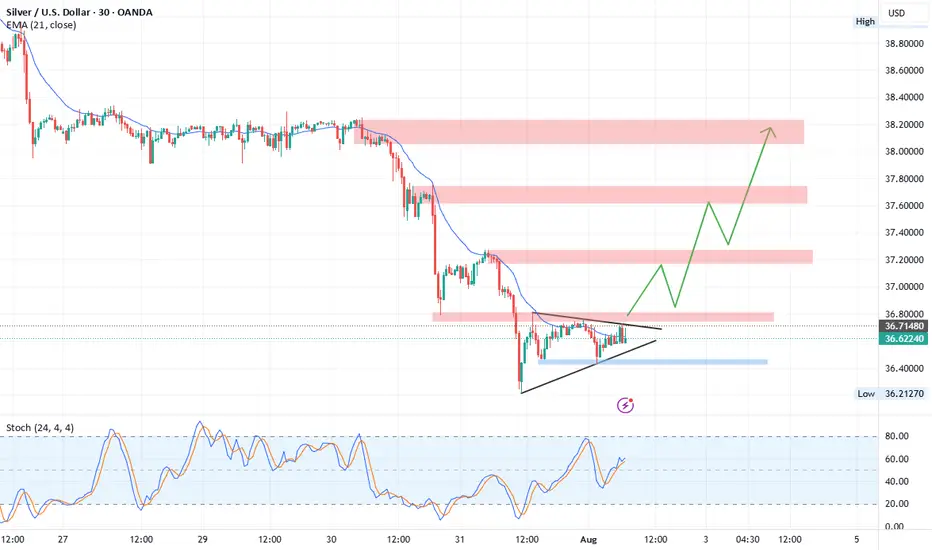
XAGUSD Technical Outlook (Silver/USD)Currently, Silver is trading inside a symmetrical triangle formation , signaling a potential breakout.
Upside Scenario:
A breakout above 36.80 resistance may trigger strong bullish momentum. The next target zone lies at 37.18 – 37.30, which is a relatively weak resistance and could potentially form a Head and Shoulders pattern . If momentum continues, Silver could extend gains toward 37.75 and 38.00 resistance levels.
Downside Scenario:
If the triangle breaks to the downside, we may see a short corrective move toward 3 6.25 – 36.20 support zone before any possible rebound.
Overall, the chart structure currently favors an upside breakout with continuation toward higher resistance zones.
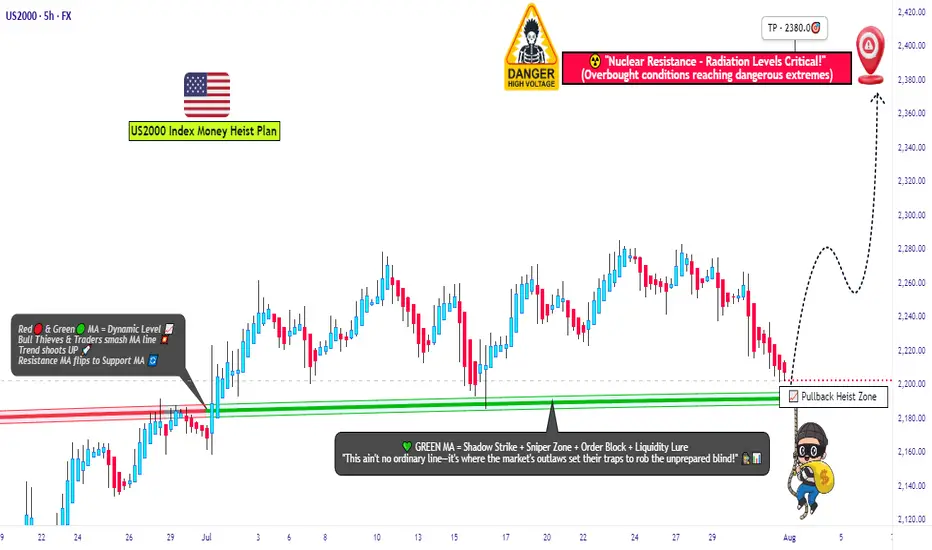
"US2000 THIEF TRADE: SWIPE & ESCAPE BEFORE BEARS!"🚨Russell 2000 Robbery: Pullback to Power Play⚡️💰
🌟Hi! Hola! Ola! Bonjour! Hallo! Marhaba!🌟
Dear Market Robbers & Money Makers, 🤑💰💸✈️
This is a full-blown heist plan on the US2000 (Russell 2000) index using the Thief Trading Style™, a perfect combo of real-time technicals + macro heat.
Get ready to swipe the bull run right after a tactical pullback — let’s rob the market clean and vanish at the high-voltage resistance level ⚡️🚨📊
📈 Entry Plan – The Vault Opens @ 2190.00
Watch for a clean pullback to the zone around 2190.00.
Place buy limit orders after confirmation from 15m or 30m candles – preferably near recent swing lows.
Smart move: Set alerts so you don’t miss the breakout trigger.
🛑 Stop Loss – Escape Hatch @ 2140.00
Use the nearest 4H candle wick or swing low as your SL level.
Thieves scale their lot size & SL based on position stacking and trade confidence.
🎯 Target – 2380.00 (Or Jump Before the Heat Gets Real)
Take profit near the heavy resistance zone. Don’t overstay — market traps ahead! Electric reversals & institutional bears wait there to flip the game ⚡🐻
👀 Scalpers’ Secret:
Only long scalps! 💣
No funds? Follow the swing robbers.
Trail your SL and let the bulls push your bags up.
🧠 What’s Fueling This Bullish Ride?
US2000 is surging with:
• Risk appetite from macro sentiment
• COT data aligning bullish
• Intermarket signals syncing up
• Rotational flows into small-cap strength
⚠️ Thief Trading Alerts – News Impact Zone Incoming!
• Don’t enter fresh trades during red news.
• Use trailing SLs to guard floating profits.
Market spikes are good — if you’re prepared.
💣💥This isn’t just a trade – it’s a mission.
Rob smart, trail hard, and cash out sharp.
📦💼Every move is calculated. Every entry is a chance.
🚀Stay sharp, robbers – next heist plan drops soon! 💼🔐📈
🏆Trade like a thief, win like a boss.
Bitcoin Has Bearish DivergenceOverbought bearish divergence.
I pointed this out last week. In my mind, this is the most reliable signal for tops (bullish divergence for bottoms) that exists in technical analysis. We can see that this continues to play out, and know that it usually leads to RSI making the trip to oversold.
It looks like more correction is likely, standard fare in a bull market.

Gold long from 3295I think this might be the bottom .
Next week gold will be sitting at 3400$ level.
Silver coiling price action support at 3600The Silver remains in a bullish trend, with recent price action showing signs of a continuation breakout within the broader uptrend.
Support Zone: 3600 – a key level from the previous consolidation. Price is currently testing or approaching this level.
A bullish rebound from 3600 would confirm ongoing upside momentum, with potential targets at:
3756 – initial resistance
3855 – psychological and structural level
3915 – extended resistance on the longer-term chart
Bearish Scenario:
A confirmed break and daily close below 3600 would weaken the bullish outlook and suggest deeper downside risk toward:
3544 – minor support
3480 – stronger support and potential demand zone
Outlook:
Bullish bias remains intact while the Silver holds above 3600. A sustained break below this level could shift momentum to the downside in the short term.
This communication is for informational purposes only and should not be viewed as any form of recommendation as to a particular course of action or as investment advice. It is not intended as an offer or solicitation for the purchase or sale of any financial instrument or as an official confirmation of any transaction. Opinions, estimates and assumptions expressed herein are made as of the date of this communication and are subject to change without notice. This communication has been prepared based upon information, including market prices, data and other information, believed to be reliable; however, Trade Nation does not warrant its completeness or accuracy. All market prices and market data contained in or attached to this communication are indicative and subject to change without notice.

gold 4ooo projectionHello, me thinks gold is ready for a midterm correction, which in turn can propel it to 4ooo. This is just an idea, not financial advice. Cheers

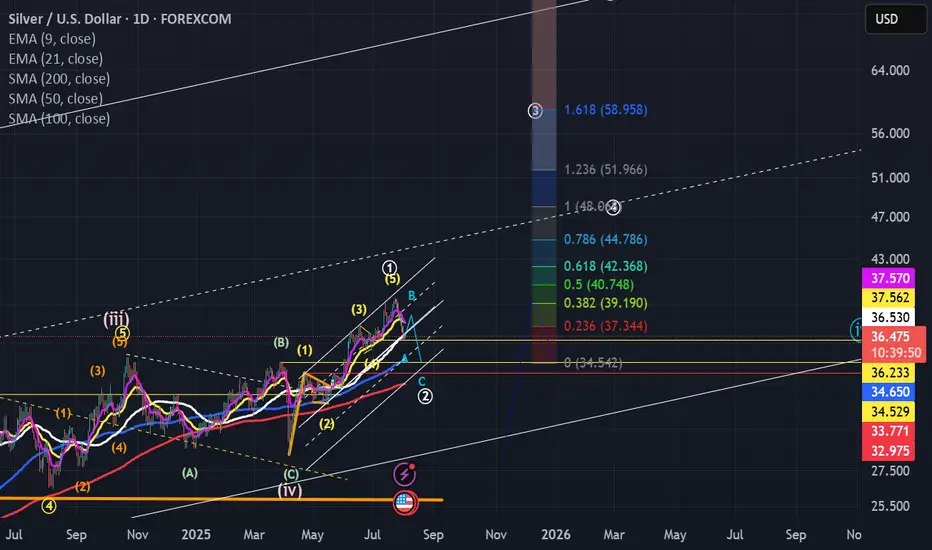
My alternate wave count for silverBelow is a slighly altered wave count for silver...it shows we have completed wave 5(yellow) which is a wave 1 (white) and are now in the process of working out wave 2 (white)...the first leg down (a) has just completed...and wave b of the ABC should start and complete over the next few days...follwed by one more low (wave c)...around the $34-$34.50 area.
I do not expect a move below $34 due to all the support on the chart at this level (look left and you will see that the $34 was a major prior resistance zone...when resistance is broken it becomes support.
If this count is the correct one (again it is my alternate to the one posted previously), it meas a bit more patience is required over the next few weeks...before we see a major move up (above $50) will start.
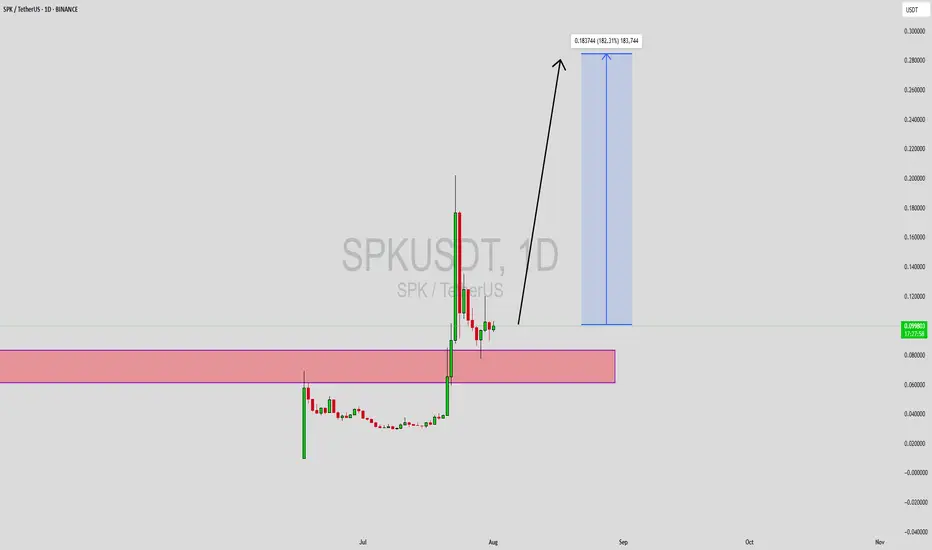
SPKUSDT Forming Bullish ReversalSPKUSDT is currently showing signs of a strong bullish reversal pattern, positioning itself as one of the most technically attractive altcoins on the radar. After an extended downtrend, the price has found solid support at a key demand zone, which has historically acted as a base for significant rallies. The latest price action has formed a clear reversal structure, signaling a potential shift in momentum from sellers to buyers. This early signal of trend reversal is supported by increasing volume, indicating strong accumulation at lower levels.
This setup is gaining traction among traders and crypto investors who are beginning to take interest in SPK due to its attractive risk-to-reward ratio and potential for explosive gains. The expected move targets a 140% to 150% upside, which aligns with previous recovery waves observed in similar patterns. Technical indicators such as the RSI and MACD may also begin to align in favor of bulls, further supporting the thesis for a major trend reversal. This gives traders the confidence to anticipate a breakout rally in the coming weeks.
The fundamentals behind SPKUSDT are also gaining visibility, as the project's roadmap and utility continue to attract community attention. In the current market cycle, low-cap and mid-cap assets that show early reversal signs often outperform during recovery phases. With growing investor interest and a chart that supports a major move, SPKUSDT is a pair that deserves close monitoring. The breakout confirmation above recent resistance levels could act as a strong signal for the next upward leg.
This is a prime opportunity for swing and mid-term traders to take advantage of a potentially explosive move. With volume building and sentiment improving, SPKUSDT could be setting up for a rally that outpaces many other altcoins in the same category.
✅ Show your support by hitting the like button and
✅ Leaving a comment below! (What is You opinion about this Coin)
Your feedback and engagement keep me inspired to share more insightful market analysis with you!
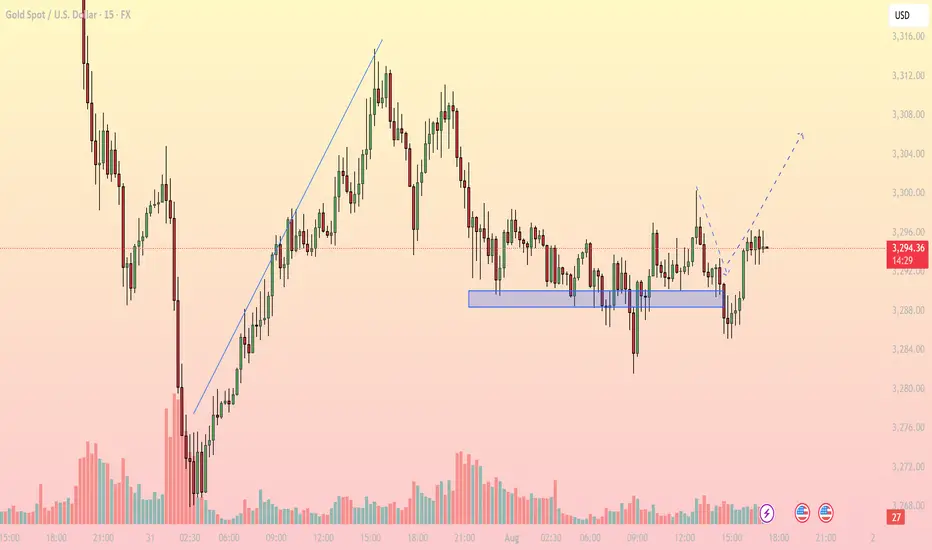
Bullish Rejection from Support, Upside in FocusMarket Overview: On the M15 timeframe, XAUUSD shows signs of a short-term bullish reversal after a prolonged sideways range around the key support zone of 3,286 – 3,289 USD. Price faked out below this support but quickly recovered, forming a V-shape reversal, suggesting strong buying interest has returned.
Key Levels to Watch:
Support Zones:
- 3,286 – 3,289: Strong intraday support, tested multiple times with sharp rejections
- 3,274: Next significant support if the above zone fails
Resistance Zones:
- 3,300 – 3,304: First resistance target aligned with the recent high
- 3,308 – 3,312: Higher resistance area where supply may emerge
Technical Indicators:
EMA: Price has reclaimed the short-term EMAs, indicating bullish momentum on lower timeframes
RSI: Rising above 50 but not yet overbought – there’s room for further upside
Volume: Increasing volume during the bounce confirms buying strength
Trading Strategy:
- Bullish Scenario (Preferred): Entry Zone: Watch for pullback toward 3,290 – 3,292
Stop Loss: Below 3,285
Take Profit 1: 3,300
Take Profit 2: 3,304
Extended Target: 3,308 – 3,312 (if bullish momentum continues beyond breakout zone)
- Bearish Scenario (Alternate): Only valid if price breaks and closes strongly below 3,286
Short Target: 3,274 – 3,270
Note: Counter-trend strategy – higher risk, requires strong confirmation
Conclusion: Gold is showing a bullish price structure on the 15-minute chart. As long as price holds above the 3,286 – 3,289 support zone, the path of least resistance appears to be upward, with 3,300 and 3,304 as the next logical targets. Monitor price action closely during the U.S. session for a potential long setup.
- Follow for more real-time gold trading strategies and save this idea if you find it helpful!
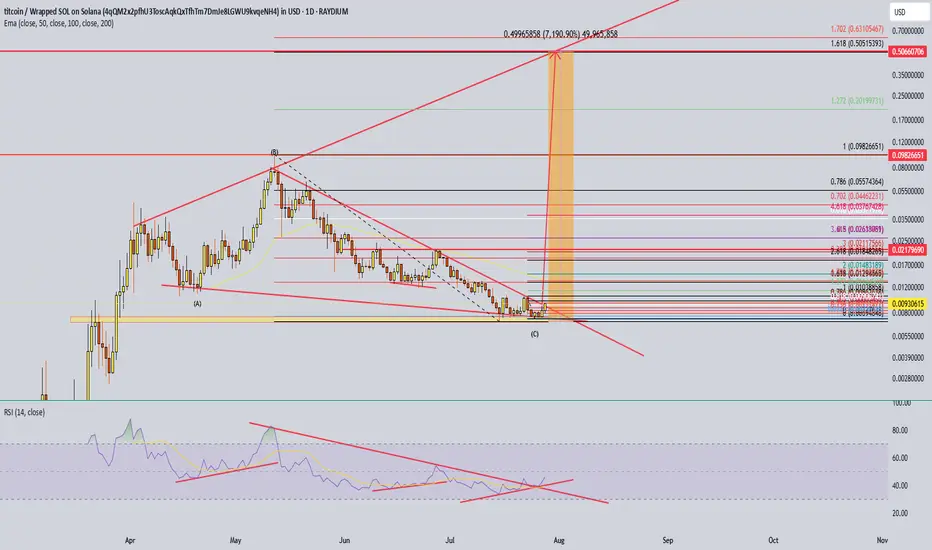
Very Bullish!!
Solana chart looks very bullish. The price is currently dropping but I think it is a very healthy correction.
Weekly chart:
1) all momentum indicators just entered the bull zone.
2) The chart is forming higher highs.
Daily:
1) EMA55 finally crossed EMA200. The last time they crossed was October 2023 (see red vertical line in the chart) and it was the beginning of the macro bull trend.
2) Momentum indicators have reached overbought territory and crossed to the downside, however, given weekly momentum indicators have just entered the bull zone, this move is likely to be corrective action.
3) When EMA55 and EMA200 cross, the price often retraces initially to EMAs (21, 55 or 200). Once it completes the pull back, I anticipate the price to move to the previous ATH and beyond.
This is the time when high leverage trading volume increases.
Be careful not get wicked out. Focus on monthly/weekly/daily charts and ignore the noise in the lower timeframes.

The Curtain Falls on the Script: Why I Believe It's Time to StopHello everyone, this is EC.
From late June through July, we experienced a full-fledged primary uptrend in crypto, driven by a weakening U.S. Dollar. From the script preview to the execution of the plan, every step has been clearly documented.
However, today, I want to share a different, more cautious perspective: I believe this script may be nearing its end.
I. Reviewing the Script and the "Bubble's" Manifestation
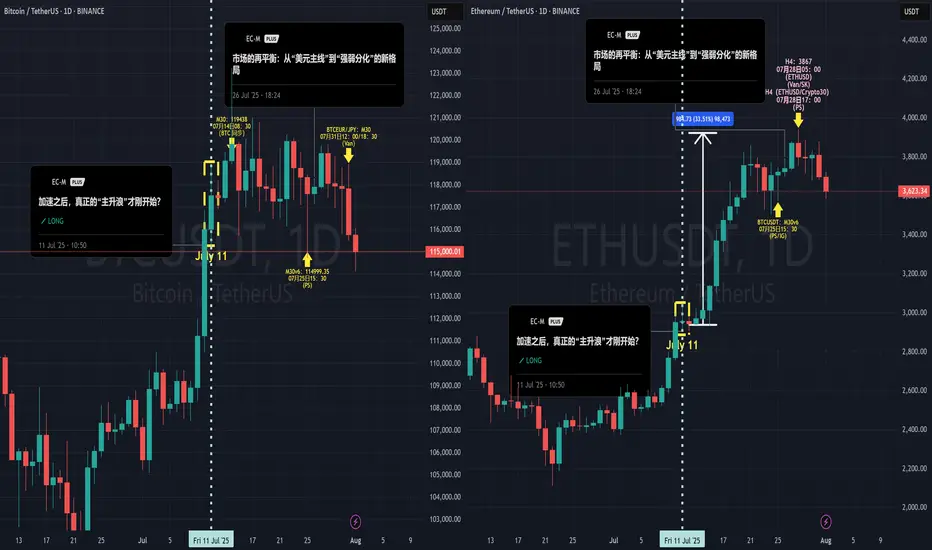
After our call on July 4th that the "main bull wave" was starting, the market perfectly delivered on our expectations. What was more interesting was the clear internal divergence we saw, which precisely confirms our thesis about the "bubble phase" from my June 20th article, "The Restlessness Before the Storm."
When the market's sentiment "balloon" is inflated to its limit, capital flows from the leader (BTC) to assets with higher elasticity (ETH).
The data shows that from July 11th until now, ETH took the baton and rallied approximately 35%, while BTC gained only around 6% in the same period. When BTC is already showing signs of fatigue while ETH is still in a solo rally, that in itself is a major signal that the bubble is nearing its end.
II. A Shift in the Winds: The Hand Inflating the Balloon is Loosening
I've chosen to end this script at this moment based on signal changes on two levels:
The "External Factor" Shift: The Potential Strengthening of the USD
As I pointed out in my July 28th analysis, "The Market's Rebalancing," the market has entered a phase of "strength-weakness divergence." This trend is now becoming more evident: the U.S. Dollar, cushioned by the extreme weakness of currencies like the Japanese Yen, has begun to show signs of a broad strengthening. Concurrently, U.S. and European stock markets are pulling back in sync, and global risk appetite is cooling.
The external environment that fueled the bubble (a weak USD) is beginning to falter.
The "Internal Factor" Signal: The Needle Point Inside the Balloon
The crypto market itself is also showing warning signs of resistance (see attached ETH daily chart). When the leading asset, ETH, begins to show signs of stagnation and distribution at its highs, it's like the balloon meeting the needle point. The exhaustion of internal momentum is a more direct warning than changes in the external environment.
III. Conclusion: Don't Be Greedy for the Last Dessert
When the core logic driving the rally (a weak USD) begins to waver, and the market simultaneously shows internal signs of exhaustion, my choice is to end this script and take profits off the table.
This doesn't mean I think crypto will crash immediately. But "no longer suitable to hold" implies that, in my view, the risk/reward ratio at the current level is no longer attractive. A grand feast is coming to an end, and being greedy for the last dessert is not a wise move. Shifting from "buying the dip" to "cautious observation" is the rational choice.
Thank you for your attention and for following along this past month.
#Crypto #BTC #ETH #TradingView #MarketAnalysis #RiskManagement
XRPUSD downside target 2.656On the daily chart, XRPUSD has retreated from its highs, with short-term bears dominating. Currently, the price is in a downward trend, so shorting near the downtrend line resistance is recommended, with a target around 2.656.

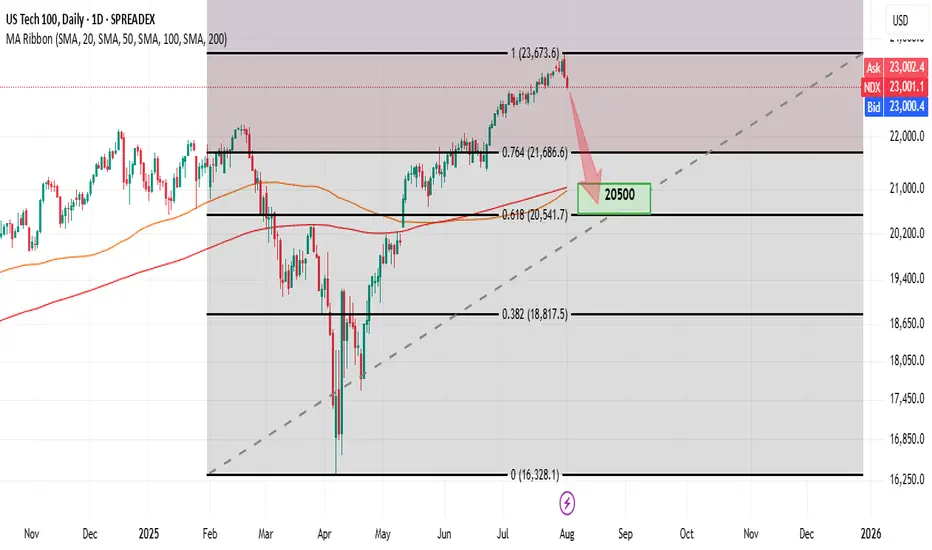
NDX – Double Top & Divergence (H4, D FRL Setup)Hello friends! It's time for our beloved Nasdaq index to cool down. I expect a correction amid the strengthening of the dollar.
H4: clear Double Top forming near 23,000.
Daily: bearish MACD divergence confirms momentum shift.
📐 FRL (H4): neckline at 23,000, perfectly aligned with 100 SMA on H4.
🎯 Target: 0.618 Fib retracement at 20,500 – confluence with 100 & 200 SMA on Daily and strong horizontal support.