Trend Analysis

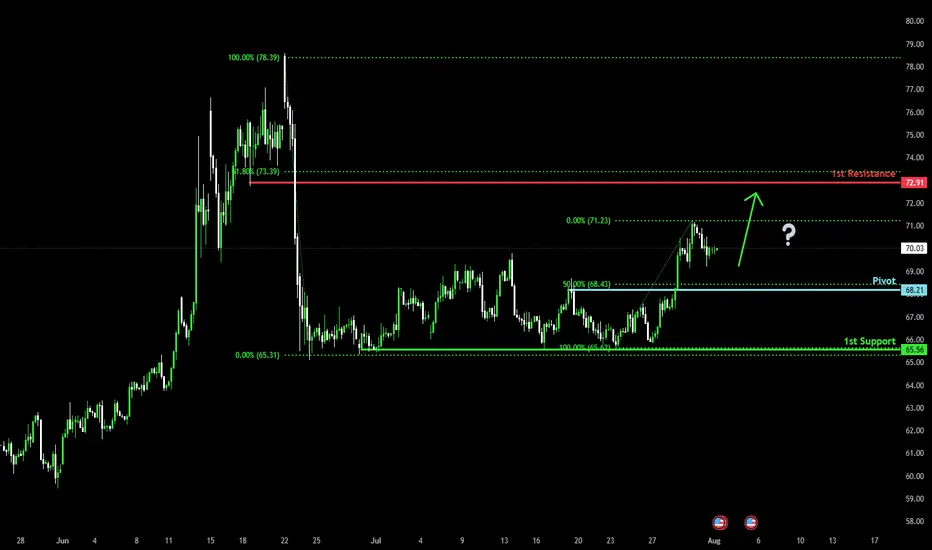
Falling towards 50% Fibonacci support?WTI Oil (XTI/USD) is falling towards the pivot, which has been identified as a pullback support and could bounce to the 1st resistance.
Pivot: 68.21
1st Support: 65.56
1st Resistance: 72.91
Risk Warning:
Trading Forex and CFDs carries a high level of risk to your capital and you should only trade with money you can afford to lose. Trading Forex and CFDs may not be suitable for all investors, so please ensure that you fully understand the risks involved and seek independent advice if necessary.
Disclaimer:
The above opinions given constitute general market commentary, and do not constitute the opinion or advice of IC Markets or any form of personal or investment advice.
Any opinions, news, research, analyses, prices, other information, or links to third-party sites contained on this website are provided on an "as-is" basis, are intended only to be informative, is not an advice nor a recommendation, nor research, or a record of our trading prices, or an offer of, or solicitation for a transaction in any financial instrument and thus should not be treated as such. The information provided does not involve any specific investment objectives, financial situation and needs of any specific person who may receive it. Please be aware, that past performance is not a reliable indicator of future performance and/or results. Past Performance or Forward-looking scenarios based upon the reasonable beliefs of the third-party provider are not a guarantee of future performance. Actual results may differ materially from those anticipated in forward-looking or past performance statements. IC Markets makes no representation or warranty and assumes no liability as to the accuracy or completeness of the information provided, nor any loss arising from any investment based on a recommendation, forecast or any information supplied by any third-party.
GBPUSD Will Go Down!
HI,Traders !
#GBPUSD keeps falling down
And broke the
Key wide horizontal level
Around 1.33938 which is now
A resistance and the breakout
Is confirmed so we are very
Bearish biased and we will
Be expecting a bearish
Continuation !
Comment and subscribe to help us grow !

RUNE at the Brink: Rebound Opportunity or Breakdown Incoming?🧩 Overview:
RUNE/USDT is currently hovering at a critical support zone — a historical demand area that has triggered strong bullish rallies in the past. Positioned between $1.00–$1.30, this level has been a battle ground between buyers and sellers. The big question now: Will RUNE bounce for a bullish reversal or break down into deeper lows?
---
🔍 Key Levels Identified:
Major Support Zone (Demand Area): $1.00 – $1.30 (yellow box)
Immediate Resistance: $1.95 → $3.11 → $4.92
Extended Bullish Targets: $6.87 → $9.09 → $11.48 → $15.02
Deeper Bearish Targets (if support fails): $0.80 → $0.55 → $0.32
---
🟢 Bullish Scenario (Recovery Rally):
📌 Key Signal: Strong hold and price reaction above the $1.00–$1.30 zone.
1. Reversal Patterns: Look for double bottom, bullish engulfing, or strong weekly pin bars to signal a potential reversal.
2. Momentum Confirmation: A breakout above $1.95 with high volume could trigger a strong continuation to $3.11 and $4.92.
3. Macro Tailwinds: A broader recovery in Bitcoin and the crypto market could enhance bullish pressure on altcoins like RUNE.
🎯 Mid to Long-Term Bullish Targets:
$3.11 → $4.92 → $6.87+
Potential upside of 200–400%+ from current levels if bullish structure confirms.
---
🔴 Bearish Scenario (Breakdown):
📌 Critical Risk: Weekly candle close below $1.00 with volume confirmation.
1. Support Breakdown: If $1.00 fails, price may revisit previous lows around $0.80 or even test historical demand levels at $0.32.
2. Bearish Continuation Pattern: Sustained lower highs and lower lows suggest downtrend continuation unless invalidated.
3. Volume Pressure: Heavy sell volume on breakdowns reinforces bearish bias.
⚠️ Bearish Targets: $0.80 → $0.55 → $0.322 (historical low)
---
🔄 Pattern & Structure:
Historical Accumulation Zone: The yellow box has been a long-term accumulation area since 2021.
Repeat Behavior: Previous touches to this zone sparked multi-week rallies.
Potential Wyckoff Accumulation: If price forms a sideways range with rising lows, this may be the early stage of a markup phase.
---
🧠 Strategic Outlook for Traders:
✅ Bullish Strategy:
Conservative entry: Wait for breakout + retest of $1.95
Aggressive entry: Accumulate within $1.00–$1.30 zone with tight stop below $0.98
❌ Bearish Strategy:
Short setup on confirmed breakdown below $0.98
Avoid trading without confirmation of direction (no FOMO)
---
🚀 Conclusion:
RUNE is standing at a make-or-break level — a tipping point between a bullish breakout or further bearish pressure. Smart traders don't just predict direction; they prepare for both outcomes. This is not just a technical zone — it's the market’s decision point.
#RUNE #RUNEUSDT #CryptoAnalysis #AltcoinWatch #BreakoutSetup #DemandZone #TechnicalAnalysis #CryptoOutlook #BullishScenario #BearishScenario #Wyckoff

Chainlink (LINKUSDT) has shown strong bullish momentumKey Points
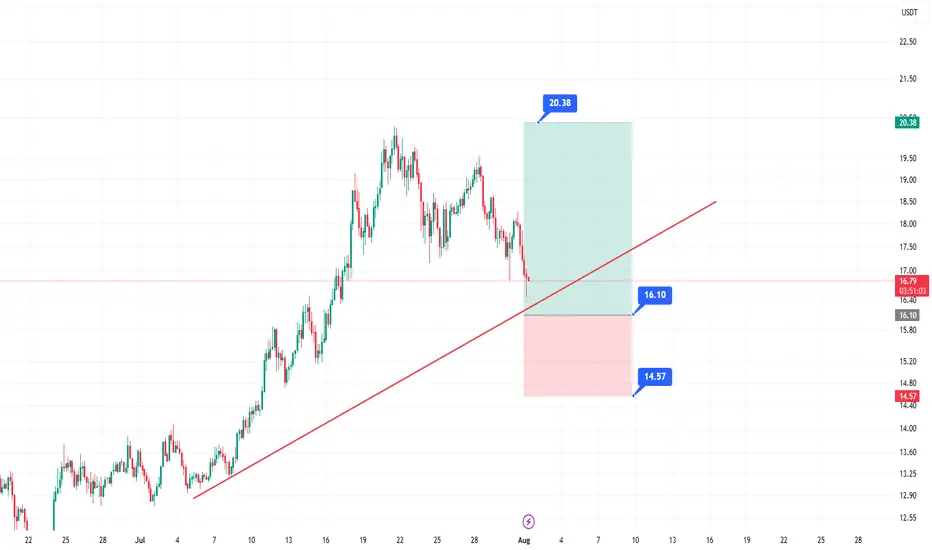
It seems likely that a long entry for LINKUSDT at $15.70–$16.10 using a limit order is a valid strategy, given recent bullish trends and technical support levels.
The take profit at $20.38 and stop loss at $14.57 suggest a favorable risk-reward ratio, but market volatility could affect outcomes.
Research suggests waiting for a pullback to the entry range, as the current price ($16.86) is slightly above it.
Market Context
Chainlink (LINKUSDT) has shown strong bullish momentum, rallying from $11.45 to $19.66 earlier in 2025, and is currently consolidating. The $15.70–$16.10 entry range aligns with key technical levels, including a 0.618 Fibonacci retracement and the 20-period EMA on the 4H chart, making it a potential support zone for a long entry.
Trade Plan
Entry: Use a limit order between $15.70 and $16.10, splitting entries for better average price.
Take Profit: Aim for $20.38, offering a significant upside potential.
Stop Loss: Set at $14.57 to manage risk, ensuring a clear invalidation level.
Risk Management: Risk 1–2% of your account, adjusting position size based on the stop distance.
Considerations
Given the current price is $16.86, you may need to wait for a pullback to enter at the desired range. Monitor Bitcoin’s price action, as it can influence altcoins like LINKUSDT. Always do your own research, as crypto markets are highly volatile.
Survey Note: Detailed Analysis of LINKUSDT Long Entry Strategy
This survey note provides a comprehensive analysis of the proposed LINKUSDT long entry strategy, incorporating your specified parameters (entry at $15.70–$16.10, take profit at $20.38, and stop loss at $14.57) and recent market data as of 09:31 AM +0530 on Friday, August 01, 2025. The goal is to create a detailed trading idea suitable for publishing on TradingView, with technical analysis, risk management, and community engagement considerations.
Market Overview and Recent Price Action
Chainlink (LINKUSDT) has demonstrated significant bullish momentum throughout 2025, breaking out of a multi-month descending channel and rallying from a low of $11.45 to a high of $19.66. As of today, the current price is $16.86 USD, based on the most reliable price data available. This price reflects a pullback from recent highs, suggesting a consolidation phase after a 58% rally, which is typical for healthy trend continuation.
Recent analyses on TradingView and X posts indicate a bullish outlook, with several traders targeting levels above $20, supported by strong fundamentals such as Chainlink’s role as a leading DeFi oracle. For instance, an X post from @cryptoolivee on July 29, 2025, suggested that if $17 holds, targets could reach $22.50–$30.60, while another from @Solfishsoul highlighted a descending wedge breakout with a potential target above $20, backed by RSI crossing 50 and volume spikes.
However, the current price of $16.86 is slightly above your proposed entry range of $15.70–$16.10, which may require waiting for a pullback or adjusting the strategy. Given Bitcoin’s price above $95,000, altcoin strength is supported, but monitor BTC dominance for potential impacts on LINKUSDT.
Technical Analysis
To justify the entry range and targets, let’s break down the technical setup:
Price Action and Structure:
On the 4H and 1D charts, LINKUSDT is forming higher highs and higher lows, confirming a bullish trend. The pullback to $15.70–$16.10 aligns with:
A 0.618 Fibonacci retracement level from the $11.45 low to $19.66 high, a common reversal zone.
A previous resistance-turned-support zone around $16.00, based on historical price action.
The 20-period EMA on the 4H chart, acting as dynamic support, which recent analyses on TradingView confirm as a key level.
Key Levels:
Support Zone: $15.70–$16.10, with stacked confluence from Fib, prior structure, and EMA.
Resistance Targets:
T1: $17.50 (recent consolidation low, +9% from entry).
T2: $19.80 (prior high, +23% from entry).
T3: $21.00 (channel breakout target, +31% from entry).
Your specified take profit at $20.38 fits within this bullish range, offering a significant upside potential.
Invalidation: A 4H close below $15.20 signals a potential trend reversal, but your stop loss at $14.57 provides a wider buffer, which is prudent given crypto volatility.
Indicators:
RSI (4H): Currently at 58, indicating bullish momentum without being overbought, with room for upside before reaching 70.
Volume: Recent breakouts ($15–$17 and $19) showed increasing volume, suggesting strong buying interest. The current pullback shows lower volume, typical of a healthy retracement, as noted in TradingView analyses.
MACD (4H): Bullish crossover intact, with the histogram showing slight weakening but no bearish divergence, supporting the setup.
Market Context and Sentiment:
TradingView’s technical ratings as of today show a neutral signal, but a buy signal for 1 week and a strong buy for 1 month, aligning with the bullish sentiment. Volatility is 3.28% today, with a 24-hour change of -0.11%, -2.70% for 1 week, but +32.31% for 1 month and +32.37% for 1 year, indicating strong longer-term momentum.
X posts, such as one from @Arvintd on July 25, 2025, suggest long entries at $17.150–$17.600 with targets up to $19.650, slightly above your range but supportive of bullish moves. Another from @2gentledude echoed similar levels, using 50x leverage, though caution is advised for such high leverage.
Trade Plan and Execution
Given your parameters, here’s how to structure the trade for TradingView publication:
Setup: Long LINKUSDT with a limit order in the $15.70–$16.10 range.
Entry Zone: Place limit orders between $15.70 and $16.10, splitting entries for better average price to manage slippage.
Take Profit Targets:
Your specified TP at $20.38 can be the primary target, offering a significant upside. For scaling, consider:
T1: $17.50 (50% position, R:R 2.5:1).
T2: $19.80 (30% position, R:R 5:1).
T3: $21.00 (20% position, R:R 6.5:1), given the bullish targets in analyses.
Stop Loss: Set at $14.57, as specified, which is below the $15.20 invalidation level, providing a wider buffer for volatility.
Risk Management:
Risk 1–2% of your account per trade, adjusting position size based on the stop distance (from $15.90 average entry to $14.57 SL, ~8.5% risk, so size accordingly).
Use spot or low leverage (3–5x) to manage risk, as futures trading amplifies losses, especially given recent X posts suggesting 50x leverage, which is high risk.
Trade Duration: Expected 3–10 days, depending on momentum and BTC price action.
Execution Notes:
Wait for price to enter the $15.70–$16.10 zone and show bullish confirmation, such as a 1H bullish candle, RSI bounce, or volume increase, to ensure entry at support.
Avoid chasing if price breaks above $16.50 without testing the entry zone, as it may indicate a stronger upward move bypassing your range.
Risk Assessment and Considerations
Crypto markets are highly volatile, and several factors could impact this setup:
A Bitcoin drop could drag LINK below $15.20, potentially hitting your SL at $14.57. Monitor BTC dominance and LINK/BTC pair for correlations.
False breakouts are possible; if $15.70 fails to hold, price may test lower supports like $14.00–$14.20, as noted in some TradingView analyses.
Given the current price of $16.86, you may need to wait for a pullback, which could take time or not occur, adding uncertainty. Adjust expectations if the market continues upward.
Community Engagement and Publishing Notes
To maximize engagement on TradingView:
Chart Setup: Attach a 4H or 1D chart with:
Marked entry zone ($15.70–$16.10).
Fibonacci retracement levels (0.618 at ~$16.00).
20 EMA on 4H.
Support/resistance zones ($17.50, $19.80, $21.00).
Stop loss level ($14.57, as specified).
Tags: #LINKUSDT #Chainlink #CryptoTrading #BullishSetup #TechnicalAnalysis #Altcoins
Visibility: Set to public for maximum reach.
Engagement: Encourage comments, such as “What’s your take on LINKUSDT? Are you bullish or waiting for a deeper dip? Drop a comment below, and let’s discuss!” and respond to feedback to build credibility.
Summary Table of Key Levels and Targets
Level/Type
Price (USD)
Description
Entry Range
15.70–16.10
Limit order zone, Fib and EMA support
Take Profit (TP)
20.38
Primary target, aligns with bullish targets
Stop Loss (SL)
14.57
Wide buffer below invalidation at $15.20
Support Levels
14.00–14.20
Potential lower test if entry fails
Resistance Targets
17.50, 19.80, 21.00
Scaling targets for partial profits
This table summarizes the critical levels for your trade, ensuring clarity for TradingView readers.
Disclaimer and Final Notes
Trading cryptocurrencies involves high risk, and you may lose more than your initial capital. Always use proper risk management and consult your financial advisor before trading. This idea is based on available data and analyses but is not financial advice—do your own research (DYOR).
Given the current price of $16.86, this setup may require patience for a pullback, but the technical confluence and bullish sentiment support its validity. Adjust as needed based on market developments.
Key Citations
Chainlink/Tether Price Chart Analysis
Recent LINKUSDT Trade Ideas
Chainlink Price and Chart Data
LINKUSDT Trading Idea from Arvintd
LINKUSDT Monthly Analysis from cryptoolivee
LINKUSDT Breakout Analysis from Solfishsoul
LINKUSDT Long Idea from 2gentledude
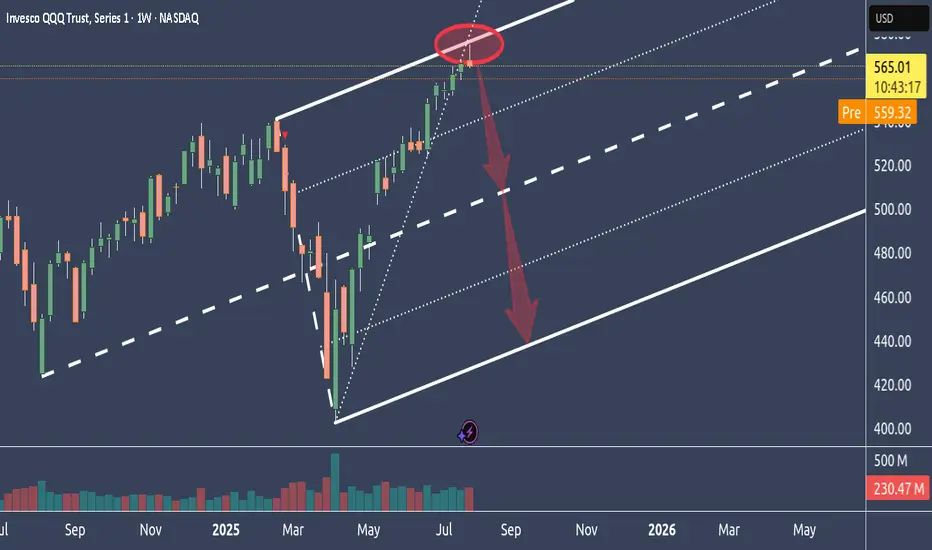
Why NQ is probably tanking big timeIn this weekly chart, we see QQQ, which represents the Nasdaq.
As we can see, it had a hell of a run up.
Too far too fast IMO, and it reached the stretch level at the Upper Medianline Parallel.
The natural move is now to let go, take a breath and trade down to center again, which is the Centerline.
After all the most major and most important earnings results are over, and Funds have pumped up their gains through manipulative Options plays, it's time to reap what they have planted and book the gains.
It's all in line with, all moves are at the point, and everything is showing in a simple chart.
Unless price is opening and closing outside of the U-MLH, it's time to load the Boat and sail to the South.
ETHUSDT.PIf you look at the chart, you will notice an uptrend that has somewhat lost its strength and we may not be able to hit higher highs like the next strength in the next move.
Support: 3.660 - 3.590 - 3.160
Resistance: 3.900 - 4.260
Entry: 3.700
SL: 3.500
TP: 4.240
Please control risk management.⚠️

EURUSD First of August The information and publications are not meant to be, and do not constitute, financial, investment, trading, or other types of advice or recommendations.
Have a nice w/e ahead.

Fibonacci Retrace Strategy NAS100 Trade Idea📈 NASDAQ 100 (NAS100) is holding a strong bullish trend 🚀. After a weekend gap-up 🕳️➡️📈, price retraced back into the gap zone—exactly what you'd expect in a healthy trending market.
🔍 I'm applying my Fibonacci Expansion + Retrace Strategy 🔢, watching closely for a pullback into equilibrium ⚖️ within the previous price swing. That’s where I’ll be waiting for a bullish market structure break 🔓📊 to confirm my long bias.
🧠 Patience is key here—let the setup come to you.
📌 As always, this is not financial advice!

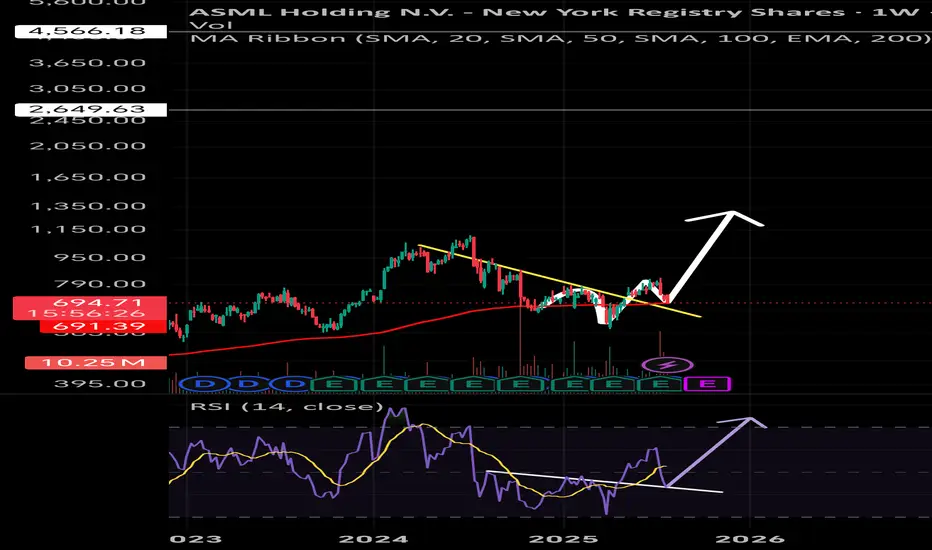
ASML : All inASML currently retesting the 200 weekly EMA support trendline.
Expecting ,Bullish trend reversal structure,
Ladt night already positioned heavily in this stock,
Pray this will play out as planned
😬🙏🙏😬
How I’m Trading the EURJPY Break of Structure Setup📈 EURJPY Analysis Update 🔍
I'm currently watching EURJPY closely. On the weekly timeframe, the pair is clearly in a strong bullish trend 🚀. Price has recently tapped into a previous daily bullish order block 🧱 — a key zone of interest.
Now, I’m watching for a break of structure (BoS) 📉 followed by a bullish continuation, especially if price pulls back into the fair value gap (FVG) 📊 near the current low.
As always, this setup — along with all key details and trade considerations — is fully broken down in the 🎥 video.
⚠️ This is for educational purposes only and not financial advice.

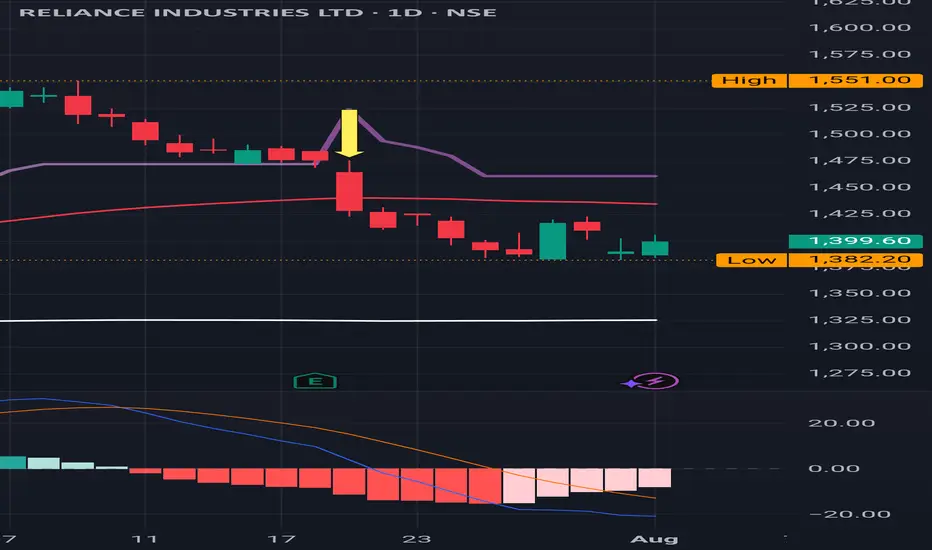
REL : Sitting at an important support level of 1400 ish.
REL : Sitting at an important support level of 1400 ish.
( Not a Buy / Sell Recommendation
Do your own due diligence ,Market is subject to risks, This is my own view and for learning only .)
GBPJPY pullback for another bullish moveDaily candle closed with strong bullish.
A healthy pullback observed during Asian session.
I'm waiting at marking area for buy entry.
Calculate your own risk & reward.
Good Luck

SEI/USDT at a Critical Level Golden Pocket Reaction Will Define?🔍 Technical Analysis:
1. Market Structure:
SEI/USDT is in a recovery phase after a significant downtrend.
Price is currently testing a crucial area between the Fibonacci retracement levels of 0.5 (0.2778) and 0.618 (0.2515) — known as the Golden Pocket Zone.
2. Key Support & Resistance Levels:
Strong support lies within the highlighted yellow zone (0.2515 – 0.2778), a historical support-resistance flip level.
Key resistance levels to watch:
🔸 0.3521
🔸 0.4715
🔸 0.5936
🔸 0.7025
🔸 0.9407
🔸 1.1361
---
📈 Bullish Scenario:
If price holds above the golden pocket:
A strong rebound is likely, forming a higher low structure.
Bullish confirmation occurs if price breaks and closes above 0.3521 with strong volume.
Upside targets: 0.4715 → 0.5936 → 0.7025 in sequence.
🔹 Additional Confirmation: Bullish reversal patterns (e.g., bullish engulfing or pinbar) around 0.25–0.28 would strengthen the bullish outlook.
---
📉 Bearish Scenario:
If the price breaks below the 0.2515 level:
It could trigger a deeper move toward 0.22 – 0.18 support area.
Further breakdown may bring price below the psychological level of 0.15.
🔻 Bearish confirmation if the price gets rejected from the 0.30–0.35 region with strong bearish candles.
---
📊 Pattern Insight:
Potential Double Bottom formation near the golden pocket zone.
A break above the 0.3521 neckline would validate this bullish reversal pattern.
---
🔖 Conclusion:
This zone (0.25–0.28) is a make-or-break area for SEI. A strong reaction from this golden pocket will determine whether SEI is ready to rally further or fall to new lows.
#SEI #SEIUSDT #CryptoAnalysis #AltcoinUpdate #TechnicalAnalysis #Fibonacci #SupportResistance #GoldenPocket #CryptoTrading #SEIpriceprediction

$SOL Loses Key Support | Eyes on $140 & $95 Zones📉 CRYPTOCAP:SOL Loses Key Support | Eyes on $140 & $95 Zones
🕵️♂️ On the daily timeframe, #Solana has officially lost its key support near $140, which previously acted as a strong bounce zone. A failure to reclaim this level could open the gates for a deeper drop toward the $95–$100 support range.
📊 Indicators signal downside:
RSI is trending downward
MACD shows a bearish crossover
Stochastic RSI confirms continued selling pressure
⚠️ Macro pressure adds fuel to the fire: August 1st tariff tensions, with expected news from Trump on charging Paris, are weighing down global risk assets. Historically, August tends to be a bearish month for crypto markets.
🎯 Key Levels to Watch:
Immediate Resistance: $140
Major Support: $95–$100
🧠 Trade wisely and manage risk accordingly.

DOGE (Y25.P3.E1). More lows to come before a longHi traders,
My thoughts on taking a short trade on Doge
why?
confluence on … 200 D ema, Avwap , previous support, etc
All the best,
S.SAri.

GBP weakness + USD gaining bullish momentumFX:GBPUSD 🧠 What’s Driving GBP Weakness?
❄️ Cooling Inflation: Slows BoE policy tightening
🔻 Contracting Manufacturing: PMI deep in the red
🛍️ Falling Retail Sales: UK consumers are pulling back
💼 Labor Market Cracking: Recent jobs data may be peak
💣 BoE Dovish Pivot Incoming: Markets are anticipating future cuts in 2025
🇺🇸 USD Strength: Fed holding steady, US macro much stronger than UK
🧭 Extra Confluence: USD Strength
USD is being supported by:
Strong US labor market 🟢
Higher for longer Fed 🟢
Global risk-off sentiment 🟢
Positive divergence in US CPI and Retail Sales 🟢
📌 GBPUSD is not just a GBP short — it’s a USD long play too.
🧩 Historical Price Action Pattern
In 2023 Q3, GBP/USD dropped nearly 700 pips in 6 weeks during similar macro shifts — soft BoE + strong USD.
We may be setting up for a repeat pattern now.
🗣️ What’s Your Take?
Are you looking to short GBP/USD this month?
Where’s your target or trigger zone?
Let’s compare setups ⤵️
I’m sharing more breakdowns weekly — follow for macro + technical convergence trades.

GBPJPY Fundamentally Bearish🧠 Macro-Fundamental Breakdown
🇬🇧 GBP (British Pound)
🔻 GDP Shrinking: UK growth has stalled with below-trend GDP prints 3 quarters in a row.
📉 PMI Weakness: Manufacturing and Services PMIs both under 50 = economic contraction
🧊 Retail Sales Down: UK consumer confidence and demand are cooling
💼 Labor Trouble: Unemployment ticking higher + BoE hinting at peaking rates
🪙 BoE Dovish Pivot?: Market now pricing possible cuts into early 2025.
🇯🇵 JPY (Japanese Yen)
🟢 Inflation is ticking higher
🔄 BoJ is cautiously shifting from ultra-loose policy
🛡️ Yen often strengthens in risk-off environments (which aligns with current market volatility)
🇯🇵 Tokyo CPI surprises have reinforced JPY support

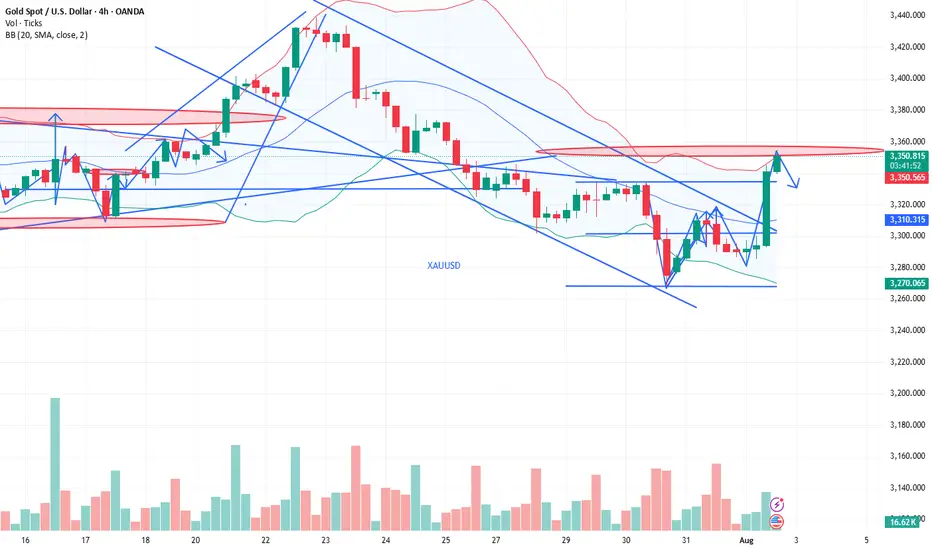
Gold is significantly bullish, where can we short?The positive non-farm payroll report pushed the market from 3300 directly above 3330, demonstrating overall bullish momentum. Congratulations again, everyone. Real-time strategies are like a beacon guiding your investment journey. The market will never disappoint those who persevere and explore wisely. Charlie advises against blindly chasing highs. Trading advice (first hit is valid): Focus on key support levels: 3300 and 3310. Go long if these levels are reached.
~For those who want to go short above 3350-55, only use a stop-loss and feel free to try~ PEPPERSTONE:XAUUSD FXOPEN:XAUUSD ACTIVTRADES:GOLD FXOPEN:XAUUSD CMCMARKETS:GOLD VANTAGE:XAUUSD VELOCITY:GOLD
NZD/USD Holds Above May LowNZD/USD halts the decline from earlier this week to hold above the May low (0.5847), with a move/close above the 0.5920 (61.8% Fibonacci extension) to 0.5930 (78.6% Fibonacci extension) region bringing the 0.6040 (61.8% Fibonacci retracement) to 0.6070 (61.8% Fibonacci extension) zone on the radar.
Next area of interest comes in around the July high (0.6120), but the rebound in NZD/USD may turn out to be temporary if it struggles to trade back above the 0.5920 (61.8% Fibonacci extension) to 0.5930 (78.6% Fibonacci extension) region.
A breach of the May low (0.5847) opens up 0.5830 (38.2% Fibonacci retracement), with the next area of interest coming in around 0.5740 (78.6% Fibonacci retracement) to 0.5760 (100% Fibonacci extension).
--- Written by David Song, Senior Strategist at FOREX.com

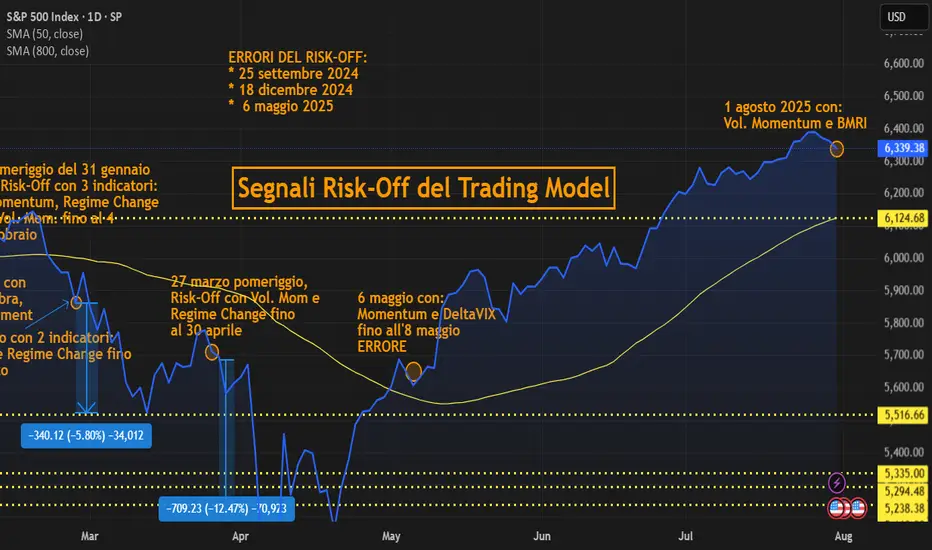
Risk-Off SignalsRisk-Off: 1 August with 2 indicators:
Voil. Momentum and Bear Market Risk Indicators (BMRI)
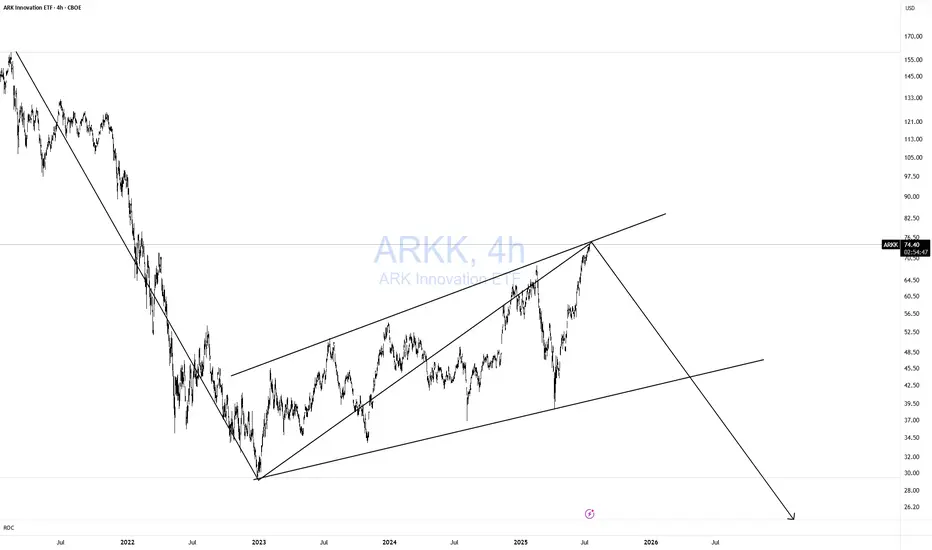
ARKK DOOMED!Classic 123 wave move down! As I like to say Short when no one else is looking! Not when everyone is looking. TOO LATE!
Simple but very effective pattern with excellent risk-reward. Remember, I am a macro trader, so don't expect to see a return on this investment tomorrow.
I won't get into the macro stuff.
EURUSD ahead of NFPEURUSD is still trading within the range established after Wednesday’s news.
We’re watching for a close above 1,1503, which would confirm a potential buying opportunity.
Today at 1:30 PM (London), the NFP data will be released, which could further impact price action - especially if a reversal is underway.
In case of a decline, the next key support level to watch is around 1,1346.
