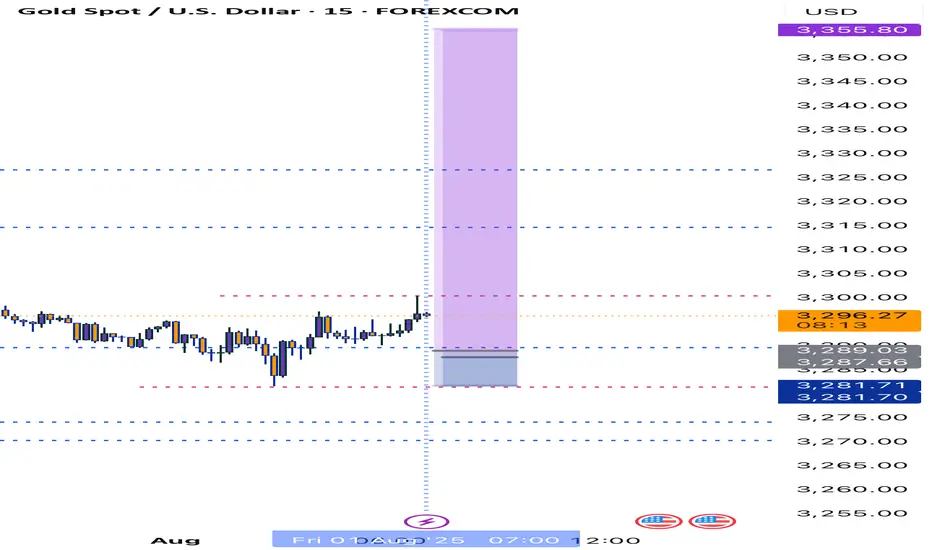
Gold Market Holds Bearish Structure Below 3291Gold market continues to hold firm within the bearish channel, with 3291 acting as a supply zone, maintaining pressure down toward 3269. As long as this zone remains unbroken, bearish momentum stays in play.
🔍 Key Insight:
3291 = active supply resistance
3269 = short-term target if sentiment holds
follow for more insights , comment and boost idea
Trend Analysis

BuyLondon Session
Daily Volume
Untapped Zone
Market Structure
NT:: Limit order must be tapped before the breach of the red line
DGKC – BUY SIGNAL | 01 AUGUST 2025 DGKC – BUY SIGNAL | 01 AUGUST 2025
The stock is trading in an upward bullish channel (marked light blue) and has previously completed two upward pushes. A third and final push is anticipated in this structure. Additionally, a high-probability buy setup has emerged, providing strong confluence for a bullish move.

BTC - BIG OPPORTUNITY COMING SOON AGAIN!IF BTC does not hold the current low, 95% probability we will go for the green box. biggest support is around $110.000 guys. Once/should backtested we could see massive opportunity again on altcoins!

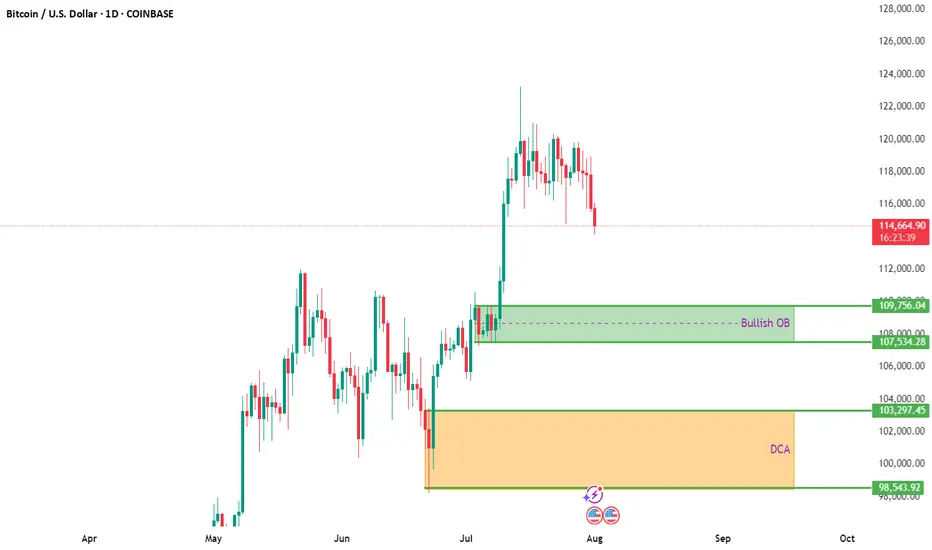
BTCUSD Daily Analysis – Key Entry & DCA ZonesBitcoin is currently pulling back after a strong bullish move, now hovering near $115K. The correction opens a potential window for smart entries based on prior market structure and order block analysis.
🔍 Bullish Order Block (OB):
✅ Zone: $107,534 – $109,756
This area previously served as a breakout zone after consolidation. A retest of this region could act as strong support, making it a prime candidate for short- to mid-term bullish setups.
🟧 DCA Zone (Long-Term Accumulation):
✅ Zone: $98,543 – $103,297
Ideal for long-term investors looking to build exposure gradually. Dollar-cost averaging in this zone allows entry at historically undervalued levels in case of a deeper pullback.
🧠 Trading Insight:
Patience pays. Let price come to your levels rather than chasing. Use alerts and consider scaling into positions with proper risk management.
📌 Chart Context: 1D | COINBASE
📆 August 2025
📈 TA by: @NFX_Solutions
#BTC #Bitcoin #Crypto #BTCUSD #TechnicalAnalysis #OrderBlock #TradingView #CryptoStrategy #DCA #SwingTrade #SupportZone
TRXUSDT Short Trade - Price CorrectionsBINANCE:TRXUSDT Short Day Trade - Low Risk, with my back testing of this strategy, it hits multiple possible take profits, manage your position accordingly.
Note: Manage your risk yourself, its risky trade, see how much your can risk yourself on this trade.
Use proper risk management
Looks like good trade.
Lets monitor.
Use proper risk management.
Disclaimer: only idea, not advice

BITCOIN SENDS CLEAR BULLISH SIGNALS|LONG
BITCOIN SIGNAL
Trade Direction: long
Entry Level: 114,912.19
Target Level: 117,003.95
Stop Loss: 113,517.68
RISK PROFILE
Risk level: medium
Suggested risk: 1%
Timeframe: 2h
Disclosure: I am part of Trade Nation's Influencer program and receive a monthly fee for using their TradingView charts in my analysis.
✅LIKE AND COMMENT MY IDEAS✅

XAUUSD Intraday Technical Analysis – Bullish Breakout SetupGold (XAUUSD) is showing signs of bullish recovery after a sharp sell-off, with current price action around 3305.86 USD hinting at a potential breakout on the 1-hour timeframe.
- Technical Overview
Price structure: After a steep decline, gold formed a base near the 3284–3299 zone and is now climbing back, with a potential inverse head-and-shoulders formation taking shape.
EMA cluster: Price is approaching the confluence of the EMA 50, EMA 100, and EMA 200, currently acting as dynamic resistance around 3309–3323. A break above these levels may confirm bullish strength.
Fibonacci retracement: The bounce appears from the 0.874 extension, indicating the end of the previous bearish leg.
Volume analysis: Increasing bullish volume supports the idea of a potential breakout.
- Key Levels to Watch
Zone Type
Price Level (USD)
Remarks
Immediate Resistance: 3,309 – 3,323 - Major test zone; overlaps with EMA 50/100
Major Resistance : 3,337 – 3,340 - Previous high; if broken confirms bullish continuation
Support Zone: 3,299 – 3,302 - Intraday support turned demand zone
Critical Support: 3,284 – 3,285 - Recent swing low; invalidates bullish view if broken
- Intraday Strategy Suggestion
Scenario 1 – Bullish Breakout
Entry: Buy on breakout and retest of 3,309–3,323
SL: Below 3,299
TP1: 3,337
TP2: 3,355
- Confirmation by strong bullish candle closing above EMA cluster and above resistance zone.
Scenario 2 – Buy on Pullback
Entry: Buy limit at 3,300–3,302
SL: Below 3,284
TP1: 3,323
TP2: 3,337
- Look for RSI divergence or bullish engulfing candle at support for higher conviction.
- Final Note
The bulls are attempting to reclaim momentum after a major correction. If gold can sustain above the 3,309 resistance and hold the 3,300 base, a short-term bullish reversal could materialize.

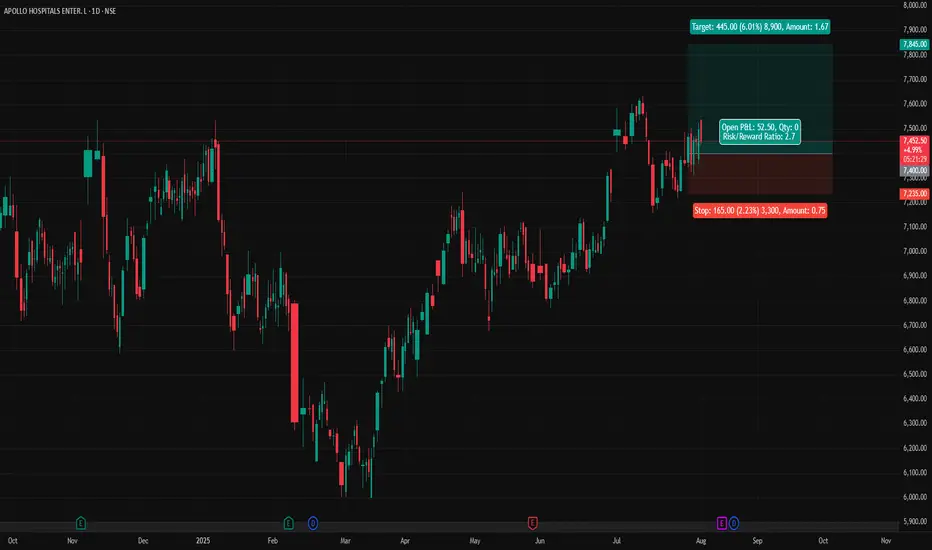
APOLLOHOSP - Apollo Hospitals (Daily chart, NSE) - Long PositionAPOLLOHOSP - Apollo Hospitals Enterprise Ltd. (Daily chart, NSE) - Long Position
Risk assessment: Medium {support structure integrity risk}
Risk/Reward ratio ~ 2.7
Current Market Price (CMP) ~ 7450
Entry limit ~ 7400 on Aug. 01, 2025
Target limit ~ 7845 (+6.01%; +445 points)
Stop order limit ~ 7235 (-2.23%; -165 points)
Disclaimer: Investments in securities markets are subject to market risks. All information presented in this group is strictly for reference and personal study purposes only and is not a recommendation and/or a solicitation to act upon under any interpretation of the letter.
LEGEND:
{curly brackets} = observation notes
= important updates
(parentheses) = information details
~ tilde/approximation = variable value
-hyphen = fixed value
EUR NZD LONG RESULT Price moved better than anticipated, after adjusting my stop loss a little above break even, I decided to risk extended TP to the Supply zone, and the news pushed price directly in our Favor and TP Done ✅.
Not a financial advice though.
_THE_KLASSIC_TRADER_.

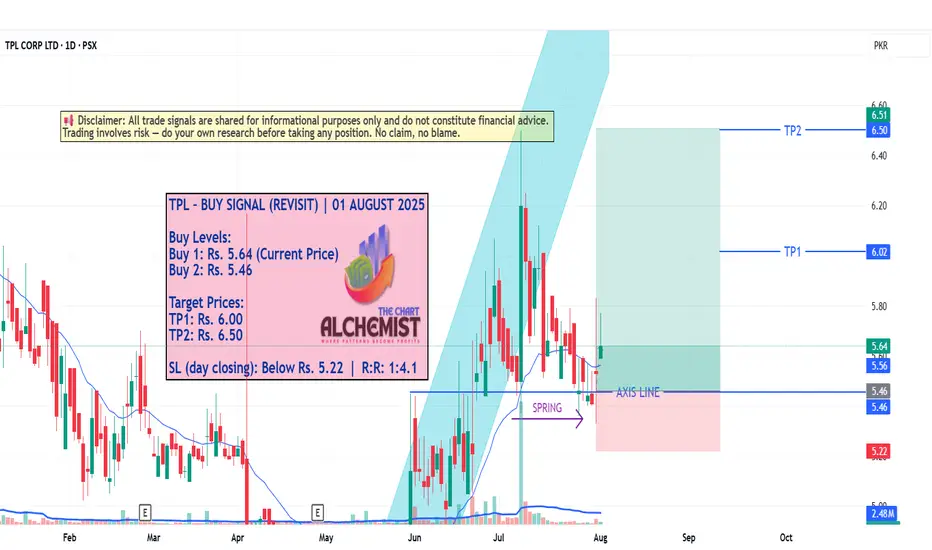
TPL – BUY SIGNAL (REVISIT) | 01 AUGUST 2025 TPL – BUY SIGNAL (REVISIT) | 01 AUGUST 2025
The stock was previously moving within a bullish channel (marked light blue), but recently broke down from it, triggering a potential trap. However, it found strong structural support and formed a spring near the excess line , a classic Wyckoff reversal signal. With a reclaim of structure and confirmation of bullish intent, TPL appears ready to resume its upward leg toward key resistance levels.
MATA | Long Swing Setup | Trapped Sellers (Aug 2025Matador Technology Inc. (Canada) | Long Swing Setup | Accumulation & Trapped Sellers (Aug 2025)
1️⃣ Short Insight Summary:
Matador Technology is an interesting small-cap play led by Mark Morris, who has a strong vision for tech innovation and market trends. Right now, price action shows signs of flushing out trapped traders, which could set up a big upside opportunity if we manage risk carefully.
2️⃣ Trade Parameters:
Bias: Long (Swing)
Entry: Watching accumulation zones between $0.50
Stop Loss: Below $0.40 (invalidates structure and opens downside risk)
TP1: $0.87 (initial target, partial exits recommended)
TP2: $1.80 (mid-term target)
Final TP: $3.00 (long-term aggressive target)
3️⃣ Key Notes:
Right now, the stock is extremely volatile. The goal is to buy where others are trapped and forced to sell. A clear break below $0.20 would be very dangerous and could push price as low as $0.10.
On the upside, we want to see the stock reclaim the $0.50 zone convincingly. This could build momentum towards $0.87 and beyond. Patience is key—this is a swing trade, not a quick scalp.
4️⃣ Follow-up:
I’ll monitor the price action around $0.40–$0.50 and update if we get a breakout from the current downtrend channel.
Please LIKE 👍, FOLLOW ✅, SHARE 🙌 and COMMENT ✍ if you enjoy this idea! Also share your ideas and charts in the comments section below! This is best way to keep it relevant, support us, keep the content here free and allow the idea to reach as many people as possible.
Disclaimer: This is not financial advice. Always conduct your own research. This content may include enhancements made using AI.

BTC defies expectations –Absorbs 9 billion USD, aiming for 130K?BTCUSDT maintains its bullish momentum despite Galaxy Digital offloading 80,000 BTC (worth ~9 billion USD). Price only saw a slight dip before bouncing back quickly, signaling strong demand and a more mature market sentiment.
Citi analysts point to ETF inflows and retail participation as the primary drivers of BTC’s rally, even as investors remain cautious ahead of the Fed’s rate decision.
On the daily chart, BTC continues to trade within an ascending channel, with the 116,200 zone acting as a potential buy area on any pullback. The next target is set at 129,500 USDT, aligning with the channel’s upper boundary and technical resistance.
Suggested strategy: Look to buy near 116,200–117,000. Target 129,500. Stop-loss below 115,000.

KSE 100 Technical Analysis 01-08-2025KSE 100 Technical Analysis | 01-08-2025
The KSE 100 index has formed a trading range between 136000 and 140200. After breaching the previous resistance at 13900, the index retested this level in the final hour of trading. We expect the index to rise from this level, cross the upper limit of the trading range, and move towards a new target.
Key Levels
- *Support*: 136000
- *Resistance*: 140200 (upper limit of the trading range)
- *Recent Breakout Level*: 139000 (successfully breached and retested)
Expected Movement
- Rise from current levels
- Breakout above 140200
- Target: 142775 (applicable after successful breakout)
Current Trend
- The index is still in a bullish trend, with potential for further upside.

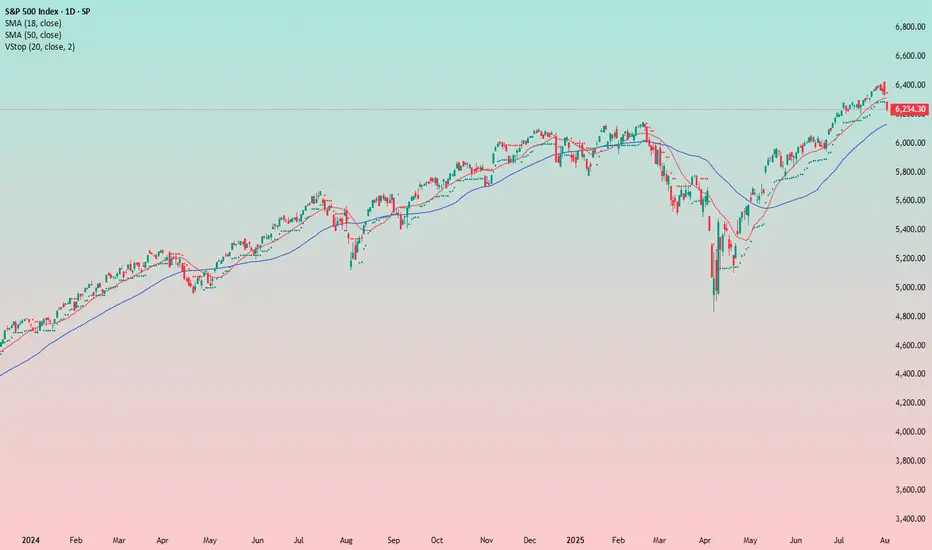
Is This the Start of a Market Drop?So, is the drop beginning? It kind of looks that way, but there’s still no solid setup for entering a short position — and there hasn’t been so far.
The trend is still upward for now, and this current pullback might just be temporary.
What I like about the short idea is that August is traditionally a weak month for stocks .
Could this be the start of a big correction on the market? Yes, it’s possible.
It’s just a pity there’s no clean setup for a short. I’d like to enter, but I’d prefer to see a bit more confirmation on the chart itself.
In general, trading the index off of chart setups isn’t easy — perfect entries are rare. That’s exactly the case now. I’m watching and wondering how and when to catch the downside. Maybe I’ll end up sitting through the entire drop without a position :)
Overall, I’m in favor of the short — but for now, I just don’t see a clear entry point.
GOLD - Monthly breakout retest may confirm multi-year bull cycleHello everyone, what are your thoughts on the long-term outlook for XAUUSD?
Looking at the monthly chart (1M), we can clearly see that XAUUSD has broken out of the long-standing ascending channel that has held since 2015 — a major signal suggesting the start of a new bullish cycle. Price is now retesting the previously broken trendline, hinting at the possibility of a fresh upward leg to resume the longer-term bullish trend we've seen recently.
Personally, I'm targeting $3,600 in the medium term, and potentially $4,000 by 2026–2028 if institutional capital continues to rotate back into safe-haven assets like gold.
What about you — do you think BTC/USD will rise or fall in the coming years?
And what’s your target for it?

I maintain my #3,277.80 and #3,252.80 TargetsI didn't engaged any re-Sell orders throughout yesterday's session and re-Sold Gold on #3,295.80 ahead of Asian session, with plan to keep orders over-night. However due NFP, Gold might be stationary / ranging until the news as I closed both of my orders on #3,291.80 / each #9.000 Eur Profit and my #3,300.80 pending Sell limit has been triggered over-night which is now running in Profits with Stop on breakeven. I do expect #3,277.80 and #3,252.80 Targets to be met within #1 - #3 sessions and if there aren't NFP numbers, I would keep all three orders / set of Selling orders maintaining my first #3,277.80 Target. Due the news, Gold might fluctuate within Neutral Rectangle until the news.
Technical analysis: My earlier Selling configuration / Technical expectations was confirmed on Hourly 4 chart under prolonged weakness and Price-action respecting the trend-line guarding the downtrend (very Bearish formation) as Hourly 1 chart is already an aggressive Descending Channel (width opened on Williams) that should reach it’s next local Low’s (currently Trading slightly below Double Bottom) and Oversold state near my take Profit of #3,252.80 benchmark. If the bands are widened Traders may witness #3,277.80 test, also if gets invalidated and #3,270.80 gives away, #3,252.80 mark extension test is inevitable. In any case I will update my Targets or levels of Profit taking if I decide to exit earlier than #3,252.80 benchmark to be in accordance with the Daily chart’s period / I already ride Selling wave since #,3,300's and my Profit will be already good to ignore.
My position: DX is soaring, Gold is under Bearish Technical developments and #3,252.80 benchmark is my final Target of current Selling leg. Only factor which can reverse this Intra-day but not postpone is NFP. I expect downside Jobs surprise which may reverse DX from local High's however hot upside surprise will make Gold test #3,252.80 Intra-day. NFP or not I do believe Gold is Bearish. Trade accordingly.

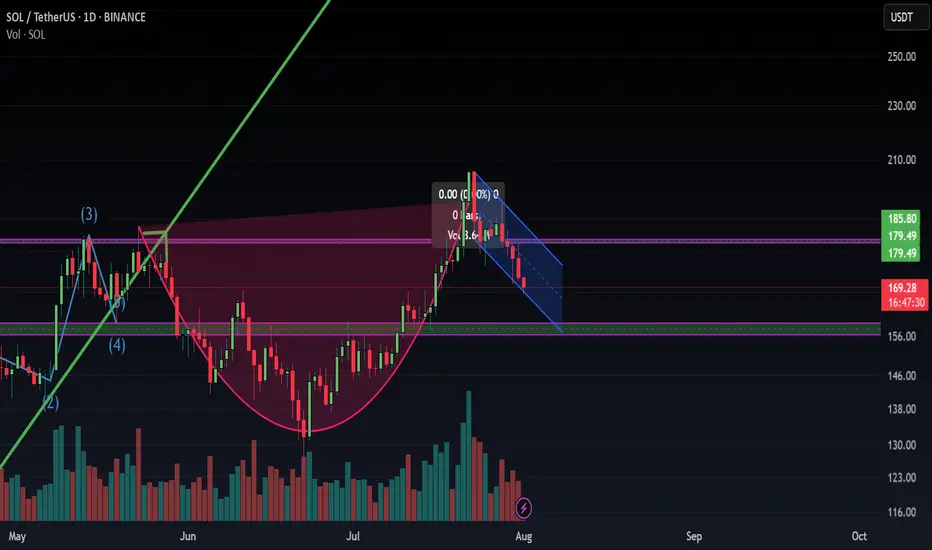
this is familier patternis this a cup of tea pattern? i see a cup and handle this is a sign of bullish in next week
EUR/JPY BEARISH BIAS RIGHT NOW| SHORT
Hello, Friends!
We are now examining the EUR/JPY pair and we can see that the pair is going up locally while also being in a uptrend on the 1W TF. But there is also a powerful signal from the BB upper band being nearby, indicating that the pair is overbought so we can go short from the resistance line above and a target at 168.581 level.
Disclosure: I am part of Trade Nation's Influencer program and receive a monthly fee for using their TradingView charts in my analysis.
✅LIKE AND COMMENT MY IDEAS✅

CADCHF: Bullish Move After the Trap 🇨🇦🇨🇭
There is a high chance that CADCHF will go up today.
After a test of a key horizontal support, the price formed
a liquidity grab with a consequent bullish imbalance.
We can expect growth to 0.5887
❤️Please, support my work with like, thank you!❤️
I am part of Trade Nation's Influencer program and receive a monthly fee for using their TradingView charts in my analysis.

NO FEAR on BITCOIN!I was waiting for a break on this level from some days, and here we go! We catched a nice long setup previous days, and now Bitcoin broke down the key level i highlited last week. This is an important support area that will now act as resistance, so i expect a continuation to the downside till the second support area at $112.000. To invalidate this setup we should expect a clean break above $116.800.
Let me know in the comment what do you expect!

GBPJPY: Pullback From Resistance 🇬🇧🇯🇵
I think that GBPJPY will pull back from a wide
intraday supply area.
As a confirmation, I see a bearish imbalance candle that
is formed after its test.
Goal - 198.51
❤️Please, support my work with like, thank you!❤️
I am part of Trade Nation's Influencer program and receive a monthly fee for using their TradingView charts in my analysis.

Shakeout On The WayUnlike the SPX, the DJI didn't make a higher-high. Why is this? I think partially because it's price weighted as opposed to market cap weighted like the Nasdaq or SPX. The other part would be CPI numbers.
So what's next for the DJI? I see hidden bullish divs long term and hidden bearish divs short term, this a common shake out tactic I see to liquidate longs and shorts. I'll be looking to load up on the trade at the bottom of the channel and play the range as it develops.
As always: stay calm, don't panic, and don't forget you can always use a stop loss
The fear and green index is at 74, when people are greedy be fearful.
