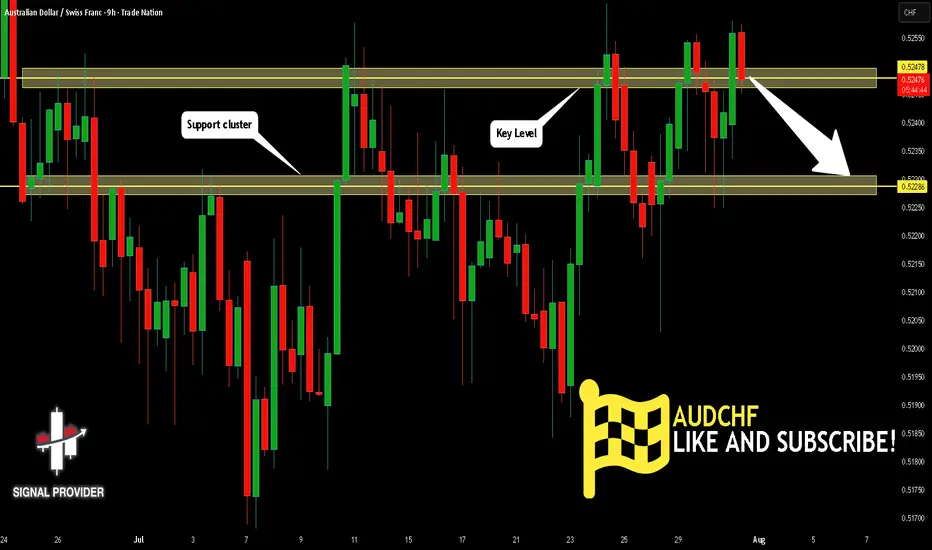
AUDCHF Will Go Down! Short!
Here is our detailed technical review for AUDCHF.
Time Frame: 9h
Current Trend: Bearish
Sentiment: Overbought (based on 7-period RSI)
Forecast: Bearish
The market is on a crucial zone of supply 0.524.
The above-mentioned technicals clearly indicate the dominance of sellers on the market. I recommend shorting the instrument, aiming at 0.522 level.
P.S
Please, note that an oversold/overbought condition can last for a long time, and therefore being oversold/overbought doesn't mean a price rally will come soon, or at all.
Disclosure: I am part of Trade Nation's Influencer program and receive a monthly fee for using their TradingView charts in my analysis.
Like and subscribe and comment my ideas if you enjoy them!
Trend Analysis
Bitcoin FOMC aftermath & plan aheadHi all,
As you may have noticed, Wednesday's FOMC meeting delivered a less-than-optimistic outlook. The absence of rate cuts, combined with uncertainty about potential cuts in September, triggered a downward move in the markets.
Bitcoin is currently trading 7% below its high from July 14th. I anticipate a relatively shallow downtrend and plan to add to my position around $112,000.

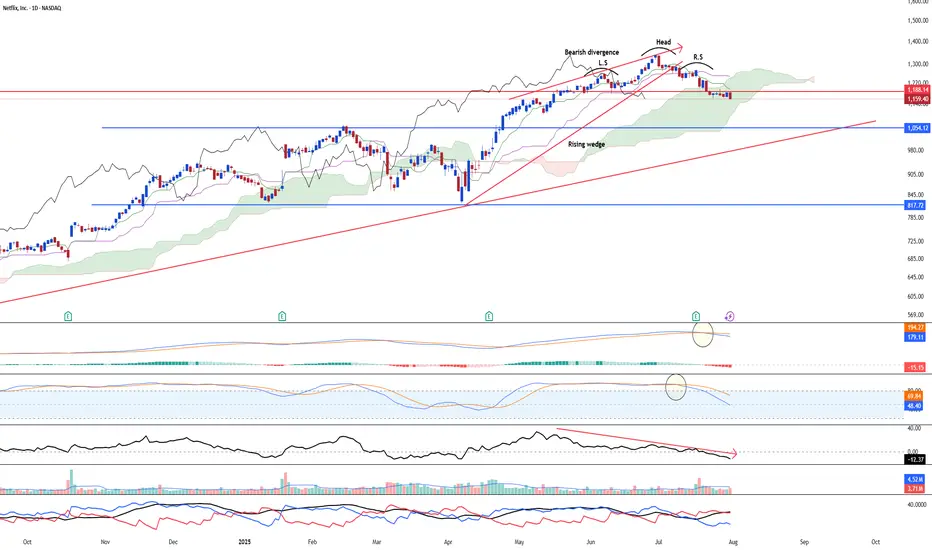
Turning the side for NetflixNetflix NASDAQ:NFLX may go through some serious correction soon after the stock rallied a lot till the high of 1337. Furthermore, the stock has confirmed the head and shoulder reversal with the latest bearish candle rejecting the neckline resistance @ 1188.14. Furthermore, the bearish divergence has been on since 19 May 2025.
Long-term MACD has performed a bearish crossover at the top and histogram is negative.
Stochastic Oscillator has confirmed the overbought signal.
23-period ROC turns negative and forms a bearish divergence. Directional movement index saw increased bearish trend strength signal.
Target is at 1054 in the near-term
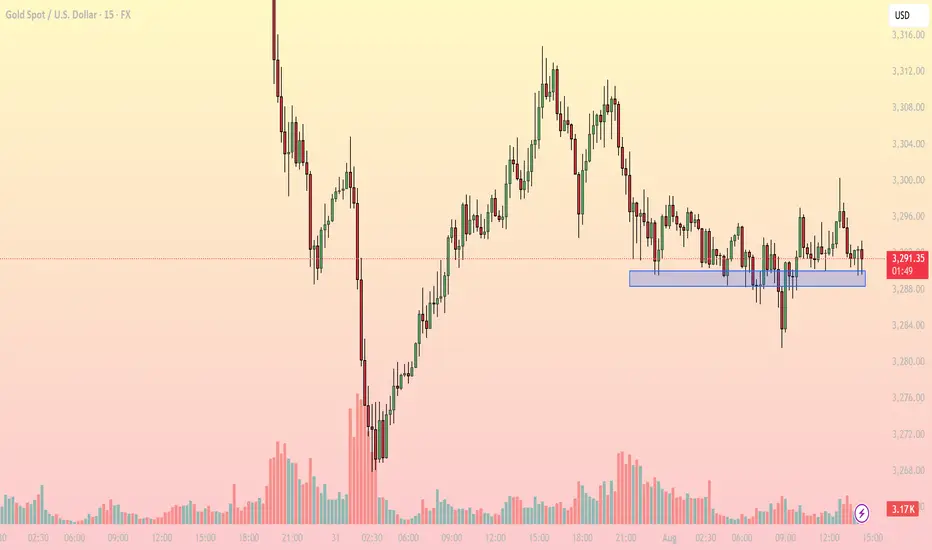
Gold consolidates near key support – What's next for?1. Market Overview
On the 15-minute chart, XAUUSD is trading around 3,290–3,292 USD, hovering just above a critical intraday support zone at 3,287–3,289 USD (highlighted in blue). This area has repeatedly provided a bounce in recent sessions, indicating persistent buying interest.
The current price action reflects sideways movement within a narrow range (3,287–3,296 USD), and notably, declining volatility, as shown by reduced candle range and trading volume.
2. Technical Breakdown
EMA: Price is moving around the EMA20 and EMA50, reflecting indecision and lack of directional momentum.
RSI (inferred): Likely hovering near the neutral 50–55 zone, confirming a balanced market.
Trendline: A descending series of lower highs from the 3,312 peak suggests bearish pressure, though buyers still defend key support.
Fibonacci: The 3,287 USD zone aligns with the 61.8% Fibonacci retracement level, reinforcing its strength as a bounce area.
3. Key Levels to Watch
3,287–3,289: Support - Repeated reactions here – key demand zone
3,296: Immediate resistance - Needs breakout to confirm bullish move
3,302: Next resistance - Breakout target – short-term top
3,275: Deeper support - Retest level if support breaks
4. Trading Strategy Scenarios
🔹 Scenario 1 – Long setup at support
Entry: 3,287–3,289 (wait for bullish reaction like pin bar or engulfing)
Stop Loss: Below 3,284
TP1: 3,296 | TP2: 3,302
🔹 Scenario 2 – Short setup on breakdown
Entry: Below 3,284 (after clear bearish candle close)
Stop Loss: 3,288
TP1: 3,275 | TP2: 3,268
5. Conclusion
Gold is in a tug-of-war at a sensitive support zone. Whether bulls defend or bears break below will set the tone for the rest of the session. Focus on price reaction around 3,287 to determine direction – avoid blind predictions.
Make sure to follow for more live strategies as the New York session unfolds – and save this post if you find it helpful!
What’s your view on this support zone? Let’s discuss below!
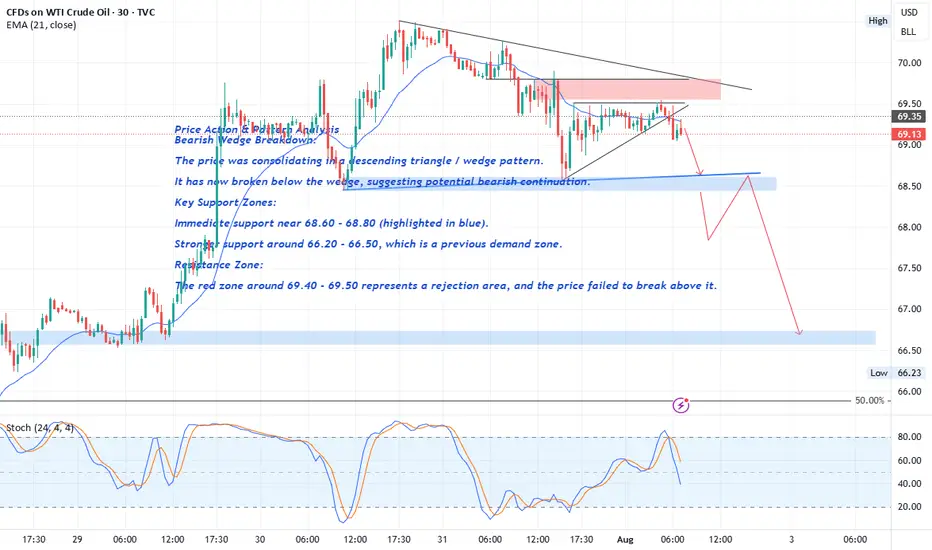
Crude Oil Price Action & Pattern Analysis
Bearish Wedge Breakdown:
The price was consolidating in a descending triangle / wedge pattern.
It has now broken below the wedge, suggesting potential bearish continuation.
Key Support Zones:
Immediate support near 68.60 - 68.80 (highlighted in blue).
FOREXCOM:USOIL
The break of the 68.60 level with a strong bearish candle would serve as confirmation of a Head and Shoulders (H&S) pattern , with solid bearish implications.
Stronger support around 66.20 - 66.50 , which is a previous demand zone.
Resistance Zone:
The red zone around 69.40 - 69.50 represents a rejection area , and the price failed to break above it.
GBPUSD – DAILY FORECAST Q3 | W31 | D1 | Y25📊 GBPUSD – DAILY FORECAST
Q3 | W31 | D1 | Y25
Daily Forecast 🔍📅
Here’s a short diagnosis of the current chart setup 🧠📈
Higher time frame order blocks have been identified — these are our patient points of interest 🎯🧭.
It’s crucial to wait for a confirmed break of structure 🧱✅ before forming a directional bias.
This keeps us disciplined and aligned with what price action is truly telling us.
📈 Risk Management Protocols
🔑 Core principles:
Max 1% risk per trade
Only execute at pre-identified levels
Use alerts, not emotion
Stick to your RR plan — minimum 1:2
🧠 You’re not paid for how many trades you take, you’re paid for how well you manage risk.
🧠 Weekly FRGNT Insight
"Trade what the market gives, not what your ego wants."
Stay mechanical. Stay focused. Let the probabilities work.
FX:GBPUSD

US100 Index – Potential Bearish Reversal in Key Resistance Zone🧠 US100 Index – Potential Bearish Reversal in Key Resistance Zone
Timeframe: 30-Minute | Chart Published: July 24, 2025
---
🔍 Overview
The US100 (NASDAQ) has been trading in a well-structured ascending channel, forming higher highs and higher lows. However, recent price action suggests that the index is testing a critical supply zone near 23,400, with signs of weakening bullish momentum. This may signal a potential corrective phase or bearish reversal.
---
📈 Technical Analysis Breakdown
🔵 Trend Structure:
Price is respecting a clear ascending trendline (blue), connecting multiple higher lows.
Multiple bullish flag/channel formations have been completed within the uptrend, showing healthy momentum until the current point.
🟥 Resistance Zone:
Strong supply zone marked between 23,250 – 23,450.
Price action shows stalling candles and rejection wicks within this zone, indicating buyer exhaustion.
⚠ Bearish Patterns:
The red path projection suggests a head and shoulders-like structure forming at the top of the channel.
This, along with divergence in wave strength and shrinking momentum, supports a potential reversal.
🔵 Key Support:
First support lies around 23,000 — aligning with the ascending trendline and previous consolidation.
If broken, next demand zone is around 22,835 – 22,900, where historical consolidation took place.
---
🔁 Projected Scenario (as per visual path)
1. Price may attempt one last push into the 23,400–23,450 zone (possible false breakout).
2. Rejection from this level could trigger a fall toward the ascending trendline support.
3. A confirmed break of the trendline can lead to a larger correction toward the 22,800 zone.
---
🧠 Unique Insight
This chart combines multi-timeframe structure recognition with a real-time reversal formation inside a long-standing bullish trend. The analysis doesn’t just rely on textbook patterns—it recognizes real-time price behavior shifts, which makes it valuable for proactive traders.
---
📌 Conclusion
While the trend remains bullish overall, caution is warranted as the US100 approaches a historically significant resistance zone. The setup offers a compelling risk-reward short opportunity for aggressive traders, especially if the price confirms a break below trendline support.
---
🔧 Next Steps for Viewers
> “Watch for a clean rejection candle or lower high at resistance before entering short. If trendline breaks cleanly, 22,835 could be the next target zone.”

EUR/CAD BUYERS WILL DOMINATE THE MARKET|LONG
Hello, Friends!
We are going long on the EUR/CAD with the target of 1.607 level, because the pair is oversold and will soon hit the support line below. We deduced the oversold condition from the price being near to the lower BB band. However, we should use low risk here because the 1W TF is red and gives us a counter-signal.
Disclosure: I am part of Trade Nation's Influencer program and receive a monthly fee for using their TradingView charts in my analysis.
✅LIKE AND COMMENT MY IDEAS✅

I maintain my #3,277.80 and #3,252.80 TargetsI didn't engaged any re-Sell orders throughout yesterday's session and re-Sold Gold on #3,295.80 ahead of Asian session, with plan to keep orders over-night. However due NFP, Gold might be stationary / ranging until the news as I closed both of my orders on #3,291.80 / each #9.000 Eur Profit and my #3,300.80 pending Sell limit has been triggered over-night which is now running in Profits with Stop on breakeven. I do expect #3,277.80 and #3,252.80 Targets to be met within #1 - #3 sessions and if there aren't NFP numbers, I would keep all three orders / set of Selling orders maintaining my first #3,277.80 Target. Due the news, Gold might fluctuate within Neutral Rectangle until the news.
Technical analysis: My earlier Selling configuration / Technical expectations was confirmed on Hourly 4 chart under prolonged weakness and Price-action respecting the trend-line guarding the downtrend (very Bearish formation) as Hourly 1 chart is already an aggressive Descending Channel (width opened on Williams) that should reach it’s next local Low’s (currently Trading slightly below Double Bottom) and Oversold state near my take Profit of #3,252.80 benchmark. If the bands are widened Traders may witness #3,277.80 test, also if gets invalidated and #3,270.80 gives away, #3,252.80 mark extension test is inevitable. In any case I will update my Targets or levels of Profit taking if I decide to exit earlier than #3,252.80 benchmark to be in accordance with the Daily chart’s period / I already ride Selling wave since #,3,300's and my Profit will be already good to ignore.
My position: DX is soaring, Gold is under Bearish Technical developments and #3,252.80 benchmark is my final Target of current Selling leg. Only factor which can reverse this Intra-day but not postpone is NFP. I expect downside Jobs surprise which may reverse DX from local High's however hot upside surprise will make Gold test #3,252.80 Intra-day. NFP or not I do believe Gold is Bearish. Trade accordingly.
Gold (XAU/USD) on the 1‑hour timeframeGold (XAU/USD) on the 1‑hour timeframe
Chart Structure & Bias
* Price remains trapped in a **rising channel** (\~\$3,328–3,333), pressing against resistance near **\$3,340–3,345**.
* Short-term momentum is bearish: both EMA 7 and EMA 21 sit above current price, with declining volume signaling weakening buyer strength.
* Overall trend leans neutral‑to‑bearish until market clears key zones decisively.
Trade Scenarios
**Bearish Breakdown (Preferred)**
* **Trigger:** Break and close below channel support (\~\$3,326).
* **Targets:** Initial drop toward **\$3,320**, then **\$3,300**, and possibly lower if momentum intensifies.
* **Invalidation:** Price pushes back above **\$3,333–3,335**, negating bearish structure.
**Bullish Breakout (Conditional)**
* **Trigger:** Clean breakout and sustained close above **\$3,342–3,345**.
* **Targets:** Upward stretch toward **\$3,355–3,360**, and if strong, **\$3,367–3,375+**.
* **Invalidation:** Fails to hold structure—retesting from above back beneath **\~\$3,338**.
Macro Drivers & Market Conditions
* Caution prevails pre‑Fed decision and ADP / GDP releases—market awaits cues on interest rate direction.
* Safe‑haven demand has softened as global trade sentiment improves, while U.S. dollar strength continues to cap upside in gold.
* Analysts favor **sell‑on‑rise positioning**, bumping up potential for controlled pullbacks.
Verdict
Gold is consolidating in a tight upward channel, showing short-term bearish pressure. The **bearish breakdown scenario holds the edge** unless price convincingly clears above **\$3,345** on strong volume, which could flip bias. A confirmed break below **\$3,326** sets the stage for downward moves toward **\$3,300** or lower.

BTCUSD Technical Analysis – Bearish Momentum Towards Fair Value BTCUSD Technical Analysis – Bearish Momentum Towards Fair Value Gap
Bitcoin is showing clear bearish pressure after rejecting from the previous resistance zone around 118,800 – 120,000. The market structure and smart money concepts indicate potential for further downside.
🔍 Key Observations:
Previous Resistance Respected: Price failed to break through the strong resistance zone marked near the 119,200–120,000 level, showing strong institutional selling interest.
Market Structure Breaks:
BOS (Break of Structure) and CHoCH (Change of Character) confirmed bearish shift.
Price has maintained lower highs and lower lows, signaling a bearish trend.
Liquidity/Fair Value Gap Zone: The market is currently targeting the liquidity/FVG zone between 116,400 – 116,100, which aligns with price inefficiency and unfilled orders.
Support Zone Ahead: A strong support zone is visible near 115,600 – 115,200. Expect a potential reaction or consolidation here.
📌 Strategy & Bias:
Short Bias Active until price reaches 116,116 (target).
Watch for possible bullish reversal signs in the support/FVG zone.
Ideal for scalp-to-swing short trades, with tight SL above recent EQH.
📚 Educational Notes:
Fair Value Gaps (FVG) indicate institutional imbalances and are often revisited by price.
CHoCH and BOS are early signals of smart money moves – always monitor them in confluence with volume and zones.

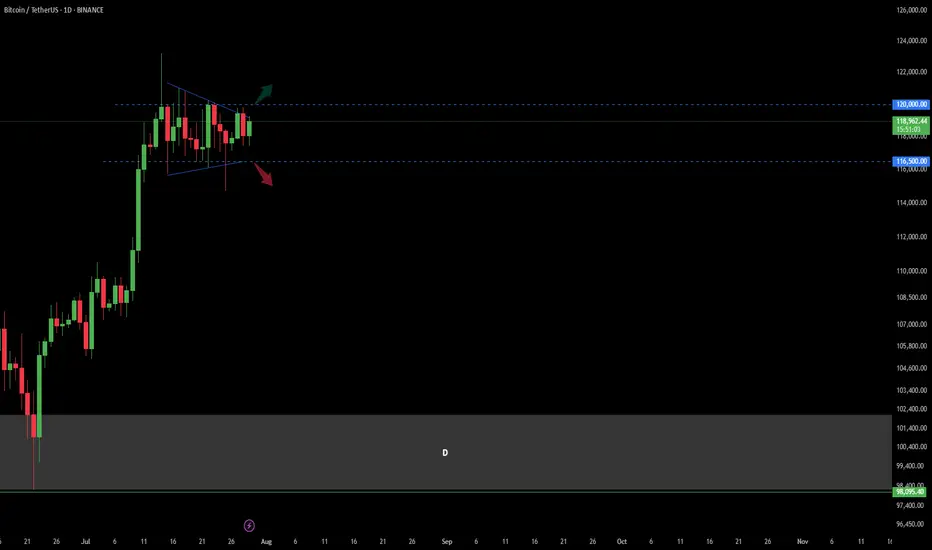
Bitcoin Trend Analaysis UP or DOWN?!Price capped in a wedge in Daily time frame.
There was a fake break from the bottom of this wedge last week and sharply got back to the top of it!
Now : break and confirm above 120 K in Daily would make the market BULLISH
break and confirm under 116.5 K in Daily would make the market BEARISH.
other wise market is still in a range mode...
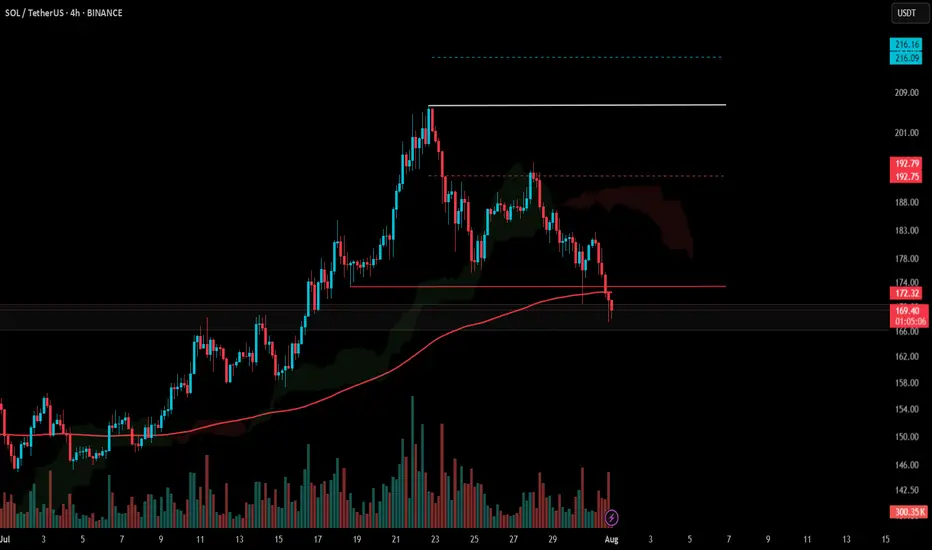
#SOL Update #6 – Aug 01, 2025#SOL Update #6 – Aug 01, 2025
Unfortunately, Solana failed to hold the last low where its most recent impulsive move had started, and it closed below that level. This close also occurred below the MA200 band. In other words, Solana broke a very strong support on the 4-hour chart and moved downward, reaching the previous K-Level zone. It’s hard to say anything positive for Solana at this stage. If the current K-Level fails to hold, Solana may look for support around the $158 level. A long position on Solana is definitely not recommended. I also do not suggest a short position. However, unless there’s a strong reversal, it’s safe to say that Solana has entered a bearish phase on the 4-hour chart.
Btc Short positing Strong sell 40 to 50 pips Btc Short positing Strong sell 40 to 50 pips .
If you wanted to learn about more fell free contrect me .

#XRP Update #5 – July 29, 2025#XRP Update #5 – July 29, 2025
The long position we opened two days ago is still active, and as I mentioned earlier, I’m not planning to use a stop. In the previous trade, we took profit with 30% of our capital at the $3.33 level. Although there has been a pullback, I’m still holding the position. I have no intention of placing a stop and will continue by averaging down if necessary.
Currently, XRP has reacted from the K-Level zone. Its target is the $3.93 level, but the first major resistance it needs to break is at $3.66. I’m continuing to hold the position for now.

Xausd techinical analysis.Xausd techinical analysis next move posibale at h1 time frame not finchinical advice.

RPLUSDT Forming Strong Bullish StructureRPLUSDT is currently showing a strong bullish structure, with price action reclaiming a key support zone after a temporary retracement. The chart reveals a textbook market cycle with higher highs and higher lows, indicating a possible continuation of the uptrend. The current price level is sitting just above a key demand zone, previously tested and confirmed as strong support. This confluence area may act as a springboard for a potential move toward the 60% to 70% target gain zone, aligning with broader bullish sentiment seen across mid-cap altcoins.
Volume indicators are supportive of this move, suggesting that accumulation is underway. Increased investor interest in RPL is likely tied to its integral role in Ethereum’s liquid staking ecosystem, as Rocket Pool continues to gain adoption. With ETH staking steadily growing, projects like RPL tend to benefit from fundamental tailwinds. This kind of sector strength combined with favorable technicals gives the current setup more credibility and potential for follow-through.
The technical projection suggests that if momentum holds and buyers maintain control above the support range around $6.70–$7.00, then the next leg could push RPLUSDT beyond $12.00. That represents a 70%+ move from current levels, which aligns with the Fibonacci extension and measured move projections derived from previous breakout zones. Traders should keep a close eye on volume confirmation and potential breakout candles above minor resistance near $7.50.
This setup offers a well-defined risk-to-reward ratio for swing traders and position holders alike. With the current crypto market regaining traction, RPL is positioned as a high-potential candidate for strong upside if broader conditions remain favorable.
✅ Show your support by hitting the like button and
✅ Leaving a comment below! (What is You opinion about this Coin)
Your feedback and engagement keep me inspired to share more insightful market analysis with you!

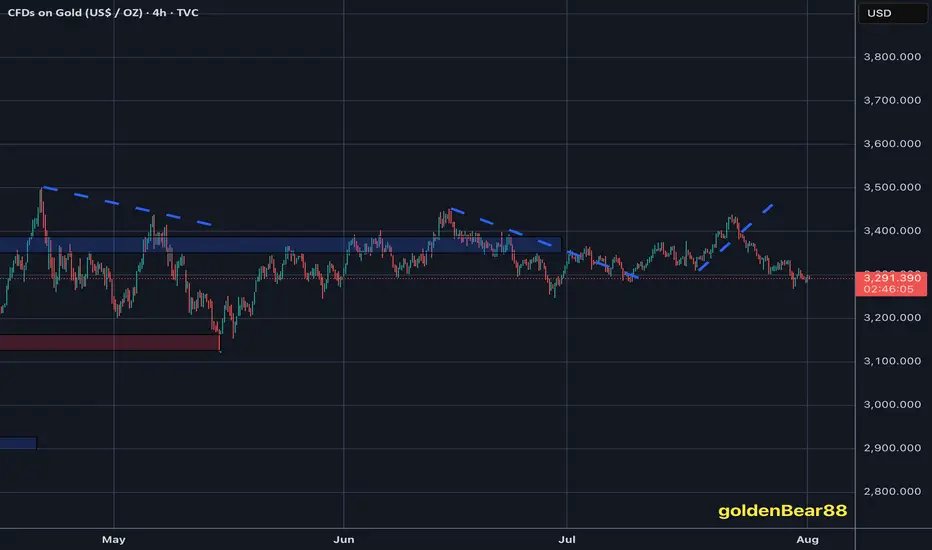
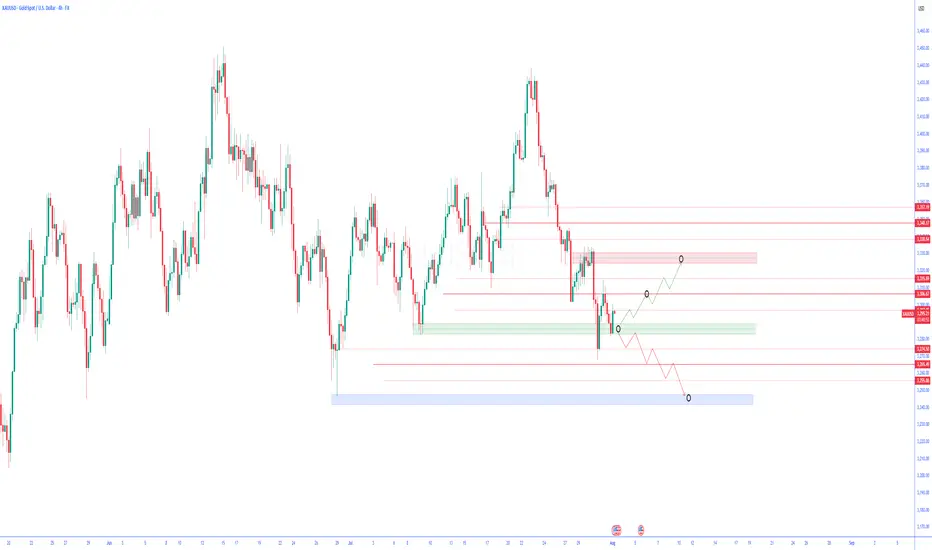
Technical Analysis of Gold Chart (XAU/USD) – 4-Hour TimeframeTechnical Analysis of Gold Chart (XAU/USD) – 4-Hour Timeframe
Following the heavy selling pressure seen in recent days, the price of gold has now reached a zone that has repeatedly shown reactions in the past. This green-colored support area can currently play a decisive role in the market’s next move.
Price Movement Outlook:
Scenario 1 – Bullish Correction Move:
If buyers manage to take control of the market in this zone, it is expected that gold will gradually pass through intermediate resistance levels and first enter the medium-term resistance area. If momentum is maintained, the price could then move toward higher highs. This move can be interpreted as a technical correction against the recent bearish wave and may attract short-term traders until reaching strong supply zones.
Scenario 2 – Continuation of the Downtrend:
Conversely, a confirmed break of this support with high volume and strong bearish candles could lead to a further decline in price toward previous lows. In this case, the blue-colored area at the lowest part of the chart would serve as the next demand zone.
Key Point:
The market is currently in a decision-making phase. Confirmation of reactions at this support area is extremely important in determining the market’s future direction. Therefore, entering the market prematurely without waiting for confirmation of price behavior could involve high risk.
XAUUSD
XAUUSD Updated in 15M :
The gold signal is marked on the chart based on the latest price changes and the supply and demand in the market. These points include the entry point, stop loss, and take profit

ETH Reposition Play – VolanX DSS Sentiment Filter Active📉 ETH Reposition Play – VolanX DSS Sentiment Filter Active
🧠 VolanX DSS Triggered a Long Watchlist Signal
The ETH/USDT daily chart shows price stalling near the 0.786 Fib zone after a strong rally. Our proprietary DSS (Decision Support System) now monitors sentiment misalignment to prepare for the next institutional push.
🔍 Key DSS Observations:
Retail Sentiment: Fearful — retail bias flipped to short.
News Headlines: Negative — VADER sentiment ≈ –0.45.
Funding Rates: Flipped to negative across major exchanges.
Fear & Greed Index: 28 (deep fear zone).
📊 All 4 signals confirm contrarian long opportunity in “Reposition Zone” (≈ 3566–3280). Smart Money often absorbs panic exits before triggering the next leg.
🎯 DSS Strategy:
✅ Wait for confirmation at 3,280 or wick flush to 3,061.
📈 Potential upside target = 5,033 (1.618 Fib extension)
🛡️ DSS Sentiment Filter = ✔ Passed (4/4 bearish crowd indicators)
“When the crowd panics, liquidity positions. VolanX knows this.” – WaverVanir Protocol
📡 Signal monitored via VolanX Alpha Engine
🔒 Institutional tracking | AI-guided logic | DSS Probability Matrix
#ETH #Ethereum #Crypto #WaverVanir #VolanX #SmartMoney #SentimentTrading #AlphaProtocol #DSS #Reposition

ADA Monthly Buying Opportunity As per my analysis ADA is showing buying opportunity in monthly chart. I hope it will return max 50% of investment in coming months. Trend is bullish, Monthly volume is above the average volume, golden level support. Do your own research before taking any risk.

Nightly $SPY / $SPX Scenarios for August 1, 2025🔮 Nightly AMEX:SPY / SP:SPX Scenarios for August 1, 2025 🔮
🌍 Market-Moving News 🌍
📦 U.S. Imposes New Tariffs as Deadline Passes
Fresh tariffs rolled out on August 1 hitting major exporters: 25% on Indian goods, 20% on Taiwan, 19% on Thailand, and 15% on South Korea. Canadas tariff elevated to 35%, though Mexico got extra negotiation time. Global equity markets slipped modestly, led by declines in Asia-Pacific regions. AMEX:SPY futures also eased on mounting geopolitical and trade pressures.
🏦 Fed Uncertainty Mounts Despite Calm GDP
Despite robust Q2 GDP growth and a hold on interest rates this week, Fed Chair Jerome Powell faced growing unrest. Comments acknowledged downside labor risk amid trade uncertainty—investors are now assigning just a 39% chance of a rate cut in September.
📊 Key Data Releases & Events 📊
📅 Friday, August 1:
8:30 AM ET – Nonfarm Payrolls (July):
Payrolls rose by 106,000, less than June’s 147,000 but still positive. Wage growth slowed, easing inflation concerns slightly.
8:30 AM ET – Unemployment Rate:
Unemployment ticked up to 4.2%, from 4.1% in June—reflecting modest labor softness.
8:30 AM ET – Average Hourly Earnings (MoM):
Wages rose +0.2%, down from +0.4% in June, signaling wage pressure easing.
⚠️ Disclaimer:
This information is provided for educational and informational purposes only and should not be construed as financial advice. Always consult a licensed financial advisor before making investment decisions.
📌 #trading #stockmarket #economy #jobs #Fed #tariffs #inflation #technicalanalysis

GOLD SETUP – BUY THE DIP OR SELL THE LIQUIDITY?Smart Money Playbook with Macroeconomic Context
📅 Date: July 31, 2025
🧠 Analyst: Clinton Scalper
🔍 Technical Breakdown (XAU/USD – H1/H4 Confluence)
Price is currently reacting within a key Fair Value Gap (FVG) zone and appears to be setting up a liquidity sweep on both sides before committing to a strong directional move.
🟢 BUY PLAN
Entry: 3,284
SL: 3,275
TP Targets:
▫️ TP1: 3,290
▫️ TP2: 3,300
▫️ TP3: 3,310
▫️ TP4: 3,320
▫️ TP5: 3,330
▫️ TP6: 3,340
▫️ TP7: 3,350
Key Support Zone: 3,276–3,284
→ Bullish OB + previous demand + potential BOS if price holds
🔴 SELL PLAN
Entry: 3,324
SL: 3,334
TP Targets:
▫️ TP1: 3,320
▫️ TP2: 3,310
▫️ TP3: 3,305
▫️ TP4: 3,300
Sell Zone: Inside FVG + liquidity inducement structure
→ Sell into imbalance after price fakes above recent swing highs
🔎 Smart Money Logic
Price is navigating a deep retracement inside a key FVG, targeting both sides of liquidity before trend continuation.
The BUY PLAN aligns with a classic "liquidity sweep → OB rejection → internal structure break".
The SELL PLAN is a short-term scalping idea inside the FVG liquidity zone, where institutional orders are often triggered before real bullish continuation.
🌍 Macroeconomic Context
US GDP data recently came in slightly below forecast → weaker USD outlook.
Gold demand remains supported due to:
Geopolitical risks (Ukraine, Taiwan tensions)
Market uncertainty over next Fed move (dovish bias increasing)
Real yields declining → bullish for precious metals
However, any hawkish Fed speak or sudden bond yield spikes can trigger intraday sell-offs into OB demand.
🎯 Trading Strategy Outlook
Buy if price sweeps below 3,284 and holds the demand zone. Target extended upside as macro supports gold.
Sell scalp at 3,324–3,330 zone if price shows rejection in FVG zone, but don’t overstay shorts.
⏳ Patience is key: Let price fill liquidity zones and follow smart money trail.
📌 Summary
🔸 Primary Bias: Bullish (Buy Plan favored due to macro + structure)
🔸 Secondary Bias: Bearish scalps from premium FVG
🔸 Watch for: USD volatility, yields, and institutional reaction in OB/FVG zones.
