$TOTAKEKE – Dark Cheems Building Momentum? Meme Bull Run SetupOverview
Totakeke (aka Dark Cheems) is positioning itself as the “brother coin” to the well-known meme Cheems on BSC. It’s been quietly gaining attention. It has been tweeted by PancakeSwap, Trust Wallet, Four Meme, and even interactions from CZ on X! HOLY SHIII! With meme coins leading this market cycle, Totakeke’s early-stage market cap of $6.2M puts it in prime territory for explosive moves if narrative momentum holds.
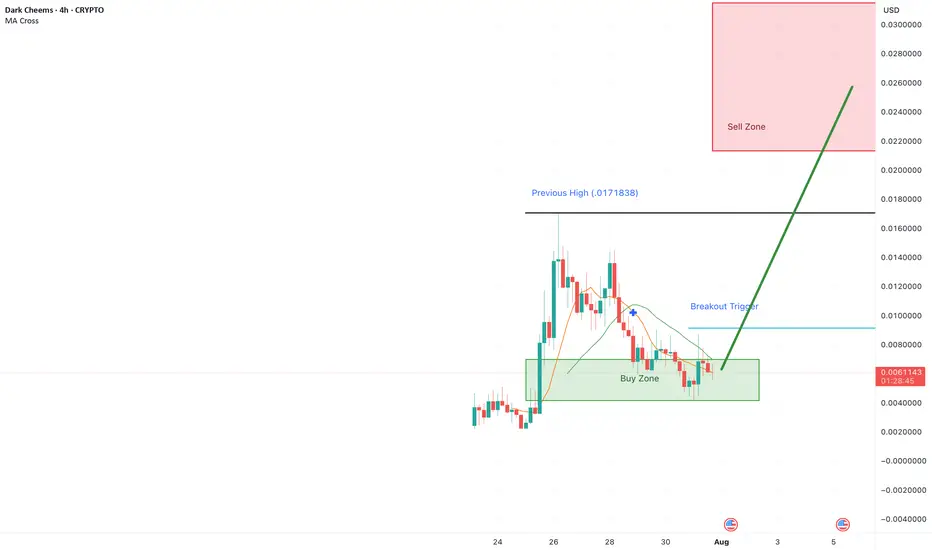
Initial discovery pump around July 25–26 → price surged to 0.025 before sharp retrace.
Current -75% pullback into accumulation zone (0.0058–0.007) matches classic meme cycle setups (PEPE, BONK patterns).
Liquidity at $408K = thin books; big buys/sells swing price 20%+ easily.
Key Levels
Accumulation Zone: 0.0058–0.007
Breakout Trigger: 0.009–0.01 (close above signals next wave)
Previous ATH: 0.025 (first upside target)
Meme Extension Target: 0.04–0.05 (6–8x potential if bull run continues)
Narrative Catalyst
Strong ties to BSC meme culture (Cheems brother narrative).
Engagement by top ecosystem accounts (PancakeSwap, Trust Wallet, CZ).
Community buzz forming → potential for “viral rotation” if meme bull run expands.
Play Idea (Meme Bull Logic)
Accumulate quietly in base range; position size small due to volatility.
No tight stop-loss: meme coins wick hard; manage risk via exposure, not micro stops. aka nut up or shut up
Upside targets: 0.01 / 0.025 / 0.04 (scale out as narrative develops).
Lose 0.0058? Next support ~0.0045 (still viable base in meme context).
Totakeke fits the early-stage meme cycle template.. strong narrative tie-ins, early ecosystem attention, and chart structure that mirrors successful meme plays pre-run. If meme momentum continues across BSC, this could be one to watch for multi-x potential.
Not financial advice. Meme coins are extremely volatile... play size and timing matter more than tight TA.
Trend Analysis
COULD THE NAS100 BREAKOUT THIS IMPORTANT FIB LEVEL?As examined similar to the SPX500, NAS100 has already reached the fib extension target of 0.618 and facing a resistance. There are indicator divergences on the weekly down to the 4H time frames suggestion a potential correction in likely soon. My thesis for this week is that NAS100 could briefly push through the resistance and clear liquidity above the fib resistance with a capitulation candle before a correction. Therefore the trade idea is caution to the upside as there are no major reversal candle yet on higher time frame but indicators are blowing warning horns so apply tight stop loss on the trade plan this week while watching for a reversal confirmation on the 4H or daily charts.

GOLD BUYGold maintains its daily gains around $3,300
After retreating markedly on Wednesday, Gold rebounds moderately and remains positive at about $3,300 per troy ounce on Thursday. The precious metal’s rebound comes in response to the daily retracement in US yields across the curve and the so far irresolute price action in the Greenback
The US Federal Reserve kept its benchmark interest rate unchanged for the fifth consecutive meeting, in a range of 4.25% to 4.5%, despite intense pressure from US President Donald Trump and his allies to lower borrowing costs. The decision, however, met opposition from Fed Governors Michelle Bowman and Christopher Waller. This was the first time since 1993 that two governors had dissented on a rate decision.
In the accompanying monetary policy statement, the committee had a more optimistic view and noted that the economy continued to expand at a solid pace. Adding to this, Fed Chair Jerome Powell said during the post-meeting press conference that the central bank had made no decisions about whether to cut rates in September. This comes on top of the upbeat US macro data, and lifted the US Dollar to a two-month high.
Automatic Data Processing reported that private payrolls in the US rose by 104,000 jobs in July, following a revised 23,000 fall recorded in the previous month. Adding to this, the Advance US Gross Domestic Product (GDP) report published by the US Commerce Department showed that the economy expanded at a 3.0% annualized pace during the second quarter after contracting by 0.5% in the previous quarter
SUPPORT 3,346
SUPPORT 3,328
SUPPORT 3,309
RESISTANCE 3,283
RESISTANCE 3,273

S&P Correction Window is official - VOLATILITY AHEADIt's that time of year where the pre-summer push wraps and the summer lull and potential
pause gets underway.
July 31 finished on a bit of a sour note with over 67% of stocks declining today and US indexes finishing RED despite the big gaps and bullish pops on MSFT and META post earnings.f
SPX Key Levels
-watch the 21 day moving average
-watch the 50 day moving average
-more dynamic support in the 100/144/200 moving average cluster
I'll be taking bites at the 5/10/15% correction levels with options and looking for this dip
to be bought by retail and institutions.
Will August 1 US Tariff Deadline matter? After Japan and Eurozone came in and said a deal is being done, I was thinking this would be a dud. BUT, Dr. Copper says "maybe" on the global
tariff deadline with the largest single day move in history (bearish). Being the perfect time of year for a correction (the other being Feb-Apr), and the technicals looking so clean for an
orderly pullback, VIX may float higher and make things more interesting in the next 30-60 days.
Strategies matter, I'll be trading risk defined, but there are great opportunities ahead. A pullback is sure better than literally watching all-time highs every single day.
Thanks for watching!!!

BullishWaiting for price to sweep previous daily low the tap in the demand zone higher timeframe is bullish fotsi looking strong let’s see bois

ton/usdt clear bullsih pattren dyor HERE u can get lot of help from here
TON/USDT a graphically bullish chart pattern and fundamentals are good
long term hodl good and futures 2-4x lev is enough for entire cucle here we can see a 70% potential in this
dis: im not finanicail advisor

SPY and its games -FOMC buy level needs to be taken out After 3 days of back and forth, the trend line is the deciding factor for me on the bearish bias.
Once the FOMC buy level is taken with at least 4hr closure, sellers are in control.

First possible for SELL After a long buy price need a correction movement and it can be a sell order

Money Flow - 2### Money Flow Spread from DJI to Cryptocurrency: A Fibonacci Perspective
The financial markets operate in an interconnected ecosystem where capital flows between asset classes based on macroeconomic trends, investor sentiment, and risk appetite. One such dynamic involves the movement of funds from traditional markets like the **Dow Jones Industrial Average (DJI)**—a barometer of blue-chip stocks—to emerging asset classes such as **cryptocurrencies**. This phenomenon can often be analyzed using **Fibonacci retracements and extensions**, which serve as powerful tools for identifying key support, resistance, and potential price targets during shifts in market momentum.
#### 1. **Market Sentiment and Capital Rotation**
- The DJI represents large-cap equities that are heavily influenced by institutional investors, central bank policies, and global economic conditions. When these factors trigger volatility or uncertainty in traditional markets, investors may seek alternative investments with higher growth potential or hedging properties.
- Cryptocurrencies, known for their decentralized nature and high volatility, attract speculative capital during periods when confidence in traditional assets wanes. For instance:
- During bearish trends in the DJI, characterized by falling prices and increased selling pressure, some investors might reallocate portions of their portfolios into cryptocurrencies like Bitcoin (BTC) or Ethereum (ETH).
- Conversely, bullish trends in the DJI could signal improved risk appetite, prompting a portion of crypto gains to rotate back into equities.
#### 2. **Fibonacci Retracements: Identifying Key Levels**
- Fibonacci retracement levels are derived from the Fibonacci sequence and are widely used in technical analysis to predict areas of support and resistance. These levels (e.g., 23.6%, 38.2%, 50%, 61.8%) help identify potential turning points in price action.
- In the context of money flow from the DJI to cryptocurrencies:
- A significant decline in the DJI could lead to a pullback to Fibonacci retracement levels (e.g., 38.2% or 61.8%). At these junctures, traders may reassess their positions and consider diversifying into cryptocurrencies.
- Similarly, after a sharp rally in cryptocurrencies, prices might retrace to Fibonacci levels before continuing upward. Investors exiting equities due to underperformance might view these retracements as entry points for digital assets.
#### 3. **Fibonacci Extensions: Projecting Price Targets**
- While retracements focus on corrective moves within a trend, Fibonacci extensions project potential price targets beyond the initial move. Common extension levels include 127.2%, 161.8%, and 261.8%.
- In scenarios where money flows out of the DJI and into cryptocurrencies:
- If the DJI experiences a prolonged downtrend, its losses could coincide with outsized gains in cryptocurrencies. Fibonacci extensions can help forecast how far crypto prices might rise amid this influx of capital.
- For example, if Bitcoin breaks above a key resistance level following a surge in inflows from equities, traders might use Fibonacci extensions to estimate future price milestones (e.g., $100,000 or $200,000).
#### 4. **Psychological Drivers Behind the Transition**
- Fibonacci levels resonate with traders because they align with natural human tendencies toward symmetry and proportion. This psychological aspect amplifies their relevance when analyzing cross-market dynamics.
- As money exits the DJI and enters cryptocurrencies, Fibonacci-based trading strategies provide a framework for understanding how participants perceive value across different asset classes. For instance:
- Institutional investors exiting equities might anchor their decisions around Fibonacci-derived thresholds, ensuring disciplined entry and exit points in volatile crypto markets.
- Retail traders, who dominate much of the cryptocurrency space, also rely on Fibonacci tools to time their trades, creating self-reinforcing patterns that influence overall market behavior.
#### 5. **Case Study Example**
- Imagine a scenario where the DJI drops sharply due to rising interest rates or geopolitical tensions. The index falls from 35,000 to 30,000—a decline of approximately 14%. Traders observe Fibonacci retracement levels at 38.2% ($31,900) and 61.8% ($33,100), expecting temporary bounces at these levels.
- Simultaneously, Bitcoin rallies from $20,000 to $30,000 as investors seek refuge in digital gold. Using Fibonacci extensions, analysts project further upside to $38,200 (127.2%) or even $48,500 (161.8%), attracting additional capital from equity markets.
#### 6. **Conclusion**
- The interplay between the DJI and cryptocurrencies highlights the fluidity of modern financial markets. By leveraging Fibonacci retracements and extensions, traders can better anticipate shifts in money flow and position themselves strategically.
- Whether driven by macroeconomic headwinds, technological innovation, or evolving investor preferences, the migration of capital from traditional indices like the DJI to digital assets underscores the growing convergence of old and new finance. Fibonacci analysis serves as a bridge, offering insights into both the timing and magnitude of these transitions.

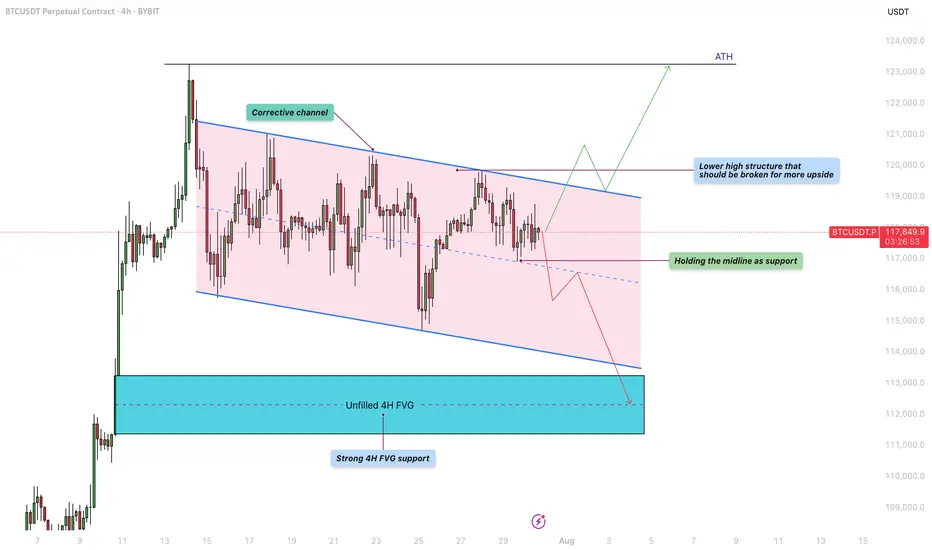
Bitcoin - Will the liquidity at $122K be the next target?Bitcoin is currently trading within a defined corrective channel, which has been developing over the past few weeks. Price action within this structure has been characterized by a sequence of lower highs and lower lows, suggesting a mild downtrend. However, these movements lack strong momentum, indicating that the market is consolidating rather than entering a deeper correction. This kind of structure often precedes a significant breakout, and given the nature of the current price action, a retest of previous highs remains a realistic possibility.
Bullish Scenario
Looking at the overall structure of the channel, a bullish breakout seems increasingly likely. For this scenario to unfold, BTC needs to hold the midline of the channel as support. If this level is respected, it could pave the way for a push towards the upper boundary of the channel and a potential break above the lower high structure near $120,000. A successful breach of that level could trigger a move toward the $122,000 liquidity zone, with the potential to challenge the all-time high (ATH) in the near future. Holding the midline and breaking above key resistance would provide confirmation of strength and continuation to the upside.
Bearish Scenario
On the flip side, if BTC fails to hold the midline as support and starts closing below it on the 4H timeframe, we could see a renewed move toward the lower boundary of the corrective channel. This could lead to a test of the unfilled 4H fair value gap (FVG) highlighted in the chart, located around the $112,000 – $113,000 area. This zone also coincides with a strong historical support level, making it a logical area where buyers might step in and provide the momentum needed for a more sustainable bullish reversal.
Final Thoughts
While both scenarios remain valid, the price structure within the corrective channel currently leans slightly more toward a bullish outcome. The lack of aggressive selling and the potential for liquidity above the previous highs support this view. However, trading is never about certainty but about preparing for various possibilities. Being aware of both bullish and bearish setups allows traders to react with flexibility and discipline depending on how the market unfolds in the coming sessions.
-------------------------
Thanks for your support. If you enjoyed this analysis, make sure to follow me so you don't miss the next one. And if you found it helpful, feel free to drop a like 👍 and leave a comment 💬, I’d love to hear your thoughts!
Down continuationDown continuation, 24000 level is strong but we will see. Would like to see a brake and retest on Fib level.

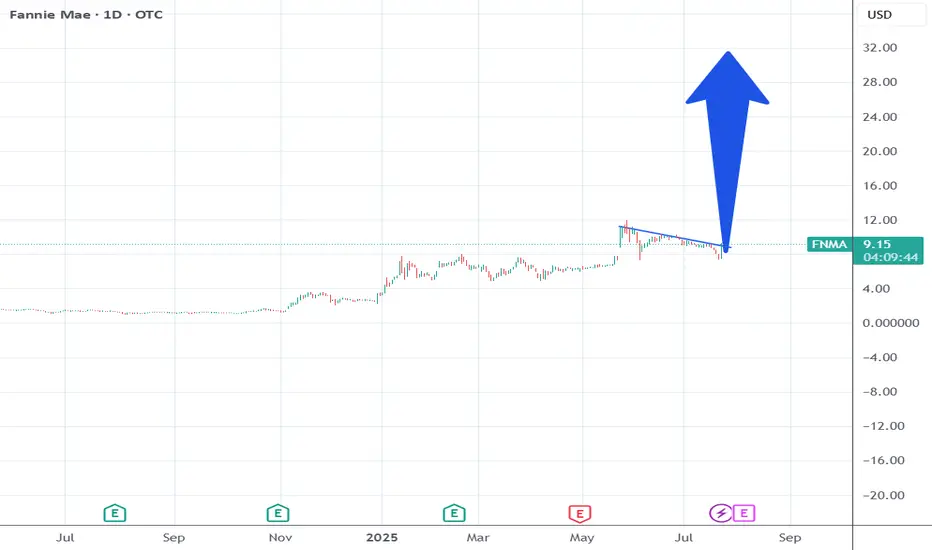
Trump will approve the FNMA privatization within 10 days.Trump works for Wall St. He plans his moves based on what Wall St wants.
He says stuff at certain times to get the markets to react in key times for Wall St.
The overall market is going to correct within the next 30 days.
FNMA just did a shakeout the last 3 weeks.
So Trump will time his announcement to correlate with the events of Wall St.
Remember he was going to do this his 1st term.
18 dollars in the next 3 weeks.
GBPAUDI’m confident in the short-term upward trend. I’ll monitor how the price reacts when it reaches my anticipated level, but until then, I need to remain precise and realistic about my targets.

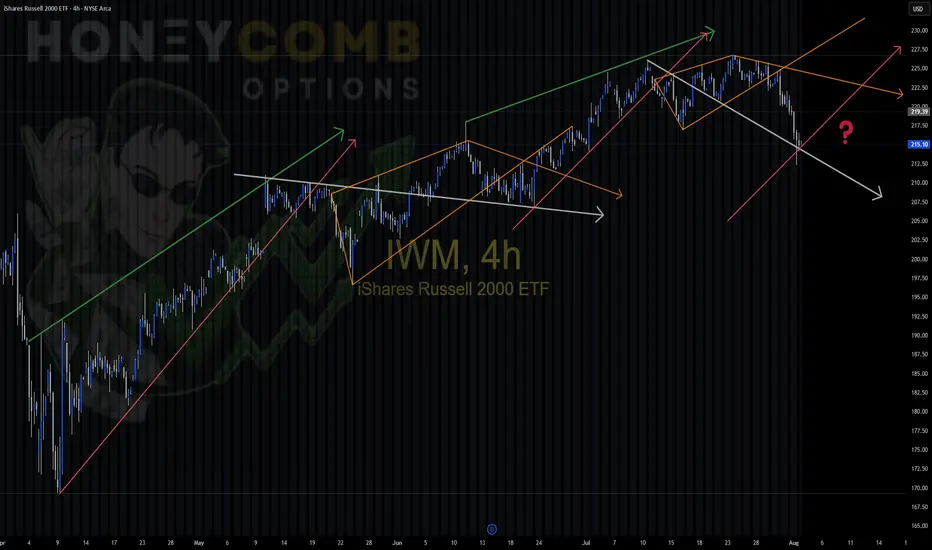
IWM repeating patterns IWM Playing around today noticed similar patterns in this uptrend, color coded for you convenience. Different sizes,, but the patterns are the same. Will we enter a new trend and start a different pattern, or will we stay in the same cycle?
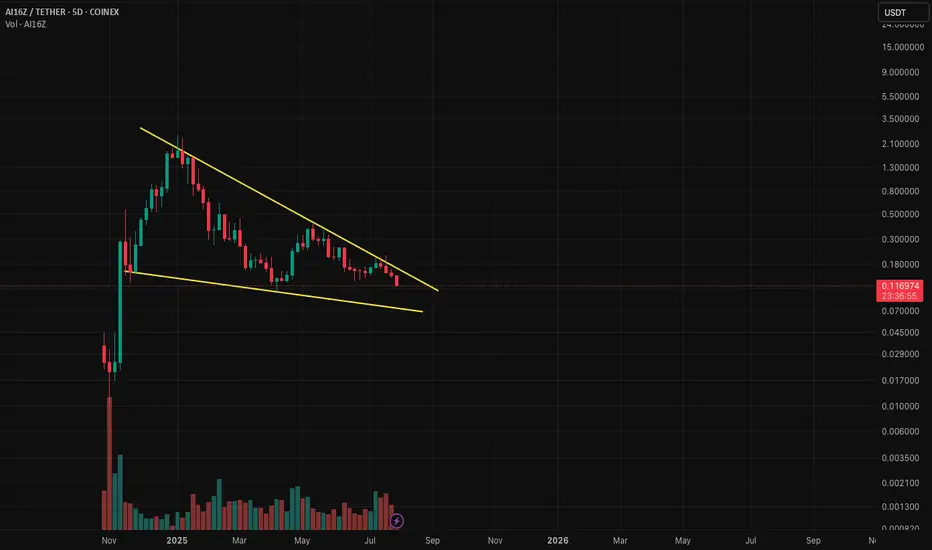
Ai16Z on a falling wedgeai16z has been in a bullish falling wedge for the past roughly 200 days. Right now as bitcoin and other cryptos are having a pull back, ai16z is forming a double bottom formation. The pattern is not complete as of yet please wait for a potential break out above the wedge resistance level to enter trade. However if anyone wish to catch the double bottom trade to maximise return you could enter at 10c but like always high risk high return the double bottom could fall further and void this idea. Happy Trading
TOTAL - Gonna Hold My Coins, Wait & See...This is my own experiment, gonna buy the most underrated top 30 coin, the most hated one. Put $5k on it right now and wait until this happens. Maybe this wont work but we will see!

EURUSD: Eu Looking to Make Gains Vs Weakened USDWelcome back to the Weekly Forex Forecast for the week of Aug 4 - 8th.
In this video, we will analyze the following FX market:
EURUSD
The USD pushed higher on keeping it's interest rate unchanged, but gave back those gains on weak job numbers. This allowed the EU to recover some of the previous weeks losses and show some resiliency.
Now analyst are betting there is a 66% chance for rate cuts in Sept by the Fed. This is negative for the USD, allowing the EURO to move higher.
It is worth mentioning, the EU inked a highly criticized tariff deal with the US, which was not at all positive for the currency.
The market is at a pivotal area that could go either way. Wait for a definitive break of structure before committing to a bias.
Enjoy!
May profits be upon you.
Leave any questions or comments in the comment section.
I appreciate any feedback from my viewers!
Like and/or subscribe if you want more accurate analysis.
Thank you so much!
Disclaimer:
I do not provide personal investment advice and I am not a qualified licensed investment advisor.
All information found here, including any ideas, opinions, views, predictions, forecasts, commentaries, suggestions, expressed or implied herein, are for informational, entertainment or educational purposes only and should not be construed as personal investment advice. While the information provided is believed to be accurate, it may include errors or inaccuracies.
I will not and cannot be held liable for any actions you take as a result of anything you read here.
Conduct your own due diligence, or consult a licensed financial advisor or broker before making any and all investment decisions. Any investments, trades, speculations, or decisions made on the basis of any information found on this channel, expressed or implied herein, are committed at your own risk, financial or otherwise.

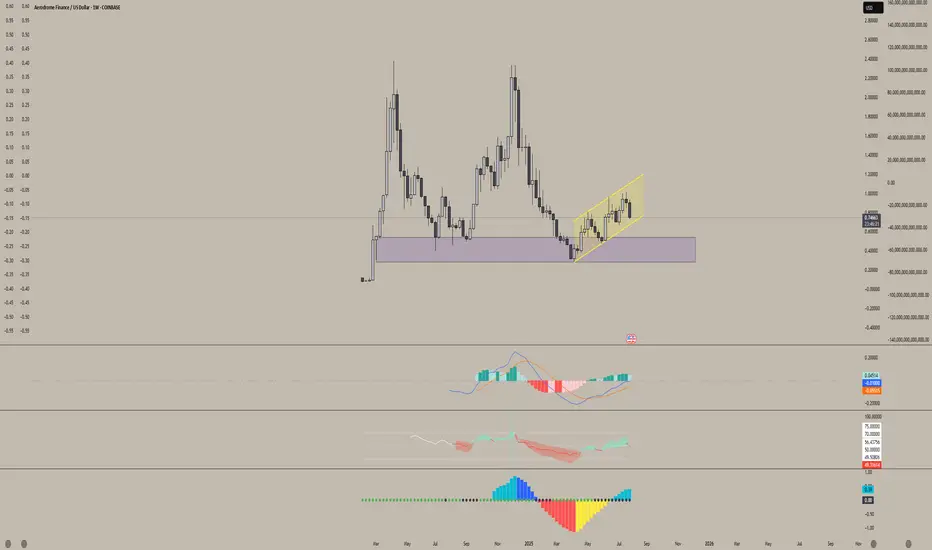
Aerodrome Finance (AERO)Aerodrome (AERO) is showing strong signs of accumulation.
We've been trading within this parallel channel for nearly three months, and it's repeatedly respected both the upper and lower bounds. As we approach the bottom of this range again, it looks like an ideal accumulation zone for long-term holders.
I'm very bullish on this project. Aerodrome is the leading DEX on Base — Coinbase’s Layer 2 network — and with no native Base token currently, AERO is in a prime position to claim that top spot. There's a vacant throne on Base, and AERO is well-positioned to sit on it.
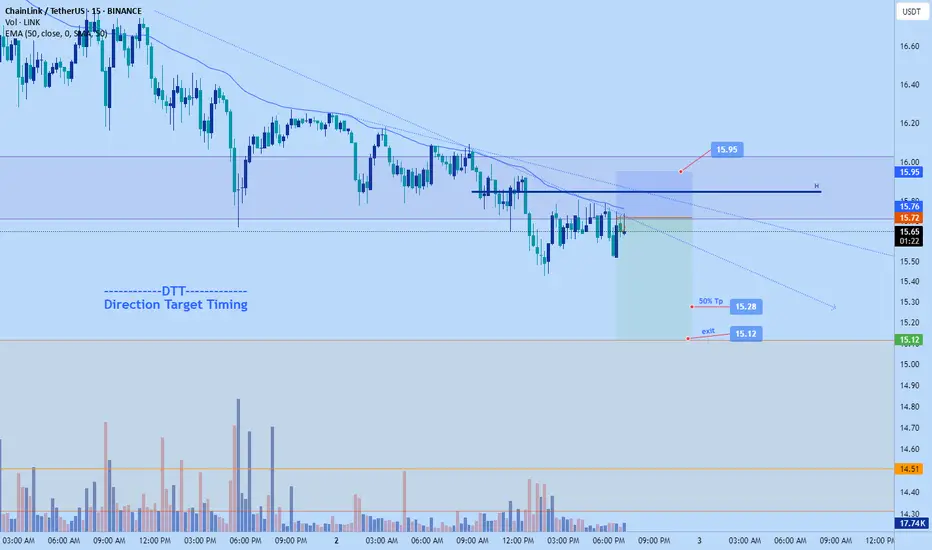
Chainklink further dump to $15.12Just now opened a short position on chainlink.
Aiming for $15.12 area
2-2.61RR
DTT strategy applied.
Time sensitive
Inflection Zone, Do or Die levelI've drawn up a couple of major pivot points that I expect BITSTAMP:BTCUSD to consolidate at before continuing either up or down.
The market is in my opinion currently feeling a little bit confused and not quite fearful yet but a little bit doubtful anyway. The melt up has been real, and for some painful, as directional movement is at most only half of what matters. So this injection of volatility is welcomed at least by me, and I've been fairly exposed to growth stocks in my port lately.
Based on fibonacci phi channels and other confluences of support locations, it looks like we've turned a corner and are on the way down, but I'd be surprised if we breached 107k and as shown, if that did happen, there is a LOT of underlying supply.
I don't know where we go from here but I wanted to point out this level highlighted in light blue, as its historically been a major line in the sand for BTC.

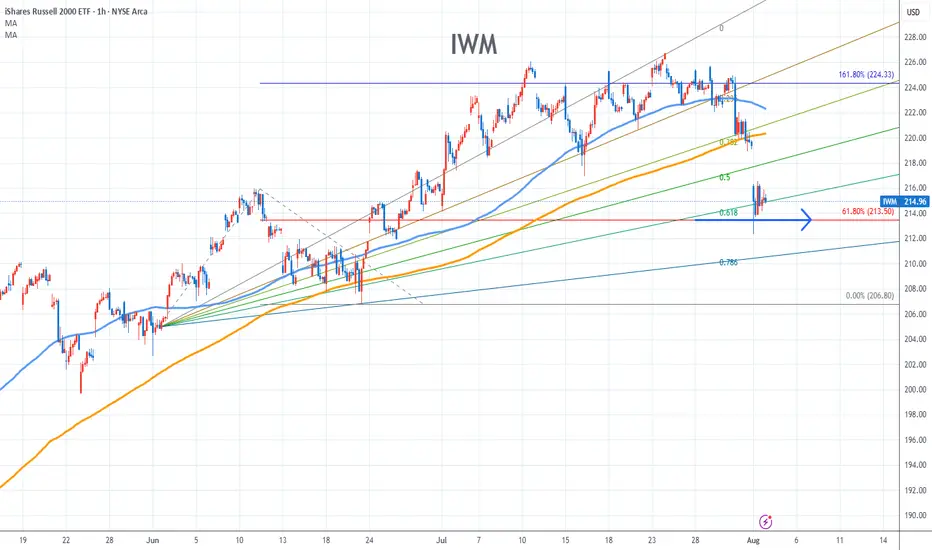
IWM Stock Chart Fibonacci Analysis 080125Trading Idea
1) Find a FIBO slingshot
2) Check FIBO 61.80% level
3) Entry Point > 214/61.80%
Chart time frame:B
A) 15 min(1W-3M)
B) 1 hr(3M-6M)
C) 4 hr(6M-1year)
D) 1 day(1-3years)
Stock progress:C
A) Keep rising over 61.80% resistance
B) 61.80% resistance
C) 61.80% support
D) Hit the bottom
E) Hit the top
Stocks rise as they rise from support and fall from resistance. Our goal is to find a low support point and enter. It can be referred to as buying at the pullback point. The pullback point can be found with a Fibonacci extension of 61.80%. This is a step to find entry level. 1) Find a triangle (Fibonacci Speed Fan Line) that connects the high (resistance) and low (support) points of the stock in progress, where it is continuously expressed as a Slingshot, 2) and create a Fibonacci extension level for the first rising wave from the start point of slingshot pattern.
When the current price goes over 61.80% level , that can be a good entry point, especially if the SMA 100 and 200 curves are gathered together at 61.80%, it is a very good entry point.
As a great help, tradingview provides these Fibonacci speed fan lines and extension levels with ease. So if you use the Fibonacci fan line, the extension level, and the SMA 100/200 curve well, you can find an entry point for the stock market. At least you have to enter at this low point to avoid trading failure, and if you are skilled at entering this low point, with fibonacci6180 technique, your reading skill to chart will be greatly improved.
If you want to do day trading, please set the time frame to 5 minutes or 15 minutes, and you will see many of the low point of rising stocks.
If want to prefer long term range trading, you can set the time frame to 1 hr or 1 day.
DXY continued downside, next stop 90Perfect parallel channel + Fib 2.618 intersection
Gl
Not financial advice

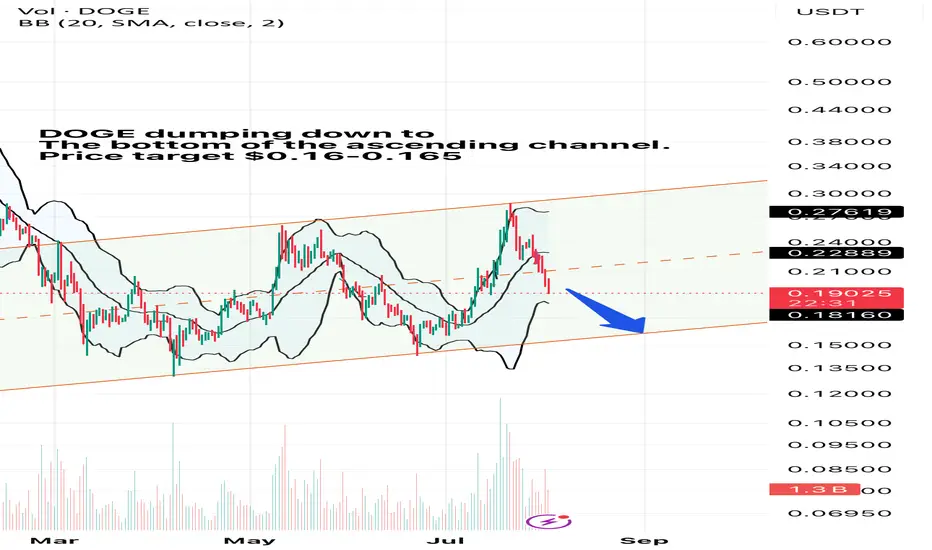
DOGE dumping will end soon.DOGE has been moving within the ascending channel. After hitting the upper resistant level of the channel, it has been dumping since then. Currently heading down to the bottom of the channel. Price Target $0.16-0.165