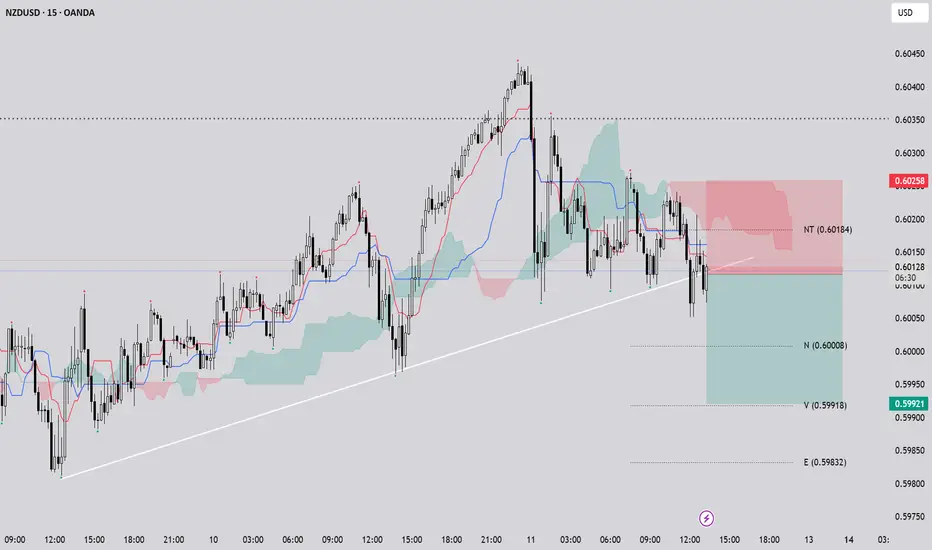
NZD USD / M15 / SHORTOn the 15-minute chart of NZDUSD, a shift in market structure is evident as the prior uptrend—previously supported by ascending trendlines—has been broken. The Ichimoku cloud (Kumo) outlines key support and resistance zones, and price movement outside the cloud reinforces the weakening of the bullish momentum. The crossover between the Tenkan-sen and Kijun-sen lines aligns with the wave structure, signaling a potential bearish phase. This combination of technical signals suggests that the market may be transitioning into a corrective move or a short-term downtrend, presenting a potential opportunity for short positions.
Trend Analysis
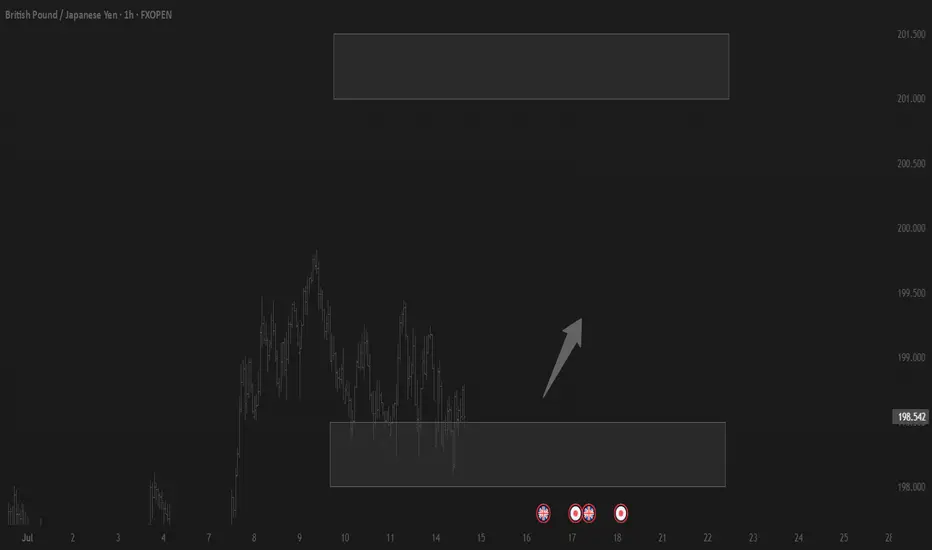
Trading balanceTrading balance The price of the asset has rebounded from the balance zone. With the prospect of growth into the resistance zone.
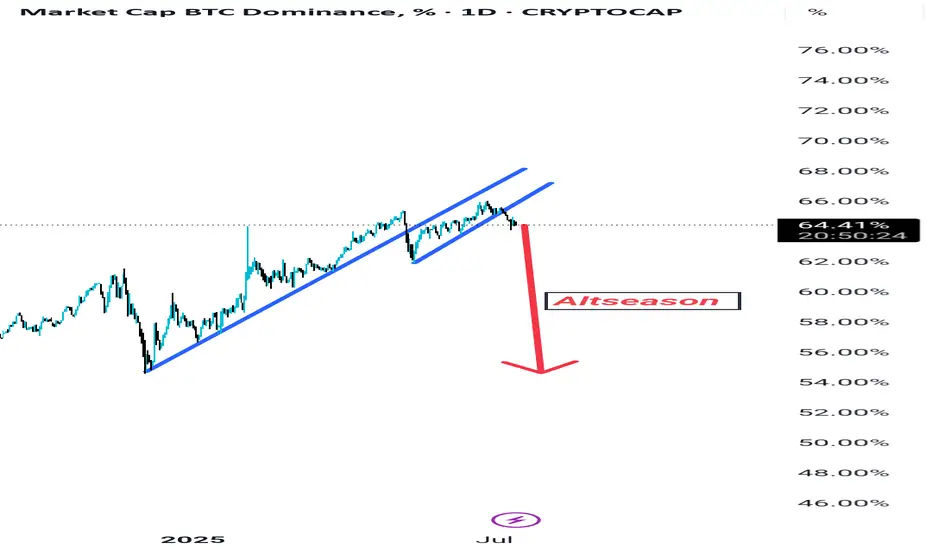
BTC DOMINANCE? Just wait few days guys It seems that Bitcoin dominance , after a long and exhausting uptrend, is finally showing signs of fatigue. The momentum appears to be fading, and a new downtrend has already begun. As you can observe, both the long-term and short-term trendlines have been broken on the daily timeframe, clearly indicating that Bitcoin dominance is shifting into a downtrend.
So, after waiting patiently for so long, hold on just a little bit more. A few more days of patience could change everything. Once dominance starts to fall, the altcoin index will rise, and your favorite altcoins will begin to pump rapidly.
Don’t lose hope. Stay alert. The tides are about to turn in your favor.
Yes, I agree—this time Bitcoin dominance tested everyone’s patience far more than usual. But that’s the nature of the market. It will always push you to your limits, make you sell at a loss, and then move exactly where you expected it to go.
PNUTUSDT UPDATE
Pattern : Falling Wedge Breakout
Current Price: \$0.2842
Target Price: \$0.40, \$0.45
Target % Gain: 100.34%
Technical Analysis: PNUT has broken out of a falling wedge pattern on the 12H chart, signaling a bullish reversal. Volume surged on the breakout, confirming strength. Retest held well, indicating momentum for further upside.
Time Frame: 12H
Risk Management Tip: Always Use proper risk management.

Gold Weekly Analysis | Will $3,360 Break or Hold? [July 14–18]In this video, I break down the recent gold price action and what to expect in the coming week. We’ll review how gold responded to last week’s FOMC minutes, why $3,360 remains a key decision zone, and what upcoming U.S. economic data (CPI, PPI, Retail Sales) could mean for price movement.
👉 If you find this content valuable, don’t forget to Vote, Comment, and Subscribe for weekly market breakdowns.
Disclaimer:
Based on experience and what I see on the charts, this is my take. It’s not financial advice—always do your research and consult a licensed advisor before trading.
#GoldAnalysis, #XAUUSD, #ForexTrading, #GoldForecast, #MarketOutlook, #TechnicalAnalysis, #FundamentalAnalysis, #GoldPrice, #FOMC, #CPIData, #PPIdata, #DollarIndex, #TradingStrategy, #WeeklyOutlook, #GoldTechnicalAnalysis, #TradeSmart, #Darcsherry

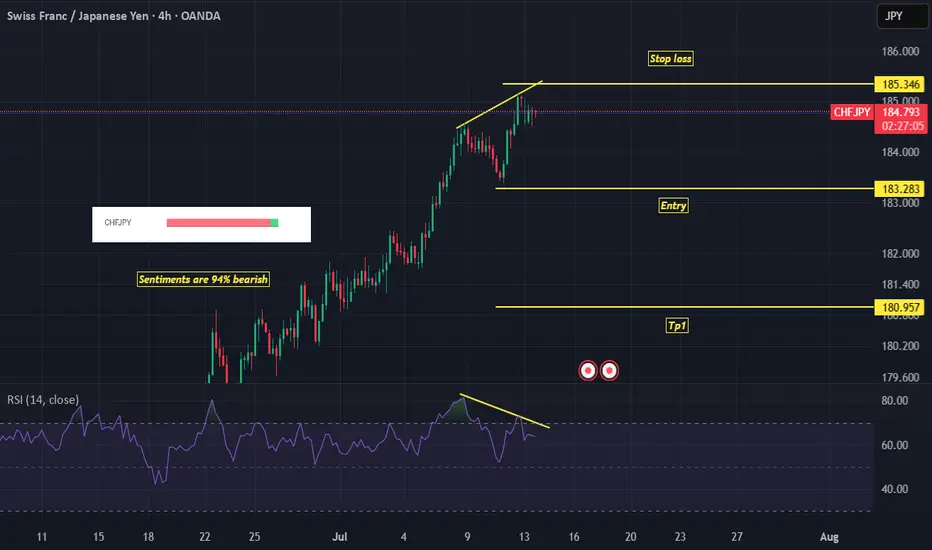
CHFJPY – Possible Trend Reversal (Sell Setup)Reasons for Potential Reversal:
1-Bearish Divergence:
Clear bearish divergence is forming between price and RSI
2-Market Sentiment:
Approximately 94% of traders are currently holding sell positions
3-Break of Last HL:
Wait for a clear break of the most recent Higher Low (HL). This will confirm a shift from bullish to bearish and provide a safer sell entry point.
SAILIFE - IPO base breakoutTighter the consolidations, better the breakout.
A solid base has formed. Moving with the index, sector tailwinds in play

PEPE USDT UPDATE Hi
Very likely scenario, everyone knows that I am a pepe coin hunter and I will return to the previous two charts since 2024 24 Feb

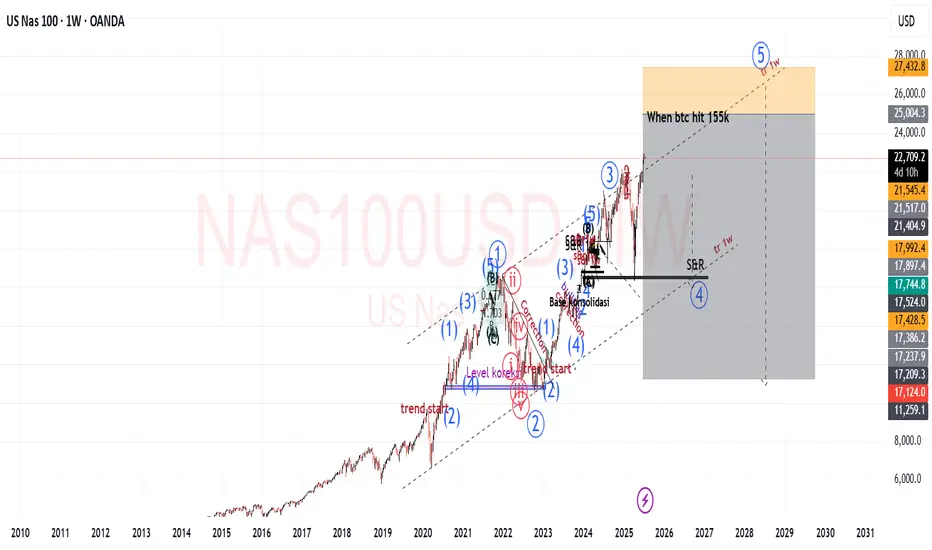
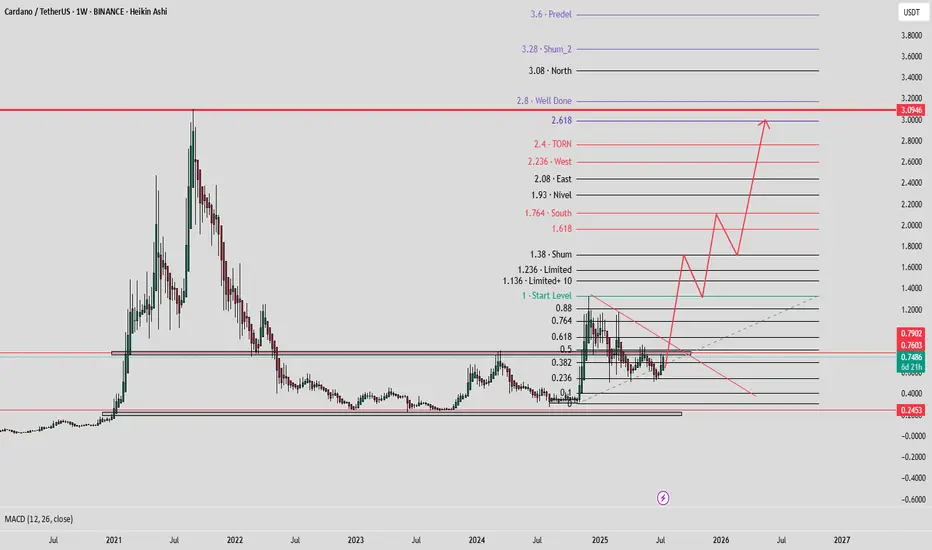
3ADA Almazov Projection#ADAUSD ALMAZOV PROJECTION WEEKLY
Price projection according to Almazov's theory, #ADA should at least touch $1,71 before pulling back or continuing to go long if its dimensionality decreases (2.0).
Crypto Market Update – July 14th🔷Market Update – July 14th: Another Winning Move 🧠🔥
Another week, another breakout – and we’ve been tracking it every step of the way.
💸 Entries? Perfect.
✅ Targets? Hit.
🧠 Psychology? Nailed.
Today, we reached 122,795 , hitting a key target with precision. From there, we took partial profits — and are now watching the next leg toward 127K+ .
We’ve had 4 amazing entries lately, all executed with structure, risk control, and vision.
Today’s move? Just the latest in a series of well-calculated trades.
📉 Support now rests at 120,500 , with deeper support still valid around 114,921 .
This isn’t just a lucky guess — it’s the outcome of following levels, structure, and behavior.
But if you want to go deeper into what’s really happening beneath the surface ...
📊💸 Read the NEW Deep Dive Part III:
The Next BIG Whale Play Unfolds →
Inside it:
🐳 How the bear trap is being set
🧠 Why this is a disbelief rally
⚠️ Why shorting now = adding fuel to the fire
💥 And why this may be the first leg of a much bigger run...
Stay sharp. Stay structured. Stay ahead.
One Love,
The FXPROFESSOR 💙
Disclosure: I am happy to be part of the Trade Nation's Influencer program and receive a monthly fee for using their TradingView charts in my analysis. Awesome broker, where the trader really comes first! 🌟🤝📈
📊💸 And don’t miss Deep Dive Part III – The Next BIG Whale Play Unfolds:

BABYUSDT UPDATE
Pattern: Falling Wedge Breakout
Current Price: \$0.05396
Target Price: \$0.11277
Target % Gain: 110.04%
Technical Analysis: BABY has broken out of a falling wedge on the 1D chart, signaling a bullish reversal. Price is holding above the breakout trendline with increasing momentum, confirming the setup.
Time Frame: 1D

Rune long to $1.645Time sensitive
Just went long on rune
Stop: $1.527
Tp1: $1.59
Tp2: $1.645
DTT setup

euraud trendline longsSeeing as euraud has well respected the trendlines recently I decided to long eur back into the upper end of previously broken trendline. I am european living in australia, I know first hand how weak aud is agains eur as my salary in australia took a massive hit against euro...
I decided to go all in on this trade with a 2% risk. RR is 1:4 for the final TP, but I do see how trade management is the key for longevity, so I still plan on taking partial profits and moving my stop back to BE as soon as price is hitting 1:1 for BE and 1:2 RR for 50% profit taking.
Let's goo

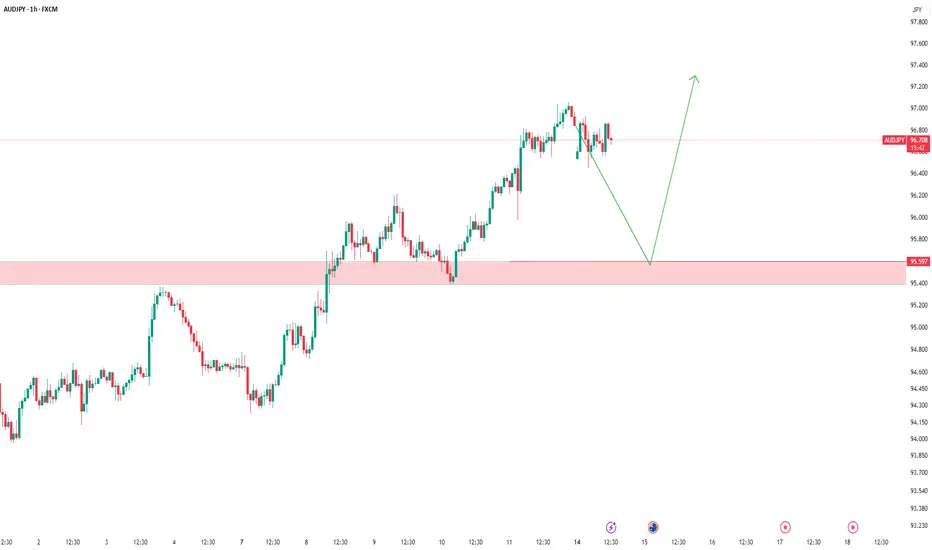
AUDJPY – Waiting for the Long SetupThe price is currently in a corrective move,
and as always, we’ve already marked our key level.
📍 We’re patiently waiting for price to reach our support zone.
If a valid buy signal appears, we’ll take the long position
according to our trading plan.
❌ What if the level breaks?
No worries.
We don’t predict — we follow the market.
We’ll wait for a clean pullback and enter short if confirmed.
🎯 Our job isn’t to predict where price will go,
our job is to manage risk and stay aligned with the market.
Price can do anything —
we’re ready for every scenario.
#BTC/USDT It's not over yet! Eying at 130K +ALTCOIN CHEAT SHEET!The last time I shared this chart was on April 14th, when Bitcoin was trading around $84,000 — right when panic was setting in across the market.
The message back then was simple: don’t panic, it’s just a retest.
And here we are again, revisiting the same sentiment with a new chart!
There are a lot of “double top” charts circulating in the space right now, but let me be clear: it’s not over yet.
Before jumping to conclusions, go through this chart and analysis to understand the full picture.
Bitcoin closed the week at $105,705 — certainly higher than most expected just a few days ago.
This marks the first red weekly candle after seven consecutive green closes, which is normal in the context of a healthy uptrend. We're still midway toward the broader target, so there’s no reason to panic or shift into disbelief.
Yes, we may see further corrections in BTC over the coming days or week, potentially down to $98K, and in a less likely scenario, even $ 92K. But this time, Ethereum is showing signs of strength and is likely to outperform Bitcoin, creating high-quality entry opportunities across the altcoin market. In other words, this phase is not a threat, it's an opportunity. BTC is still destined to hit $130k+ as per charts and other important metrics.
Here’s a typical market structure and reaction flow to help put things in perspective:
1. Bitcoin rallies — Altcoins underperform or get suppressed due to capital rotation into BTC.
2. Bitcoin corrects — Altcoins correct further as fear increases and dominance rises.
3. Bitcoin stabilises — Ethereum begins to gain strength, often leading the altcoin recovery.
4. ETH/BTC ratio increases — Ethereum holds up better while many altcoins continue to lag.
5. Bitcoin breaks ATH — This triggers a gradual recovery in altcoins.
6. BTC dominance peaks — Altcoins start gaining serious momentum.
7. Capital rotates from BTC and ETH into altcoins — Sectors tied to the current narrative (like meme coins this cycle, and Metaverse/NFTs in the last one) begin to lead.
8. Altcoin season begins — Utility and mid-cap tokens follow, often delivering strong returns in the final phase.
This pattern has repeated across cycles. Currently, we appear to be in the transition between Bitcoin stabilising and Ethereum gaining dominance — typically the stage that precedes a strong altcoin rally.
Now is not the time to assume the move is over. Stay objective, monitor capital rotation closely, and prepare for what comes next.
If your views resonate with mine, or if this post adds any value to you, please boost with a like and share your views in the comments.
Thank you
#PEACE
