Bullish Flag Formation Signals Potential Uptrend on EUR/USDThis chart shows a clear bullish flag pattern on the EUR/USD 3-hour timeframe. After a strong impulsive move upward, the price is consolidating within a downward-sloping channel, characteristic of a flag formation. The Ichimoku Cloud supports the consolidation zone, with price currently testing the lower boundary of the flag. A breakout above the upper trendline would confirm continuation of the bullish trend. The chart indicates a strong potential for an upward breakout following the flag’s structure, in line with the prevailing bullish momentum. This setup favours bulls, anticipating continuation of the uptrend once resistance is cleared.
Entry Buy : 16400
First Target: 1.17500
Second Target : 1.18100
If you found this analysis helpful, don’t forget to drop a like and comment. Your support keeps quality ideas flowing—let’s grow and win together! 💪📈
Trend Analysis

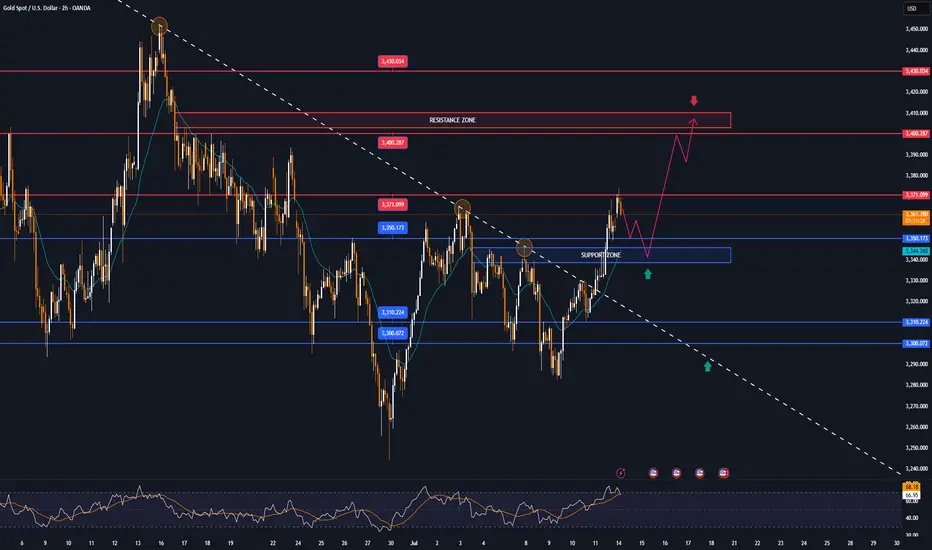
Back above $3,300, GOLD may remain neutral, tax focusOANDA:XAUUSD reclaimed the psychologically important level of $3,300/ounce last week, but while gold is still receiving some support as a safe haven amid economic and geopolitical risks, its upside momentum may be limited as the market shifts its attention to other commodities.
Gold prices ended last week on a generally bullish note, rising back above $3,300 an ounce after US President Trump unexpectedly announced a series of new trade policies. Spot gold prices rose about 0.5% last week on Friday.
Although the market initially doubted Trump’s self-imposed July 9 deadline, the overall market reaction remained steady and the renewed risk appetite helped the S&P 500 hit a new record high, somewhat undermining gold’s safe-haven appeal. The July deadline has been pushed back to August 1, but the global trade conflict is far from over. Gold has regained support after initial pressure after Trump announced a new trade policy on copper imports, along with a series of news stories about the relationship between Trump and the FED sent to readers throughout the past week.
A sharp rise in copper prices will also add to inflationary pressures, exacerbate economic uncertainty and raise concerns about recession and stagflation. In this context, gold is expected to continue to receive support from potential risks.
In addition to fierce competition in the commodity market, gold may remain fundamentally neutral in the short term, as economic data will support the Fed's neutral monetary policy. The key market focus next week will be the June Consumer Price Index (CPI). The Fed has made it clear that it is in no rush to raise interest rates while inflation risks remain high.
However, traders still need to be cautious and closely monitor the situation surrounding the tariff war initiated by Trump, which will directly affect the price of gold. In case of negative news, the gold price will receive support and vice versa if positive news appears in the market.
Over the weekend, US President Trump once again used the tariff tactic, announcing that he would impose a 30% tax on imports from the EU and Mexico, causing a strong reaction from the international community. This move not only casts a shadow over the relationship between Europe and the United States, as well as between the United States and Mexico, but also adds further uncertainty to the global trade model. EU politicians, businesses and academics were quick to respond, calling for unity to protect their interests, while Mexico stressed the need to maintain national sovereignty and pledged to respond calmly.
Technical Outlook Analysis OANDA:XAUUSD
On the daily chart, gold has a 3-day rally, and the upside momentum has reached the important target resistance at the 0.236% Fibonacci retracement level. Gold's upside momentum is also limited by this Fibonacci retracement level, specifically it has slightly dropped to $3,355/oz.
But overall, gold is still not in a position to form a specific trend, and the indicators and positions are mainly showing the possibility of continuing to accumulate sideways.
For gold to have the conditions for a new bullish cycle, it needs to bring price activity above the 0.236% Fibonacci retracement level, then the target will be around $3,400 in the short term, more than $3,430.
Meanwhile, a pullback, which sees gold sell below the 0.382% Fibonacci retracement, would open the door to a bearish cycle, with a target of around $3,246 in the short term, rather than the 0.50% Fibonacci retracement.
RSI hovering around 50 also suggests a hesitant market sentiment, so the short-term bias for gold is neutral.
Along with that, notable positions will also be listed as follows.
Support: $3,350 – $3,310 – $3,300
Resistance: $3,371 – $3,400 – $3,430
SELL XAUUSD PRICE 3406 - 3404⚡️
↠↠ Stop Loss 3410
→Take Profit 1 3398
↨
→Take Profit 2 3392
BUY XAUUSD PRICE 3340 - 3342⚡️
↠↠ Stop Loss 3336
→Take Profit 1 3348
↨
→Take Profit 2 3354
TradeCityPro | SOL Holds PRZ as Bulls Eye Range Breakout👋 Welcome to TradeCity Pro!
In this analysis, I want to review the SOL coin for you. This is one of the popular Layer1 projects, nicknamed the “Ethereum killer,” with a market cap of $85 billion, currently ranked 6 on CoinMarketCap.
📅 Weekly timeframe
In the weekly timeframe, after the bankruptcy news related to FTX, this coin had a very sharp bearish move and even dropped to as low as 9.84, but it managed to recover afterward.
⭐ From the key top at 27.62, a very strong bullish move started, reaching up to 255.96 and retesting its previous ATH.
📊 Currently, a range box has formed between the 128.66 and 255.96 levels, where the bottom of this box is a very strong PRZ, created from the overlap of a major support zone and the area between the 0.236 and 0.382 Fibonacci levels.
🔍 Also, the price is being supported by the SMA99, which has supported the price twice so far and has prevented the box from breaking to the downside.
⚡️ If you have already bought SOL, you can set your stop-loss if the price closes below this area. A confirmed breakdown could lead to deep corrections toward lower Fibonacci levels.
🛒 For buying this coin, the first trigger is the break of 178.22, which is a bit riskier but offers a good price entry. On the other hand, if the price revisits 128.66 and gives confirmation, we can enter from there.
📈 However, the main trigger for spot entry is the breakout of the 255.96 top. Breaking this level can unlock some very ambitious targets. If that happens, I’ll definitely update the analysis and provide those targets.
📅 Daily timeframe
In this timeframe, we can see the price action in more detail. A small range box has formed between 144.11 and 164.74, and the price is currently stuck below the top of the box and reacting to it.
✨ If 164.74 breaks, we can enter a long position. The next major resistance is 183.54. A breakout above that will serve as the main confirmation for a long position targeting 255.96, which can also be used as a spot trigger.
💥 The RSI oscillator is now above the 50 zone, and if it enters the Overbuy area, it will serve as strong momentum confirmation for this position.
✅ If the price gets rejected from the top, we can also open short positions on lower timeframes. A break below 144.11 will be the main short trigger.
📝 Final Thoughts
This analysis reflects our opinions and is not financial advice.
Share your thoughts in the comments, and don’t forget to share this analysis with your friends! ❤️


The euro's bearish structure remains unchanged.EUR/USD rebounded from around the three-week low of 1.1655 during the European session. However, the overall trend of the exchange rate remains within the descending channel that has been in place since early July. Market concerns over the U.S. government's new 30% tariff measures have dampened risk appetite, limiting the room for the exchange rate to rebound.
In the short term, the exchange rate is expected to contend within the 1.1650-1.1700 range. Analysts believe that if the euro fails to break through and stabilize above the 1.1700 threshold, the bearish structure will remain intact, and the exchange rate will continue to test lower support levels such as 1.1630 and 1.1600. A breakdown below these levels could open up further downside space, with the target pointing to around the lower Bollinger Band at 1.1387.
you are currently struggling with losses,or are unsure which of the numerous trading strategies to follow,You have the option to join our VIP program. I will assist you and provide you with accurate trading signals, enabling you to navigate the financial markets with greater confidence and potentially achieve optimal trading results.

XAUUSD – M15 Buy Setup⚡️XAUUSD – M15 Buy Setup
We’re back to business at a key decision point! Here’s what makes this a compelling opportunity:
📍Buy Setup on M15:
1️⃣ Price tapped into a strong support zone around 3333 – a level with proven reaction history
2️⃣ Third touch of the descending channel – possible breakout setup / bullish flag on HTF
3️⃣ A strong bullish engulfing candle closed above the previous daily close, showing buyer strength
4️⃣ Supported by the H4 MA zone acting as dynamic demand
🔥 Everything aligns technically for a high-probability bounce – but remember:
Strong setup ≠ guaranteed outcome.
We trade probabilities, not certainties.
🚀 Go for it guys... but manage your risk like a pro!
#XAUUSD #Gold #BuySetup #PriceAction #ChannelBreakout #SmartMoney #ChartDesigner #MJTrading #Forex #TradeIdea

XUA/USD) Bullish Analysis Read The captionSMC trading point update
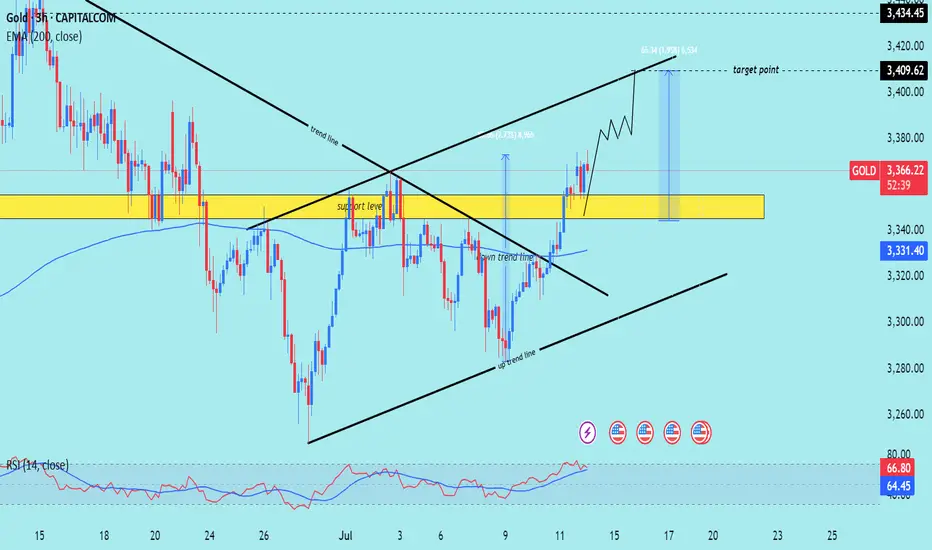
Technical analysis of Gold (XAU/USD) analysis on the 3-hour
---
Gold (XAU/USD) 3H Technical Analysis Summary
Market Structure: Bullish breakout
Price has successfully broken above both the downtrend line and the support zone (highlighted in yellow), signaling a shift in structure from bearish to bullish.
Key Support Zone:
The yellow zone (~3,335–3,355) was previously a resistance area. After the breakout, it is acting as a strong support level and has been retested.
Trendlines:
Downtrend line: Broken and retested.
Uptrend line: Guiding current price action, supporting higher lows and forming an ascending channel.
200 EMA (blue line):
Price is trading above the EMA 200 (~3,331), confirming bullish bias and providing dynamic support.
Momentum (RSI 14):
RSI is around 67.85, showing strong bullish momentum.
Nearing overbought, so a minor pullback or consolidation could occur before continuation.
Volume:
Increase in buying volume near breakout area suggests institutional interest or strong buyer conviction.
Mr SMC trading point
---
Conclusion:
Price has shifted into a bullish continuation pattern.
A successful break and retest of structure and trendlines increases the likelihood of further upside.
As long as price holds above the yellow support zone and the uptrend line, bullish momentum is favored.
Short-term pullbacks may offer new long opportunities.
---
Please support boost 🚀 this analysis)
ETH | USDWe should monitor the megaphone formation. There's a strong possibility of a move to the targets identified by the breakout. Below, the green line and the megaphone's lower band I identified are excellent entry levels.

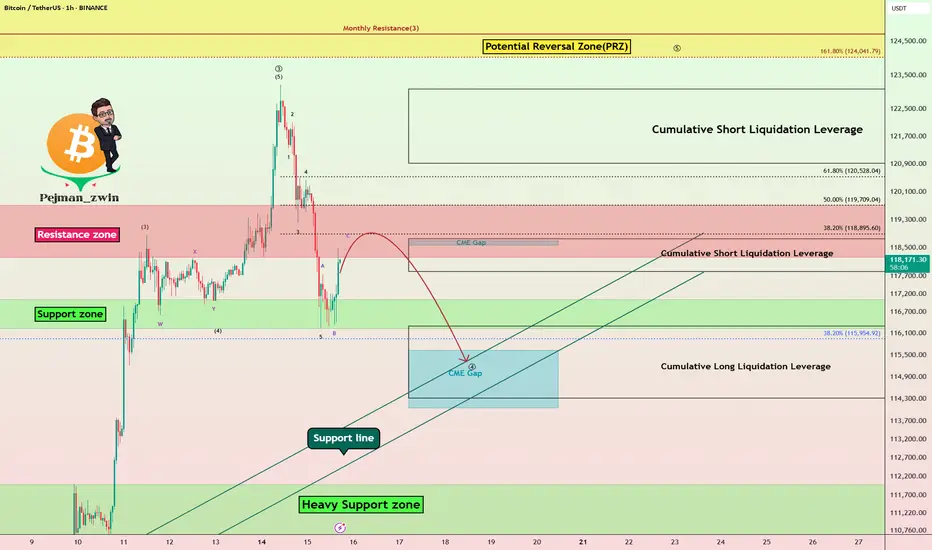
Bitcoin Struggles Below $120K:Will the CME Gap Pull Price Lower?Bitcoin ( BINANCE:BTCUSDT ) has been experiencing a high momentum bullish trend in recent days, which few people expected, especially when it crossed $120,000 . However, in the past 24 hours , Bitcoin has fallen back below $120,000 .
Bitcoin is currently trading in the Resistance zone($119,720-$118,240) and Cumulative Short Liquidation Leverage($118,757-$117,829) on the 1-hour time frame .
In terms of Elliott Wave theory , Bitcoin appears to be completing a main wave 4 . Main wave 4 is likely to have a Zigzag Correction(ABC/5-3-5) .
I expect Bitcoin to attack the Support lines and fill the CME Gap($115,060-$114,947) in the next hour.
Cumulative Short Liquidation Leverage: $123,087-$120,922
Cumulative Long Liquidation Leverage: $116,305-$114,325
Do you think Bitcoin can create a new ATH again?
Note: Stop Loss(SL)= $121,000
Please respect each other's ideas and express them politely if you agree or disagree.
Bitcoin Analyze (BTCUSDT), 1-hour time frame.
Be sure to follow the updated ideas.
Do not forget to put a Stop loss for your positions (For every position you want to open).
Please follow your strategy and updates; this is just my Idea, and I will gladly see your ideas in this post.
Please do not forget the ✅' like '✅ button 🙏😊 & Share it with your friends; thanks, and Trade safe.
GBPUSD ANALYSIS After seeing the previous day close bearish we can expect the market to continue in to support area of 133.750 but a slight retracement could be in play before further push down

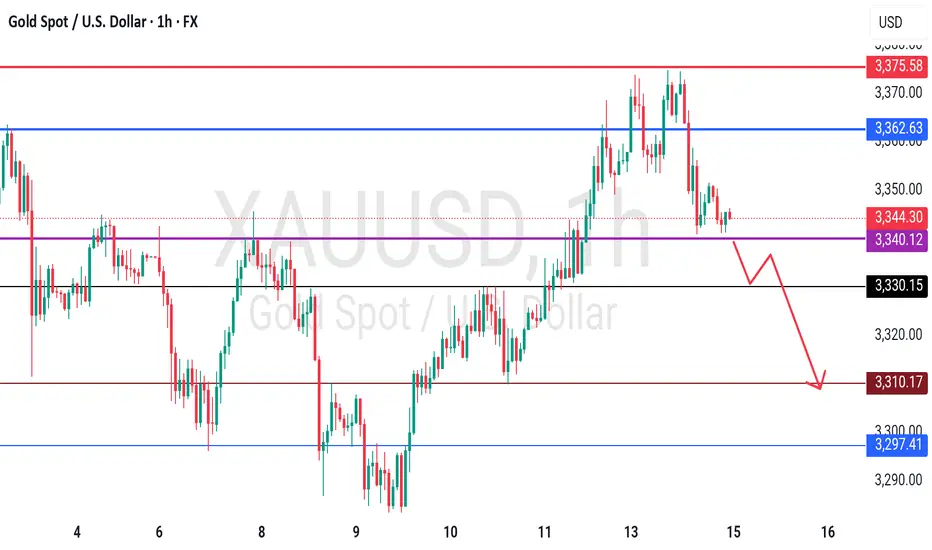
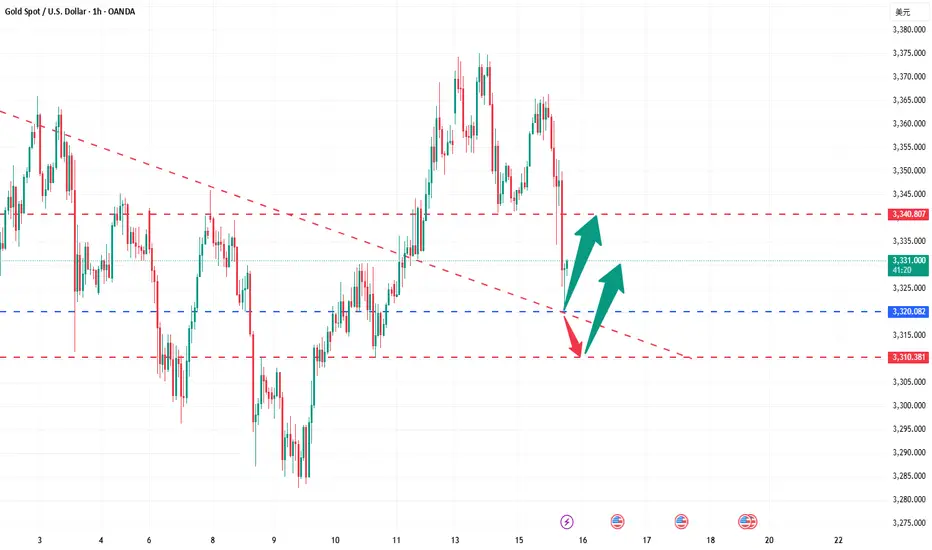
GOLD - CUT n REVERSE area, what's next??#GOLD ... perfect move as per our video analysis and now market just reached at his today most expensive area, that is 3340-41
Keep close that area and only holding of that area can lead us towards further bounce otherwise not.
So keep in mind we should didn't holda our longs below 3340-41
And obviously we will go for cut n reverse below 3340-41 in confirmation.
Good luck
Trade wisely
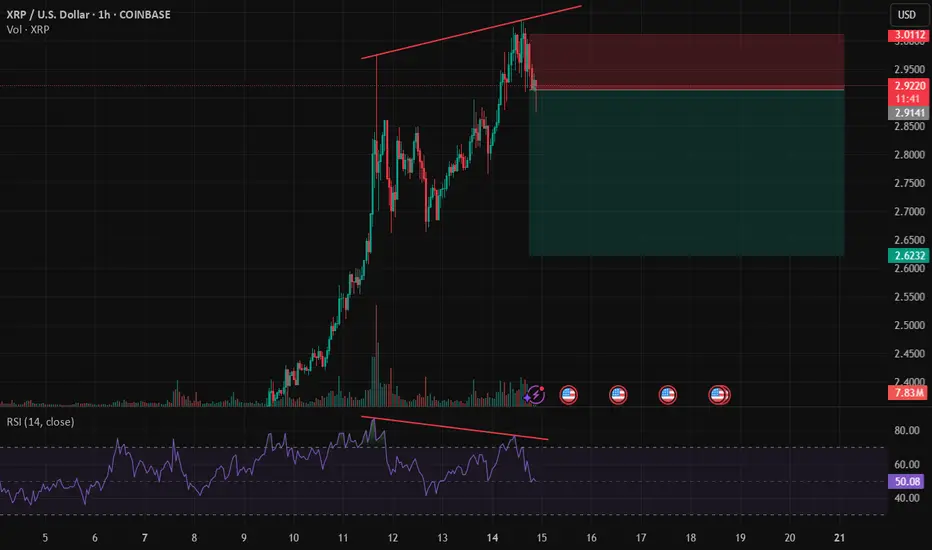
Double topA short term correction on this double top as the RSI is loosing momentum, providing a regular divergency. It could be sellers taking advantaged of high price, buyers taking profit or trapped buyers from previous highs getting out.
SOL - Excellent Trade Opportunity- Trade is giving us a trade with huge potential with huge risk reward ratio.
- Currently price is heading towards teh support around 160 range and this is strong support zone.
- I'm expecting price to bounce back from this zone and head towards the next target of 200 range
Entry Price: 163
StopLoss: 148
TP1: 172
TP2: 182
TP3: 200
Stay tuned for more updates.
Cheers
GreenCrypto

How to find stable trading opportunities in gold fluctuations?Today, the rhythm of gold going short first and then long is perfectly grasped. Congratulations to those who followed the trading plan for reaping good returns. We are still holding long orders at present, and the overall position is arranged around the idea of stepping back to low and long. From the current market structure, the 3325-3320 area below is an important dividing line for the bulls to be strong, and it is also a key support level that determines the subsequent direction. If this area stabilizes, the short-term structure will still be bullish and unchanged, and the rhythm of stepping back to low and long is expected to continue. It is expected that gold will rebound to 3340-3350 and the upper target again. If 3320 is lost, it is recommended to stop loss as soon as possible, and the defense position is recommended to be set below 3315 to prevent the short-term structure from turning short and bringing further callback risks. The core of this round of trend is that only by holding the support can we be qualified to talk about rebound; if the support is lost, we need to turn decisively to prevent being passive. The current market volatility has intensified, but the direction has not yet completely broken. The focus of operation is still on entering the market around key points, switching positions between long and short positions to find the rhythm, blindly chasing orders and emotional operations will be taboos in the current market. Opportunities are not absent, but they belong to those who are always ready. The structure is not broken and the low and long will not change.
Bullish continuation?The Ethereum (ETH?USD) is falling towards the pivot which is a pullback support and could bounce to the 1st resistance.
Pivot: 2,821.91
1st Support: 2,649.43
1st Resistance: 3,077.96
Risk Warning:
Trading Forex and CFDs carries a high level of risk to your capital and you should only trade with money you can afford to lose. Trading Forex and CFDs may not be suitable for all investors, so please ensure that you fully understand the risks involved and seek independent advice if necessary.
Disclaimer:
The above opinions given constitute general market commentary, and do not constitute the opinion or advice of IC Markets or any form of personal or investment advice.
Any opinions, news, research, analyses, prices, other information, or links to third-party sites contained on this website are provided on an "as-is" basis, are intended only to be informative, is not an advice nor a recommendation, nor research, or a record of our trading prices, or an offer of, or solicitation for a transaction in any financial instrument and thus should not be treated as such. The information provided does not involve any specific investment objectives, financial situation and needs of any specific person who may receive it. Please be aware, that past performance is not a reliable indicator of future performance and/or results. Past Performance or Forward-looking scenarios based upon the reasonable beliefs of the third-party provider are not a guarantee of future performance. Actual results may differ materially from those anticipated in forward-looking or past performance statements. IC Markets makes no representation or warranty and assumes no liability as to the accuracy or completeness of the information provided, nor any loss arising from any investment based on a recommendation, forecast or any information supplied by any third-party.

Setupsfx_ | SILVER: Preparing For Another Bullish Move! There are two buying areas we believe could reverse the price trend, which would be a significant move in silver price history. We may even see it go above $40 for the first time. Silver is becoming a secondary best option to invest in the global market, but it will never surpass gold at least for now.
Good luck and trade safely!
Team Setupsfx_

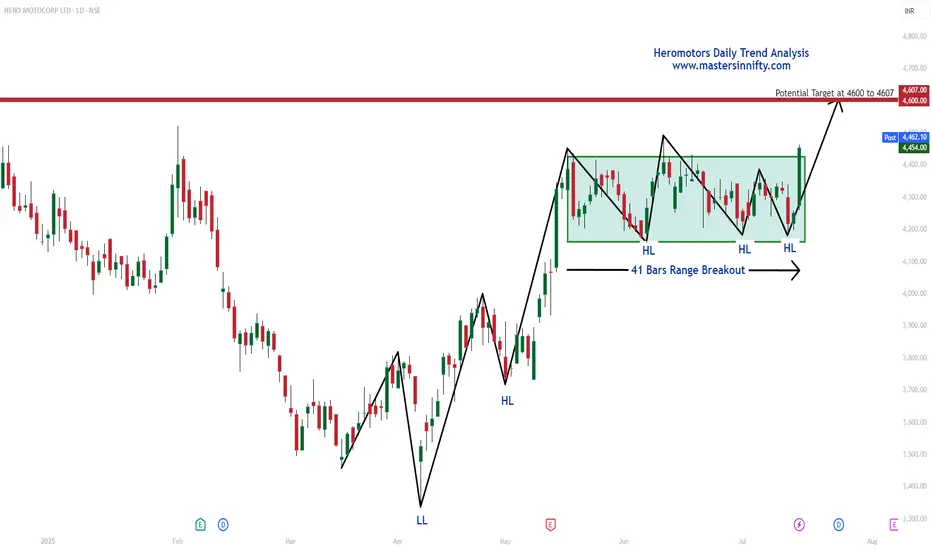
Heromotors Daily Trend Analysis"As per my Daily Trend Analysis, Heromotors Ltd has broken out of a 41-bar range and closed above it today. This breakout indicates a potential upward move toward the resistance zone of 4600 to 4607 in the coming sessions.
Traders are advised to perform their own technical analysis and ensure proper risk management before entering the trade."
ETH — 3D OB + FVG Swing Long | #3D | BULLISH1️⃣ Buy zone: 2,500–2,600
2️⃣ TP: 3,280–3,495
Stop: < 2,500
Alert: FVG fill

EUR/USD Daily OB Analysis – ICT-Based SetupEUR/USD Daily OB Analysis – ICT-Based Setup
This is a clean ICT-style analysis of EUR/USD on the Daily timeframe.
A Daily Bullish Order Block (OB) has been identified in the Discount zone.
The OB ranges between two psychological levels:
1.15500 – Mid Figure
1.15000 – Big Figure (key liquidity level)
The market is currently approaching this OB, and the region is well aligned with the principles of PD Arrays (Premium/Discount Arrays) from ICT methodology.
The OB is considered valid as price action broke market structure (BOS) after the OB was formed, confirming institutional interest at that level.
We are now watching for potential bullish confirmation signals (MSS, SMT divergence, or bullish FVGs) on lower timeframes like H1 or M5 as price taps into the OB zone.
This setup offers a high-probability long opportunity, especially if price reacts from the 1.15000 big figure level with bullish price action.

EURJPY IDEA After seeing the previous day close with bullish momentum we could expect continued push to the upside but since the 4hr is trading at a HH area a slight retrace could occur before the next bullish move to the upside

"High Probability Gold Buy Setup | FVG + MSS + Order Block StratThis strategy is focused on a high-probability buying opportunity in XAUUSD.
If gold drops into the marked demand zone where the Day 1 FVG remains unfilled, and we observe a clear MSS on the 5-minute chart, then a rejection followed by entry at the Order Block becomes highly favorable.
For stronger confirmation, monitor the 15-minute MSS near the deeper zone, which is labeled as the "most powerful buying area."
Key elements:
Day 1 Fair Value Gap (FVG)
Market Structure Shift (MSS)
Order Block Entry
Strong Demand Zone reaction
Ideal for traders looking to combine precision entries with smart money concepts.

Gold and DXY. Day before CPI 14.07.2025, MondayExplaining about the thoughts on CPI. Expect major movements on GOLD
