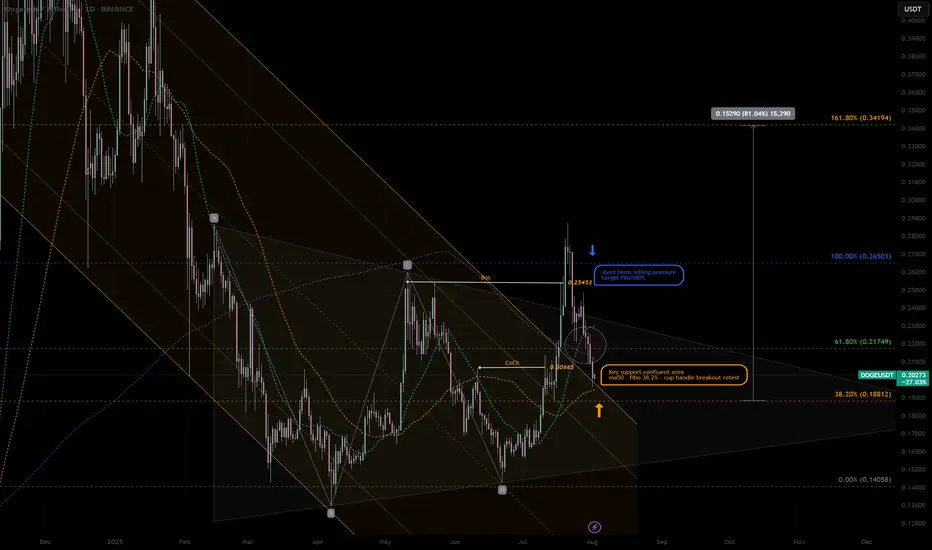
DOGEUSDT|Pullback Confluent Support -cup&handle next ext. +80%DOGE - retraced at the confluent support zone, high potential pullback buy position:
- SMA50 Dynamic support—often attracts mean-reversion buys.
- cup & handle support retest Price retested prior breakout zone—flips resistance to support.
- key 38% Fib “sweet spot” pullback level after corrective moves.
- Previous Change of Character marks shift from bearish to bullish structure—support confluence.
Potential Entry & Risk Management
Entry Zone
- Aggressive: immediate handle breakout support
- Conservative: Wait for liquidity pattern and re-bounce confirmation candle above SMA50
Stop-Loss
-Below Cup Handle low -10% larger position prior swing high RR:2.5/1
-Suggested SL: previous low -0.17 USDT - 5% below entry
Initial Targets
-Key resistance 61.8% Fib retracement — 0.217 USD
-100% Prior swing high — 0.26 USD
-162% Next extended target - 0.35 USD
Trade Rationale
-Mean-reversion into SMA50 and Fib 38.2% zone aligns multiple buyers.
-Pattern support: Cup & handle retest confirms breakout strength.
-Structure flip: CoCh zone indicates bullish regime shift.
Watch-Outs
-Rejection below 0.188 USD erodes support cluster—invalidates setup.
-Rising volume on bounce is crucial—low-volume lifts often fail.
-Beware broader market sell-offs impacting altcoins.
Next Steps:
-Monitor 4-hour candlestick close inside entry zone.
-Check volume spike on reversal candle.
-Adjust risk dynamically if price gravitates toward upper channel resistance.
Always trade with affordable risk and respect your stop..
Trend Analysis
DXY LONGi am looking to go long on DXY from this level of breaker block.. a possible pullback to this level we will engage on the buy and use itr as cross reference for our dollar pairs ..

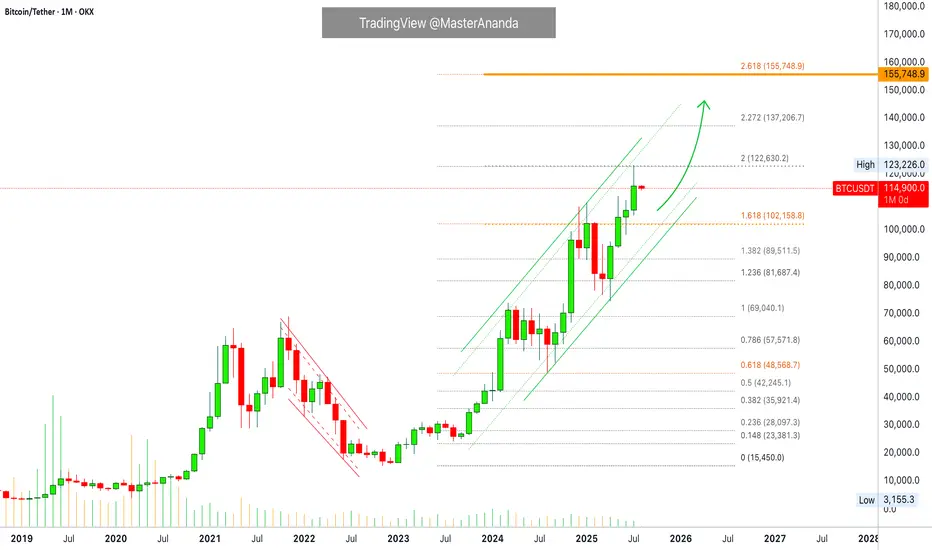
Bitcoin Monthly · Parabolic Rise ContinuesLast month Bitcoin produced its best numbers ever. The highest wick and close, a new all-time high at $123,226.
Bitcoin is not exhausted on the monthly timeframe but there is room for a retrace before the month ends. Think of the first part of the month being mixed, neutral or even bearish while the second half becomes full time bullish.
The levels that are relevant are $122,000 on the bullish side and $102,000 on the low. Right now the action is happening close to the middle so anything goes.
In 2020 Bitcoin produced 7 monthly candles growing and this was repeated again in 2023. In 2025 we have so far four green candles which means that Bitcoin can easily continue to grow. It has been known to produce more than four months green many times but there can be exhaustion at some point.
Bitcoin has been moving within a strong uptrend and is likely to continue rising. Bullish until the chart says otherwise. We are going up. Short-, mid- and long-term.
As Bitcoin consolidates near resistance, the altcoins will continue to build strength in order to grow. Remember, we are still looking at bottom prices across thousands of altcoins. Only a few moved ahead and are trading at all-time highs, the rest will catch up. The time is now, late 2025. The best is yet to come.
Namaste.
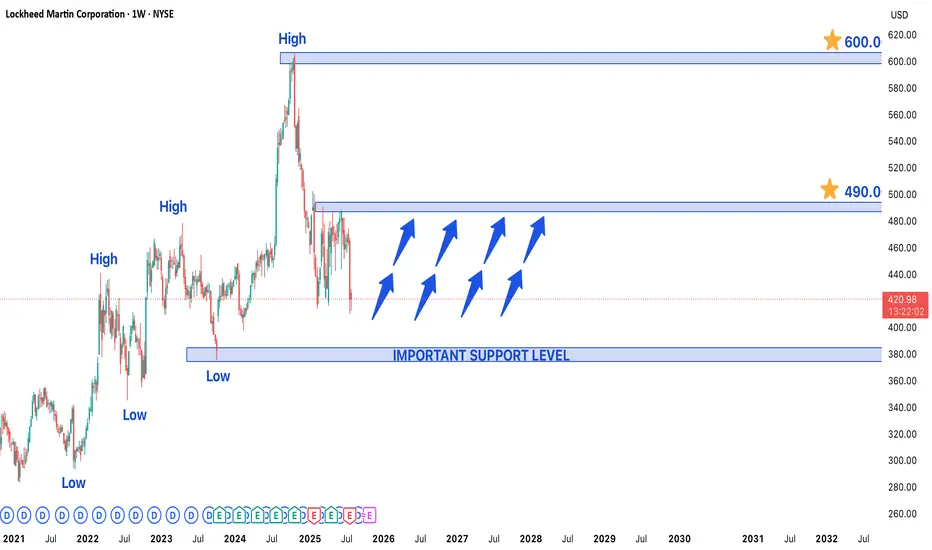
Lockheed Martin Stock in Bullish Trend - Key Levels to watchLockheed Martin (LMT) Stock in Strong Bullish Trend - Key Levels to Watch
Lockheed Martin's (LMT) stock is currently exhibiting a well-defined bullish trend, trading near a recent higher low that may serve as a crucial support level for the next upward move. The defense giant continues to benefit from robust global military spending and a strong contract pipeline, positioning the stock for potential further gains.
Technical Structure & Key Levels
- Higher Low Support: The current price zone represents a critical support area where buyers have previously stepped in, maintaining the upward trajectory
- Upside Targets:
- Near-term: $490 (previous resistance zone)
- Long-term: $600 (potential breakout extension)
- Major Support: $375 would act as strong demand zone if any deeper pullback occurs
Bullish Catalysts Supporting the Trend
1. Defense Sector Strength:
- Record US defense budget allocations for 2024-2025
- Increased NATO military spending amid global tensions
2. Contract Backlog:
- F-35 program continues to drive revenue
- Hypersonic weapons and space systems development
3. Technical Momentum:
- Price trading above key moving averages (50/200 DMA)
- Higher highs and higher lows confirm uptrend structure
Trading Strategy Considerations
- Optimal Entry:
- On bounces from current support level
- On breakout above $460 confirmation
- Risk Management:
- Stop-loss below $375 for longer-term positions
- Partial profit-taking near $490 resistance
- Confirmation Signals:
- Volume increase on upside moves
- Sustained closes above $460
Potential Risks to Monitor
- Geopolitical shifts affecting defense budgets
- Program delays (particularly in F-35 production)
- Broader market corrections impacting defense sector
Long-Term Outlook:
The combination of fundamental strength and technical positioning suggests LMT could progress toward $490 near-term, with $600 as a viable long-term target if the bullish structure holds. Traders should watch price action around current levels for continuation signals while remaining mindful of the $375 support as a critical level for the bullish thesis.
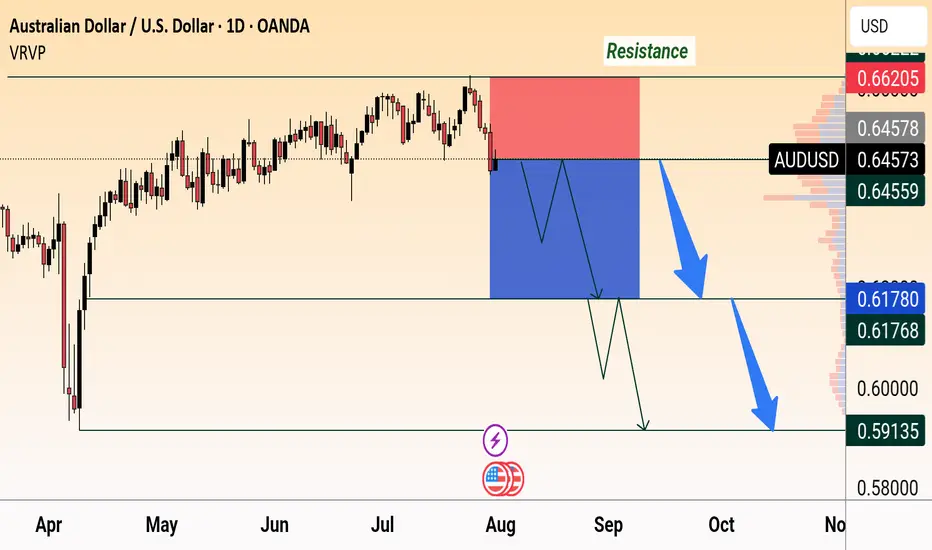
AUD/USD Bearish OutlookAUD/USD faces strong resistance at 0.6620 and is showing bearish momentum. Price is expected to drop below 0.6450 with targets near 0.6178 and 0.5913, following a possible consolidation.
Pudgy Penguins (PENGU): Huge Volatile Movement IncomingPengu coin seems to be in a pretty dangerous zone; while we are hovering near the ATH and seeing some smaller pullback prices, we are yet to see the potential huge breakout take place or breakdown happen.
We have marked 2 zones to keep an eye on; if either of those zones is broken, a huge volatile movement will happen so be careful!
As long as we are above the Sell Zone, we are going to look for more MSB areas for smaller long scalps!
Swallow Academy

Cosmos 365 · Proof of Bullish · Bull Market Wave NextCosmos (ATOMUSDT) has been sideways for an entire year now. The current trading range is a long-term support, buy and accumulation zone. This zone is already proven to be a bullish launchpad based on late 2024. The same levels were active in August-October-November 2024 leading to a mild bullish wave. This is only the start.
The same support range is activated again in Febraury-March-April-May-June-July-August 2025 and this will lead to a major bullish wave. Notice that the first period of consolidation lasted only three months and thus we had a mild wave only. With now six full months of consolidation the next bullish wave will be at least twice as big. But the market and how participants act and react doesn't work linearly. A six months consolidation period can lead to a bullish wave that is 3-5 times stronger than the previous one.
What you are seeing right now is actually pretty good. ATOMUSDT is red, yes. Notice weeks of bearish action yet no new lows, no significant challenge of support. More sideways which is as bullish as it gets. We already saw many examples of a downtrend and how the market goes lower and lower always producing new lows. This scenario is far from being what is present on the chart.
ATOM has been dropping for weeks but its price isn't affected that much negatively because this is only a minor retrace. An intermediary pause. The positive side of this type of market behavior is how it tends to unravel. It goes from quiet and shy to fast, surprising and unexpected. The market can change any day.
You can start seeing bullish action tomorrow just as it can start next week or the week above. The retrace has been going long enough and it lacks volume and momentum, sellers are running dry; when momentum dies down, the market turns.
Look at Bitcoin, it isn't dropping anymore. It stopped at the previous high and so far this is a strong support. Even if it moves lower, we continue bullish above $100K long-term. It is normal for a small pause before additional growth. $15 is an easy target, ATOM can grow much more in the coming months. Late 2025-early 2026 are the best dates for higher prices. Buy now and hold.
Namaste.

SP500 → Countertrend correction before growthFX:SPX500 is correcting against an upward trend. In the second half of the week, the market received fairly positive fundamentals during the reporting period.
S&P 500 futures found support after strong reports from Meta and Microsoft, which exceeded earnings expectations and forecasts thanks to AI. The rise in futures supported demand for the “Magnificent Seven” despite Powell's hawkish comments. The focus is on Apple and Amazon reports in the evening, which could strengthen the tech rally. On Friday, we are seeing a countertrend correction in which the market is testing the 6288 zone of interest.
Support levels: 6288.4, 6262.6
Resistance levels: 6342, 6371
Most likely, the market will form a false breakout of support during the correction. If the bulls keep the index above the key level, we can expect continued growth in the short and medium term.
Best regards, R. Linda!

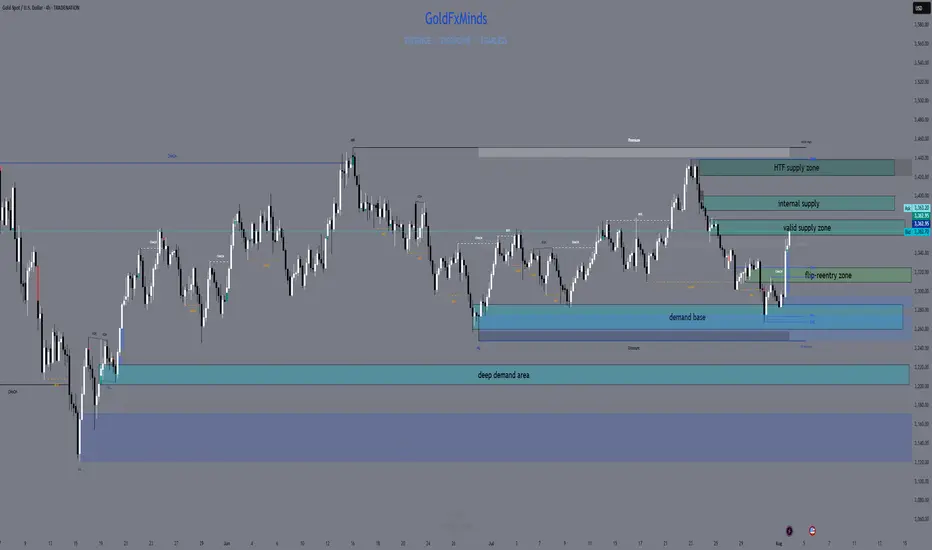
XAUUSD H4 Outlook – August 4, 2025Structure is bullish — but supply is layered. Precision now matters more than bias.
—
Gold is trading at 3362, sitting right inside the heart of a key structural zone. After a strong breakout from 3285–3260, price reclaimed imbalance, broke internal structure, and powered higher into premium. The trend is bullish — but we’ve just stepped into stacked supply.
Let’s break down every zone that matters now, from top to bottom:
🟥 3360–3375 – Valid H4 Supply Zone
This is the first active supply block — the origin of the last bearish leg. It holds a clean OB + imbalance and is currently being tested for mitigation.
We're inside it right now. This zone is critical:
→ If price breaks and holds above it, continuation is likely
→ If we reject here, it confirms sellers are defending their level
🟥 3385–3398 – Internal Supply Trap
A secondary supply zone built from previous order flow.
If bulls push through 3375 without rejection, this is the next area to watch for weakness.
This zone often creates fake breakouts, especially when momentum slows. RSI is already showing signs of exhaustion approaching this level.
🟥 3420–3440 – HTF Supply Trap
This is the top — the last unmitigated supply on the weekly.
It's not in play yet, but if bulls break above 3398 decisively, this is where the bigger trap could form.
Any long into this zone must be backed by strong structure and continuation candles — otherwise, it’s a liquidation magnet.
🟫 3322–3310 – Flip Reentry Zone
If we reject from current supply, this is the first high-probability reentry for bulls.
It’s where the last CHoCH confirmed, and it aligns with EMA confluence and minor imbalance.
Buy setups from here must be confirmed on M15/M30 — no blind longs.
🟦 3285–3260 – Breaker Demand Base
The true origin of the bullish move.
This zone caused the structural flip — clean OB, FVG stack, and liquidity sweep.
If price returns here, it becomes a must-hold for bullish continuation. One of the best sniper zones for longs.
🟦 3222–3205 – Final Demand Layer
Deep structure zone holding imbalance + previous HL base.
Only comes into play if 3260 fails. A break below this would shift bias to neutral or bearish on H4.
🎯 Bias Summary
✔️ H4 bias = bullish
✔️ Price is inside 3360–3375 supply
✔️ EMA 5/21/50 aligned, but RSI is elevated
⚠️ This is not a breakout — it’s a test zone
🔁 Execution Plan
📍 Rejection from 3360–3375 → sell scalp toward 3322
📍 Clean break of 3375 → watch for next short at 3385–3398
📍 Failure of 3398 → HTF draw toward 3430–3439
📍 Pullback toward 3322–3310 → potential long zone
📍 Clean drop to 3285 → high-RR buy area
📍 Break below 3260 → only valid demand left is 3222
—
This is not the time to chase. It’s the time to stalk.
You’re in premium. Supply is active. Let structure decide — you just execute with clarity.
—
Which zone are you watching for your next move?
Comment your bias below 👇🏼 Smash the ❤️ if this brought clarity, and follow GoldFxMinds to trade with precision every day.
Disclosure: Chart based on Trade Nation feed (TradingView).
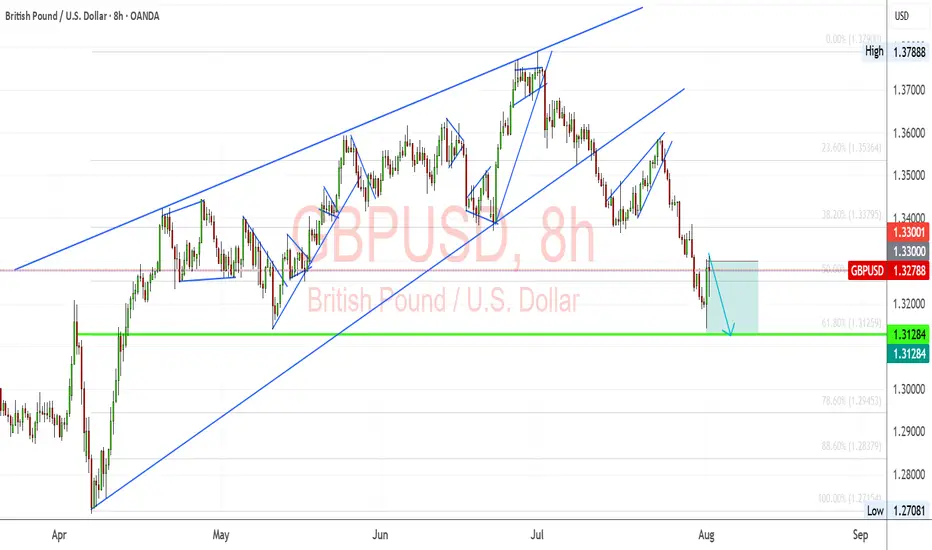
GBPUSD: Bearish Momentum vs. Fundamental Repricing – Key LevelsGBPUSD is at a critical juncture, balancing a clear technical breakdown with a fundamental backdrop favoring near-term volatility. The pair has slipped from its rising wedge structure and is now testing key retracement zones while markets reprice expectations for Fed rate cuts after weak US jobs data. Traders are closely watching whether this bearish momentum will extend toward the 1.3128 support or if a rebound from oversold conditions could trigger a corrective bounce.
Technical Analysis (8H Chart)
Pattern: Clear breakdown from a rising wedge, confirming bearish bias.
Current Level: Price sits near 1.3278, struggling to reclaim the 1.3300 resistance zone.
Key Support Zones:
1.3128 (61.8% Fibonacci retracement) – main bearish target.
1.2945 (78.6% retracement) – extended downside target if selling pressure deepens.
Resistance Levels:
1.3300 (immediate resistance, prior support now flipped).
1.3380 (secondary resistance if a retracement rally occurs).
Projection: Likely bearish continuation toward 1.3128, with a potential retest of 1.3300 before continuation.
Fundamental Analysis
Bias: Bearish in the short term, but Fed policy and risk sentiment remain key drivers.
Key Fundamentals:
USD: Weak NFP (73K), higher unemployment (4.2%), and downward revisions boost Fed cut bets (~75% for September), typically a USD-negative factor.
GBP: BOE maintains a cautious stance due to sticky inflation but lacks clear hawkish conviction as growth slows.
Tariffs: US tariffs add a mild negative weight on GBP trade sentiment.
Risks:
Hot US CPI could slow Fed cut bets, supporting USD.
Hawkish BOE comments could limit GBP downside.
Global risk sentiment shifts could either favor USD (risk-off) or weaken it further (risk-on).
Key Events:
US CPI and PPI for USD direction.
BOE policy updates and UK CPI.
US jobless claims and Fed commentary.
Leader/Lagger Dynamics
GBP/USD is a lagger, mainly reacting to USD shifts. However, its moves directly influence GBP crosses such as GBP/JPY and GBP/CHF.
Summary: Bias and Watchpoints
GBP/USD remains in a bearish phase, targeting 1.3128 with a potential corrective bounce toward 1.3300 first. The primary driver is the technical breakdown, while fundamentals add volatility around US CPI and BOE policy. If CPI surprises lower, the bearish outlook could reverse into a short-term rebound; if CPI is hot, downside momentum could extend. You should monitor USD-driven events closely as GBP/USD sets the tone for broader GBP movements.
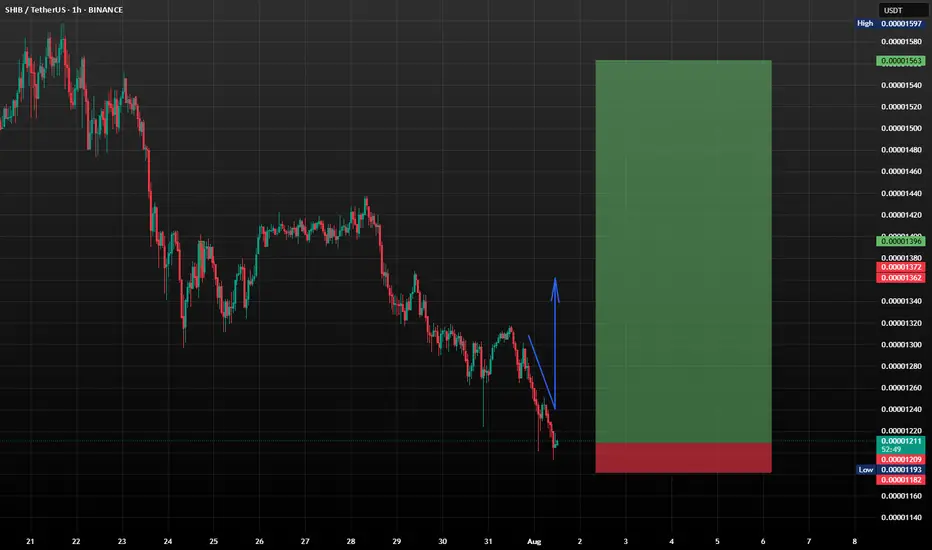
SHIB/USDT: Shiba Inu Setting Up for a Bullish Reversal?Shiba Inu (SHIB) is currently trading around $0.00001208, showing signs of stabilizing near a key support zone after a recent pullback. The market appears to be forming a rounded double bottom pattern, which could evolve into a strong W-shaped bullish reversal if confirmed with volume and breakout above short-term resistance (~$0.0000135).
This level could be pivotal for long-term accumulation.
What to Watch
*Key Support Zone: $0.00001200 - price is holding this level firmly.
*Short-Term Resistance: $0.0000135 - a breakout could confirm bullish continuation.
*Indicators: RSI is cooling off after a high, which could provide momentum for a new leg up.
SHIB may be quietly setting the stage for a powerful recovery. This support level looks like a gift for those with patience and vision. DCA smartly, monitor dips, and don’t panic, because when this pattern breaks out, you’ll wish you had loaded up earlier.
This isn't about hype...it’s about positioning. Stay disciplined. Stick to your plan. SHIB might just surprise everyone again.
$BTC DO NOT BE REKT!bitcoin can create an accumulation process in the mini timeframe after the major rally, which will serve as fuel before another parabolic run

GBPUSD is in Bearish Reversal Head & ShoulderGBPUSD is showing clear bearish head & shoulder pattern on daily chart it will retrace for some time to get close to the price 1.33788 at that point short sell will be good

TradeCityPro | Bitcoin Daily Analysis #141👋 Welcome to TradeCity Pro!
Let’s dive into Bitcoin analysis. Yesterday, the exact bearish scenario I told you about happened. Let’s see what opportunities the market is offering us today.
⏳ 4-Hour Timeframe
Yesterday, I mentioned that the price had tested the 116829 zone too many times and that this area had become very weak. I also said that if the price made a lower high than 120041, deeper corrections would be likely.
✔️ Another perspective I have on the market is that sometimes certain support and resistance levels simply aren’t strong enough to continue the trend.
🔑 For example, in this case — despite Bitcoin being in an uptrend across all cycles — the 116829 support couldn’t hold, and the price broke it to reach a stronger support zone, one that might be capable of continuing the trend.
📊 Right now, this is what might be happening again. Support levels like 0.5, 0.618, and 0.786 Fibonacci retracement zones could be where the next bullish leg begins.
✅ At the moment, price has reached the 0.5 Fibonacci level, and the previous strong bearish momentum has slightly weakened. If you look at the volume, momentum is still in favor of sellers, but based on the long lower wicks on the candles, we can say the bearish trend is showing signs of weakness.
💥 On the other hand, RSI is approaching 30, and in an uptrend, when RSI nears the Oversold zone, it can often be a good entry point for a long. However, we’re not acting on this yet — we’ll wait for more confirmations before opening any positions.
⭐ For now, there’s no trigger for a long position on this timeframe. A break below 115000 could act as a short trigger, but given the trend Bitcoin is in, I’m not opening any short positions at the moment.
⏳ 1-Hour Timeframe
The price has dropped down to 114560, and I believe today we might enter a corrective phase. However, if the price stabilizes below 114560, the correction could continue. The next targets would be the Fibonacci levels from the 4-hour timeframe.
🔽 I won’t open a short position with the break of 114560, and I suggest you don’t take that short either.
📈 If this move turns out to be a fakeout, the first trigger we have now is at 118736, which is quite far from the current price. For this trigger to activate, we’d need to see a V-pattern form.
🔍 There are no other triggers right now. But if more range structure forms, we might consider opening a risky long on the breakout of the range top.
❌ Disclaimer ❌
Trading futures is highly risky and dangerous. If you're not an expert, these triggers may not be suitable for you. You should first learn risk and capital management. You can also use the educational content from this channel.
Finally, these triggers reflect my personal opinions on price action, and the market may move completely against this analysis. So, do your own research before opening any position.

GOLD ROUTE MAP UPDATEHey Everyone,
What a PIPTASTIC finish to the week! 🚀. We tracked the move down with precision durung the week and then rode the momentum right back up.
Yesterday, we confirmed the swing range activation and bounce, and that bullish follow through carried beautifully into today, completing our Bullish Target at 3348. Just perfect execution all around.
BULLISH TARGET
3348 - DONE
BEARISH TARGETS
3328 - DONE
EMA5 CROSS AND LOCK BELOW 3328 WILL OPEN THE FOLLOWING BEARISH TARGET
3305 - DONE
EMA5 CROSS AND LOCK BELOW 3305 WILL OPEN THE SWING RANGE
3289 - DONE
3267 - DONE
We will now come back Sunday with a full multi timeframe analysis to prepare for next week’s setups, including updated views on the higher timeframes, EMA alignments, and structure expectations going forward.
Thanks again for all your likes, comments, and follows.
Wishing you all a fantastic weekend!!
Mr Gold
GoldViewFX

Crypto Market Slows Down For A Pullback Within A Bullish TrendGood morning Crypto traders! Cryptocurrencies are coming slightly lower on the intraday basis due to stock market decline yesterday, but we still see them approaching support, so still be aware of a bounce and recovery at the end of the week or maybe next week because of an upcoming weekend. Crypto TOTAL market cap chart can be trading in wave »y« of a complex w-x-y correction in wave 4, unless it's a flat correction, but support is the same at 3.6T – 3.5T area, from where we may see a bullish continuation within wave 5.

The worst drops often come later!Don’t be fooled by the first crash… The worst drops often come later in a bear market.
Let’s break down the brutal truth about the 2008 GFC and what it teaches us today. 🧵
1.
In the 2007–2009 bear market, the S&P 500 had 7 failed rallies before finally bottoming.
Every bounce looked like the bottom — and every one was a trap.
👇
2.
The early drops were steep:
🔻 Down 11%
🔻 Down 17%
But the most violent crashes came after those…
Near the END — not the beginning — of the bear market.
3.
Later stage declines:
❌ Down 28%
❌ Down 36%
❌ Down 29%
That’s when capitulation kicked in.
Investors gave up. Fear took over.
4.
Capitulation volume isn’t a guaranteed bottom.
It feels like it’s over.
But if fundamentals haven’t turned and the trend isn’t broken, the bear can still bite — hard.
5.
Final crashes are like cliffs:
Markets are exhausted.
Hope is crushed.
And that’s finally when the real bottom shows up.
6.
The lesson?
Bear markets are full of traps.
Relief rallies can fool even seasoned pros.
Stay patient. Wait for trend confirmation. Don’t chase fake bottoms.
7.
📉 The biggest crashes usually happen at the end of the bear market.
That’s the final flush — and it sets the stage for true opportunity.
Learn from the past. Don’t get trapped. Stay sharp.

SHORT EURUSD Possible scenarioWeekly chart of EURUSD show potential short coming next coming weeks . MOMENTUM IS UP but the price is declining ,
Two possiblities AT the moment that can play IF ( BIG IF) the price decide to down in the coming days ,
Green arrow show a bounce from 1.1360 area and red arrow show a possiblity for further down to 1.1090.

Gold at major resistance and at fib 0.618 level breakout ? Gold after breaking the support, now again reached the support level which will be its resistance now, will it break it or get rejected form here. Enter the long only on breakout and retest till then its bearish trend.
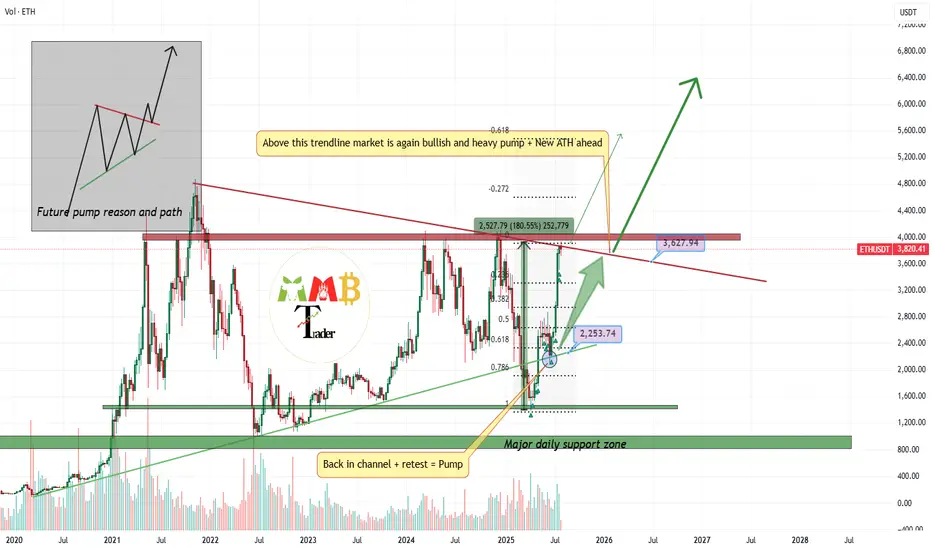
4000$ is last resistance left Ready for breakout and pump?market is still bullish and i am looking for breakout here to the upside for sure But we should consider this factor that major resistance now is touching and we may have first short-term fall.
so for now we may have correction and dump to the targets like 3300$ which is first support of 0.23 Fibonacci level.
and after this healthy correction or without it we can expect more pump and breakout of 4K$ and heavy pump to the targets like 7K$.
DISCLAIMER: ((trade based on your own decision))
<<press like👍 if you enjoy💚
Bitcoin: Expected Cool-Off or Cause for Concern?After rallying more than 25% off the June lows, Bitcoin is finally taking a breather with a much-anticipated pullback. But as expected, the fear meter is spiking, especially across CT.
Was this cool-off really a surprise? Not quite.
The signs were there: price stalling at upper extremes, responsive sellers stepping in at perceived overextensions, and inefficient zones left behind during sharp impulsive moves.
Of course, reading it in real-time is easier said than done. Emotions always complicate execution , but that’s a separate conversation.
In this post, let’s break down the current structure in detail —using volume profile, TPO charts, and market structure analysis, to give you a clearer picture of what’s unfolding. We’ll also explore a few scenarios worth watching as the next move shapes up.
Let’s dive in!
Table of Contents
➺ Volume Profile
➺ TPO
➺ Key Technical Insights
➺ Market Structure
➺ Trade Scenarios and What to Watch
➺ TLDR
⦿ Volume Profile
Currently, we’re seeing two key zones of balance : one broad range that held for over 60 days and a tighter 21-day structure that formed at higher levels. These are classic areas of value where buyers and sellers found temporary agreement, establishing balance.
The sharp move from ~111,000 to ~122,000 was largely impulsive , with little volume built along the way, suggesting initiative buying in early July. As is often the case with such thin zones, they tend to get revisited once momentum fades. That’s exactly what we’re seeing now.
As price dips into this low-volume pocket, the key question is:
Will the market accept this zone and begin building value here, or will it reject and bounce back toward higher ground?
Looking at the Volume Range Visible Profile (VRVP) since June 7th, the nearby Value Area High (VAH) sits around ~111,000 . If current support doesn’t hold, this becomes the next major volume magnet. That said, there’s also a low-volume node (LVN) just above 111,000 , which could act as a demand pocket and trigger a responsive bounce.
In simple terms:
– Acceptance into the LVN could lead to new range formation at lower levels
– A sharp bounce off ~110,000 might reestablish the prior higher balance, or create a fresh range between the two existing areas
The next few sessions will reveal whether the market is hunting for new value or just shaking out weak hands.
⦿ TPO
Zooming into the 4H TPO chart, we can clearly see the evolving monthly profiles from May through August. And as is often the case, the market found resistance right where you’d expect: at the extremes.
The upper end of July’s profile became a battleground. Buyers attempted multiple pushes above that upper balance, but each effort was consistently faded by responsive sellers , signaling growing exhaustion at the top.
Eventually, that pressure gave way to an impulsive breakdown, driven by initiative selling. Notably, price didn’t rotate gently back into the previous range, but it sliced straight into a thin zone of prior low participation.
Now, the market is sitting at the low-volume region , and the next key battle is shaping up. Additionally, The 108,000 to 110,000 area carries weight as it served as the Value Area High (VAH) for both the May and June profiles. If buyers are going to respond, this is one of the more likely places for them to step in.
⦿ Key Technical Insights
▸ Failed Acceptance Above 21-Day Balance
Repeated attempts to hold above the short-term balance were rejected, signaling buyer fatigue and a lack of conviction at higher levels.
▸ Initiative Sellers Took Control
Once demand dried up, sellers stepped in aggressively. The thin participation during the recent rally left little structural support, allowing price to drop quickly.
▸ No Value Built Below Yet
The zone currently being tested saw minimal trading earlier. If bulls want to reclaim control, they’ll need to build value here and establish a new base.
▸ Prior Balance High as Potential Support
Price is now retesting the top of the 60+ day balance area from above, a classic setup where previous resistance can become support. This area also aligns with a known demand shelf.
▸ Deviation Below the 200 MA Cloud
Price has slipped below the 200 MA cloud and is nearing a key flip zone. A test of the 110,000 level next week wouldn’t be surprising. That area could serve as a strong support zone where a new accumulation phase begins.
⦿ Market Structure
The broader market structure points to a transition in progress. After spending over two months in balance , price broke out to the upside —only to form another short-lived range at higher levels. That, too, gave way to a swift breakdown.
This kind of “failed acceptance at higher prices” is often an early signal that the market may revisit prior zones of interest, typically areas where value was last built.
All eyes now shift to the 110,000–111,000 zone , the high of the previous 60-day balance.
We’re in a classic test-retest phase, where the market is probing for conviction . These moments often set the stage for the next significant move, either continued distribution lower, or the beginning of a re-accumulation phase.
⦿ Scenarios & What to Watch
As Bitcoin pulls back into key structural zones, several scenarios are in play. Here's what to monitor in the coming sessions:
Scenario 1: Re-Acceptance into 21-Day Balance
▸ If price reclaims and holds above ~116K, we could see a rotation back toward the upper end of the short-term balance near ~120K.
▸ This would suggest the recent breakdown was a failed auction or bear trap, not the start of a broader trend reversal.
▸ Watch for initiative buying above the demand shelf with follow-through volume.
Scenario 2: Choppy Mid-Balance Activity
▸ Price remains range-bound between ~110K and ~116K, forming a new short-term balance zone.
▸ Expect slower movement and back-and-forth behavior as the market decides its next direction.
▸ Patience is key here. Watch volume and initiative behavior to gauge strength.
Scenario 3: Rejection and Continuation Lower
▸ If price fails to hold above ~110K, there’s potential for a move down to the POC near ~104K, or even deeper toward ~100K (Value Area Low).
▸ These are low-volume zones, which rarely offer strong support unless new value is built.
▸ This would signal a continuation of the current imbalance and potentially mark a structural trend shift.
I’m primarily focused on Scenario 1 and 2 , as we appear to be in a late bull phase. A deeper pullback toward 100K increases the risk of a broader trend change, making it less attractive from a risk/reward standpoint.
⦿ TLDR
▸ Buyers failed to hold the top of the 21-day balance. Clear signs of exhaustion.
▸ Price dropped into a prior low-volume zone, which now acts as potential demand.
▸ This area has never been accepted before - either buyers step in, or we go lower.
▸ Reclaiming ~116K could fuel a move back toward 120K+.
▸ Failure to hold ~110K opens the door to 104K, maybe even 100K.
What happens next week will likely set the tone for the next major move. Watch how the market responds to acceptance vs rejection zones, and let price action confirm your bias before you act.
If you found this analysis helpful, share it with someone who trades Bitcoin. 🥰
What’s your read on the current structure? Let me know in the comments! 📉
⚠️ Disclaimer
As always, this post is purely for educational purposes. I am not a financial advisor, and nothing here should be taken as financial advice. Always consult your financial advisor before making any investment or trading decisions. Or at the very least, consult your cat. 🐱

EURGBP, Bullish Breakout!!!EURGBP after getting rejected from the support we can expect again a upside movement.
I am expecting a movement from 0.86500 to 0.8700 at least, we can plan sl below 0.86300.
Safe Player wait for proper breakout and wait for retest of 0.8650 area.

Do you think I'm joking ???As I said, Bitcoin broke the triangle, and now with a slight price correction(109k), it could surge to $150k , and you still think I'm joking!!
Previous analysis
