XAU/USD: Bullish Rebound from Support ZoneMarket Overview:
Gold tested and respected a key support zone around 3340–3345, aligning with the 144-period EMA and a prior accumulation area. The market is showing signs of bullish recovery, with a potential ABCD continuation pattern suggesting further upside toward key resistance levels.
Technical Signals & Formations:
— Rising trend channel remains intact
— Correction found strong support at demand zone
— EMA(144) acts as dynamic support
— Emerging bullish structure suggests continuation toward higher highs
Key Levels:
Support: 3340–3339, 3282
Resistance: 3366, 3375, 3394, 3410
Scenario:
Primary: holding above 3340 may trigger a rally toward 3375, 3394, and 3410.
Alternative: a break below 3339 would shift focus toward the 3282 zone.
Trend Analysis

US30 SCALING OPPORTUNITYThere could be a potential scaling opportunity on US30. I have secured partials on this instrument so scaling up will have to be done very carefully with little risk.
Remains Below 1.3700 Ahead of CPI Data from the US and CADUSD/CAD Remains Below 1.3700 Ahead of CPI Data from the US and Canada
USD/CAD continues to decline ahead of inflation data from both the US and Canada.
The US inflation rate is expected to rise to 2.7% year-over-year in June, up from 2.4% recorded in May.
Meanwhile, Canada’s CPI is forecasted to increase by 1.9% year-over-year in June, up from 1.7% in May.
USD/CAD is trading around 1.3690 during the European session on Tuesday, following two days of gains. The pair is declining as the US dollar (USD) continues to weaken ahead of the June CPI data from the US. The inflation figures will provide new insights into the Federal Reserve's (Fed) monetary outlook.
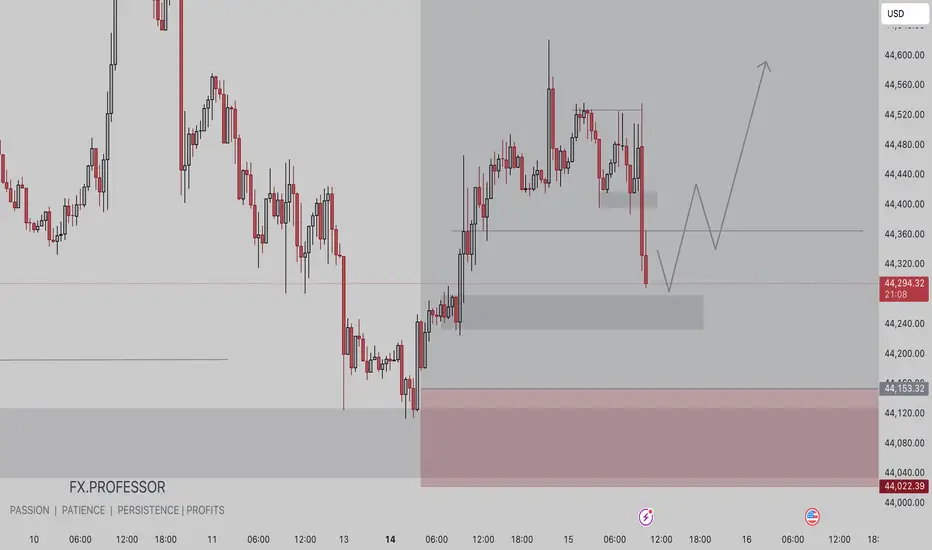
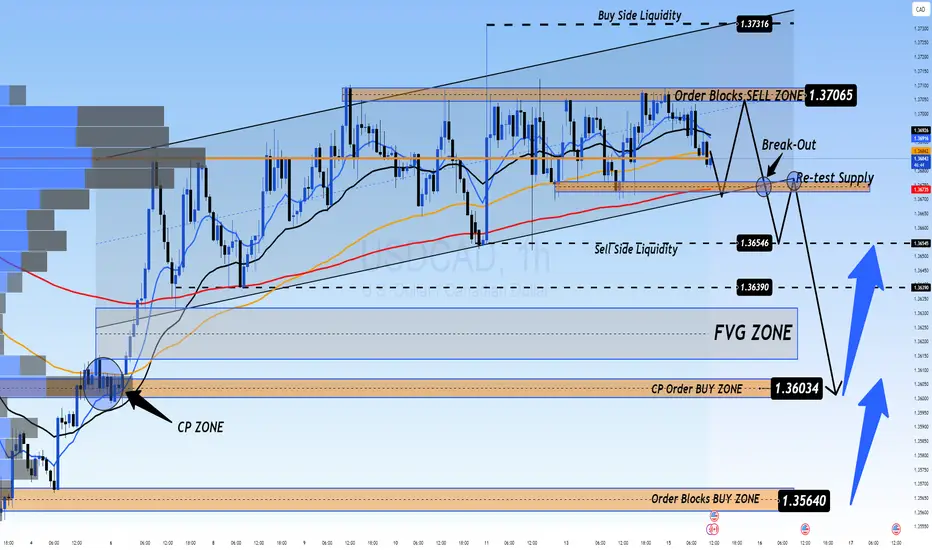
📉 Market Outlook for USD/CAD – Possible Drop on CPI Release
The USDCAD is still in a downtrend, and a sharp drop could occur with today’s CPI data release. Currently, there are two Buy Side Liquidity zones above and Sell Side Liquidity below, with the price balanced around the VPOC zone, which will soon decide the direction after the CPI announcement today.
Market liquidity still holds a FVG below, and with CPI data expected to favor USD, this could trigger a sharp drop towards this liquidity zone, possibly nearing CP OBS at 1.3600, followed by a potential rebound.
If price breaks CP zone, it may head toward a strong OB zone near 1.35xxx. Therefore, caution is advised when monitoring these OB zones.
🎯 Trading Strategy for Today
🟢 BUY ZONE: 1.36000
SL: 1.35500
TP: 1.36500 → 1.37000 → 1.37500 → ????
💬 What are your thoughts on USD/CAD ahead of the CPI data release? Do you expect a strong bounce or a continued decline? Share your views and join the conversation below!
👉 Follow for more updates and insights, and join the community to discuss real-time market moves!
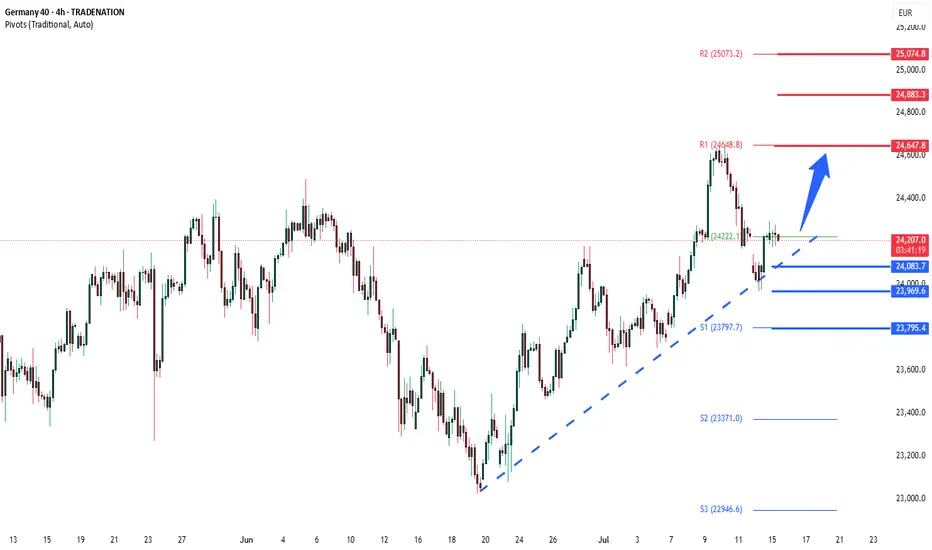
DAX corrective pullback supported at 24085The DAX remains in a bullish trend, with recent price action showing signs of a resistance breakout within the broader uptrend.
Support Zone: 24085 – a key level from previous consolidation. Price is currently testing or approaching this level.
A bullish rebound from 24085 would confirm ongoing upside momentum, with potential targets at:
24650 – initial resistance
24880 – psychological and structural level
25000 – extended resistance on the longer-term chart
Bearish Scenario:
A confirmed break and daily close below 24085 would weaken the bullish outlook and suggest deeper downside risk toward:
23970 – minor support
23800 – stronger support and potential demand zone
Outlook:
Bullish bias remains intact while the DAX holds above 24085. A sustained break below this level could shift momentum to the downside in the short term.
This communication is for informational purposes only and should not be viewed as any form of recommendation as to a particular course of action or as investment advice. It is not intended as an offer or solicitation for the purchase or sale of any financial instrument or as an official confirmation of any transaction. Opinions, estimates and assumptions expressed herein are made as of the date of this communication and are subject to change without notice. This communication has been prepared based upon information, including market prices, data and other information, believed to be reliable; however, Trade Nation does not warrant its completeness or accuracy. All market prices and market data contained in or attached to this communication are indicative and subject to change without notice.
$CRV Macro Bearish PlayWe had an inverse cup and handle at .6266 that broke down to .50 and didn't meet its target (.40-.42 area). Instead, we consolidated at .50 to expand the smaller inverse cup neckline to .5503. This move up from .50 to .73 (currently) is a slighty over extended handle. If we continue higher but fail to establish support @ .8231, the next bearish structure is a double top with its peaks finding resistance around .82-.86 and neckline @ .5385. The rest is self-explanatory in the chart.


AINUSDT.PEverything is mentioned on the chart..
Price is at mini reversal area but it just crossed it down so most likely it might go till the next level..
Only trade when you see some bullish candles or momentum

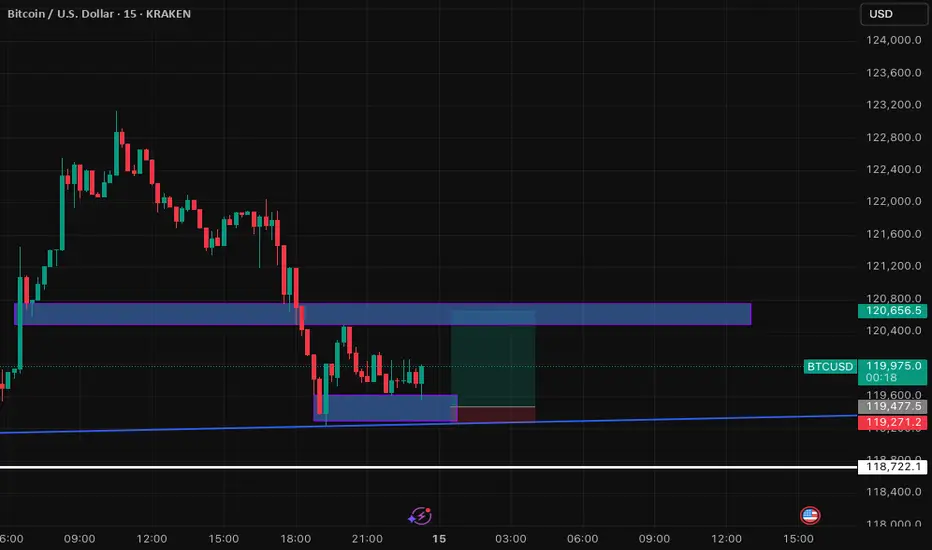
BTC/USD: 15-Min Reversal Attempt at Key Trendline SupportThis 15-minute chart for BTC/USD highlights a potential reversal opportunity following a significant downtrend. Price has found support at a confluence of a rising long-term trendline and a defined demand zone around 119,271 - 119,477.5. The analysis focuses on the current consolidation at this support, looking for bullish candlestick patterns to confirm a move towards retesting the prior breakdown level (now resistance) at 120,500 - 120,700. Key observations include the breakdown from a previous support, the current bounce, and the defined risk-reward setup for a potential long entry."
What no one expects will happen with BitcoinAll markets go through expansion phases and correction phases. As hard as it may be to believe, Bitcoin and the entire crypto space will also face their macro correction at some point.
That doesn’t mean it’s going to crash into oblivion or that it’s all a scam — not at all. What I believe is that when that major correction hits, it will open the door to real buying opportunities.
And maybe, in 10 or 15 years, once the bear cycle has fully played out, Bitcoin will be ready to climb to 200k, 400k, 600k — or wherever the next cycle takes us.

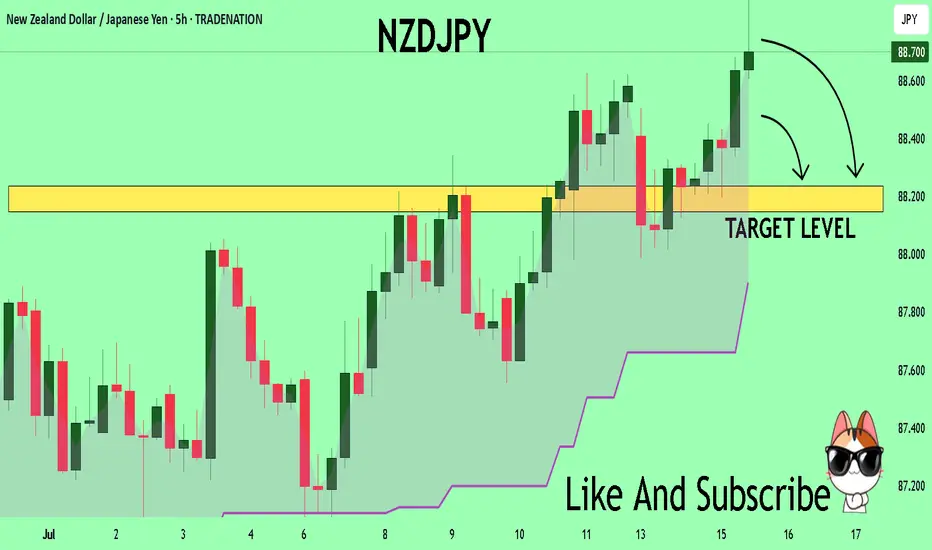
NZDJPY Technical Analysis! SELL!
My dear friends,
Please, find my technical outlook for NZDJPY below:
The instrument tests an important psychological level 88.688
Bias - Bearish
Technical Indicators: Supper Trend gives a precise Bearish signal, while Pivot Point HL predicts price changes and potential reversals in the market.
Target - 88.235
About Used Indicators:
Super-trend indicator is more useful in trending markets where there are clear uptrends and downtrends in price.
Disclosure: I am part of Trade Nation's Influencer program and receive a monthly fee for using their TradingView charts in my analysis.
———————————
WISH YOU ALL LUCK
Continue to be bullish at low levels!Pay attention to the short-term resistance near 3360. If it stabilizes, continue to watch 3380 and break 3400. Continue to watch 3340-3330. Any pullbacks are opportunities to go long. If it effectively breaks 3330, pay attention to testing 3300!
In the short term, we will see fluctuations first. If it falls back, we will continue to buy on dips. At present, it has tested the low area. Everyone should hold on to the long opportunity.

Idea AITitle: XAU/USD – 4H: Bullish Demand Bounce Setup
Description:
- 📍 Daily Supply Zone (Resistance): **3,380–3,390**
- 📍 Daily Demand Zone (Support): **3,330–3,320**
- 🔍 Trendline (4H Higher Lows): Connect swing low ~3,290 to ~3,330
- 🎯 Fibonacci (for confluence): Low ~3,280 → High ~3,370
- ✅ Entry: Look for bullish confirmation (wicks, engulfing candle) in **3,330–3,320** zone
- 📈 Target 1: 3,435 (mid-swing), Target 2: 3,480 (swing high retest near 3,500)
- 🚫 Invalidation: Close below 3,315
#XAUUSD #Gold #TradingView #Structure #DemandSupply #4H

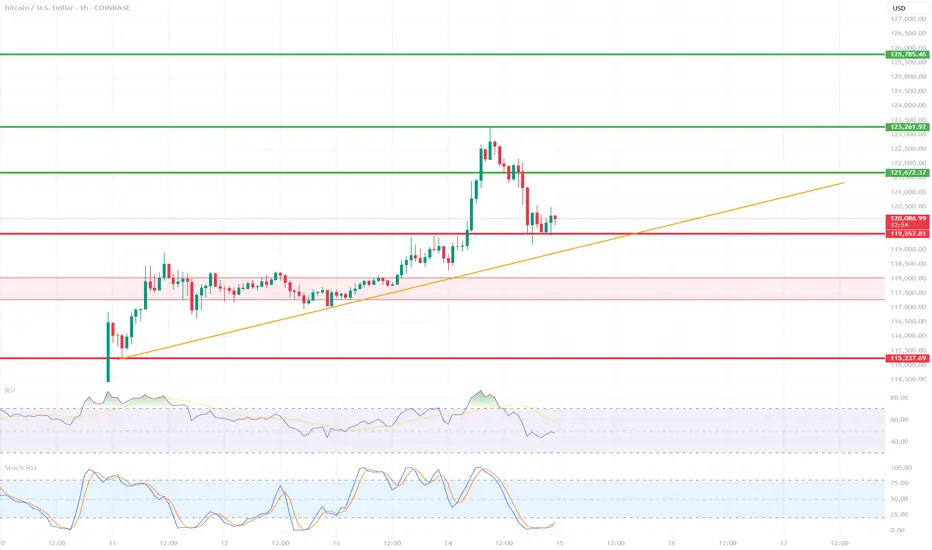
BTC/USD 1H ShortTerm🔍 Trend:
The short-term uptrend remains in effect, supported by the orange trendline.
The price has tested dynamic support but has not yet broken it.
🟥 Supports (Important Levels):
🔻 1. 119.550
Key support.
The price is currently testing it. Holding = potential upside rebound.
Breaking = greater downside risk.
🔻 2. 117.260–118.040 USD
Clear demand zone (reinforced by prior consolidation).
If the price breaks below current support, this is the next logical stopping point.
🔻 3. 115.237–115.500 USD
Strong weekly support – very important in the event of a stronger correction.
Historically, it has responded many times.
🟩 Resistance:
🔼 1. USD 121.673
The nearest local resistance – this could pose a problem for further growth.
🔼 2. USD 123.961
The last local high. Breaking it confirms the continuation of the uptrend.
🔼 3. USD 125.785
The next resistance – a potential target after a breakout to the upside.
📈 Technical Indicators:
RSI (classic):
Still below 50, but starting to reverse slightly upward – neutral with a slight potential for a rebound.
Stochastic RSI:
Gives a long signal – the lines have crossed in the oversold zone and are pointing upward.
📊 Scenarios:
🟢 Bullish:
Maintaining the current support zone (119.5–120k).
Breakout above 121.673 → target: 123.961.
Breakout of 123.961 = trend confirmation and target: 125.8k+
🔴 Bearish:
Break of the trend line and support at 119.550 → possible quick decline to 117.2k–118k.
If this doesn't hold, target: 115.2k
✅ Summary:
Decisive moment – tested trend line + support = rebound or breakout point.
The Stochastic RSI indicates a potential upside breakout, but the RSI needs confirmation.
Careful monitoring of volume and reaction to 120k in the coming hours.
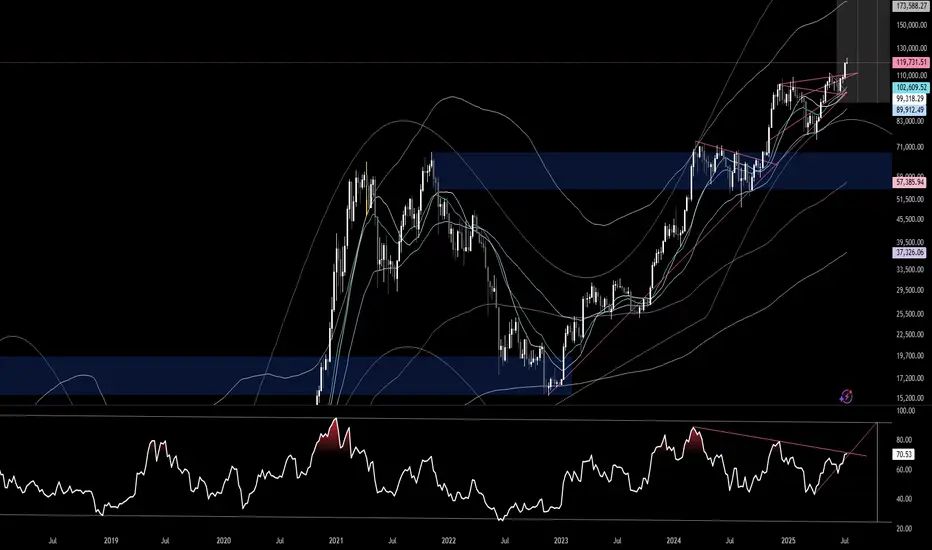
BTC 1W RSIThe BTC 1W RSI is on the verge of breaking above the down sloping trend. Once above it, the sky is the limit. The question is, when will it happen and how high will it go?
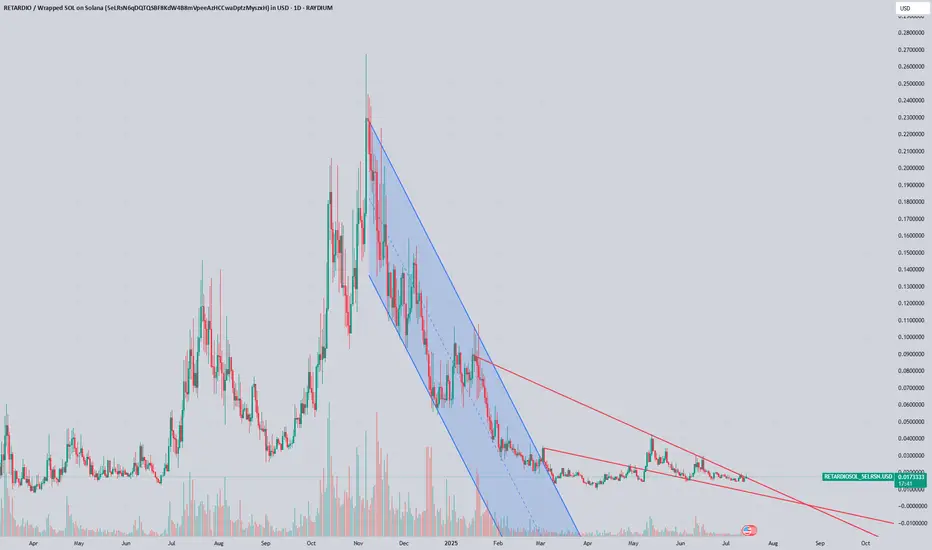
$Retardio LongI have added to my Retardio long. The entire crypto memespace is well... you get it.
No other token comes close to defining the entire space. I'll be holding this one for a long time just because of the lolz. Not advice. This is retardio.
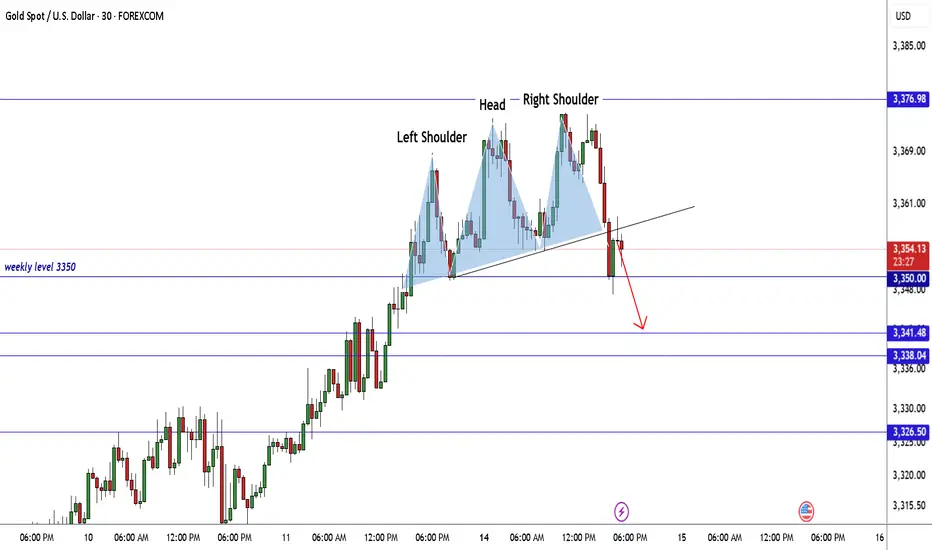
GOLD Made H&S Reversal Pattern , Scalping Short Setup Valid !Here is my GOLD 30 Mins Chart and if we checked the chart we will see that the price created a very good reversal pattern on 30 mins T.F , Head & shoulders reversal pattern and also it`s already confirmed by closure below neckline so the short is very clear now and we can targeting 100 to 150 pips , 3350.00 is a very good support also so we can see a price bounce from it to upside .
Mid-Session Market InsightsMid-Session Market Insights
In today's session, I'm closely monitoring eight different futures markets: S&P 500, NASDAQ 100, Russell 2000, Gold, Crude Oil, Euro Dollar, Yen Dollar, and Aussie Dollar.
S&P 500: We're seeing a rotational pattern within the prior day's value area and the CVA. I'm eyeing long opportunities from the prior value area low up to the high.
NASDAQ 100: The market is a bit choppy around the PVA and CVA highs, with a slight upward intraday trend. I'm staying cautious here.
Russell 2000: Also choppy, but we've got acceptance within the CVA. I'm looking for long opportunities from the CVA low, which aligns with the prior day's low.
Euro Dollar: I'm currently short from the CVA high, with the first target at the prior day's low. We've broken below the prior value area, so I'll trail this trade and see how it develops.
Yen Dollar: It’s been a bit of a mixed bag. I took a short below the CVA and prior day's low, got stopped out, but it was still a decent setup.
Aussie Dollar: I took some long positions that weren't the best setups, as it was quite choppy near the CVA high and prior day's low. Lesson learned for next time.
Crude Oil: I took a short from the CVA and PVA highs, hit my target at the low of those areas, and we’re currently hovering around that level.

XAUUSD 15m Bearish Pullback Setup | Supply Zone Rejection Trade XAUUSD 15-Minute Analysis & Trade Idea
Market is respecting a bearish structure with lower highs and lower lows. Price is currently pulling back toward a supply zone around 3,354.09–3,359.03 after breaking below the True Day Open.
Reasoning:
Bearish market structure
Confluence with True Day Open, session highs/lows, and downward trendlines
Risk-to-reward of approximately 1:2+
Reminder: This is not financial advice. Do your own analysis and risk management.

Long Opportunity for EURUSDEURUSD is currently in a retracement within a bullish trend with clear Bullish market structures in place.
Price is currently approaching the break and retest level at 1,16285... a potential pivot point which acted as a resistance level in the past. On the 4-hour timeframe, price is trading below the 21 and 50 SMA due to the slow nature of the retracement and we are seeing bearish momentum on the RSI.
Need to see the Bulls stepping in with clean bullish momentum on the 4 hour chart to confirm the bullish market directionality before looking to take a long position. will also be observing the bearish trendline break as an additional point of confluence to take the long trade

EURUSDHello Traders! 👋
What are your thoughts on EURUSD?
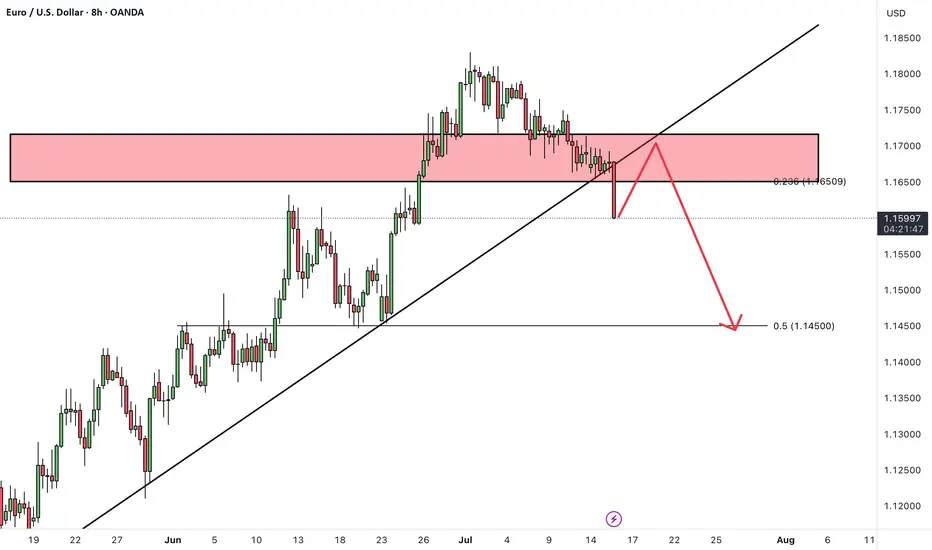
EURUSD has broken support level and its ascending trendline, indicating a possible shift in short-term market structure and growing bearish pressure.
In the short term, we expect a pullback toward the broken support/trendline zone.
If price fails to reclaim this level, a continued move lower toward the next identified support zone is likely.
As long as price remains below the broken structure, the short-term outlook stays bearish.
Don’t forget to like and share your thoughts in the comments! ❤️
EURUSD: Will Go Down! Short!
My dear friends,
Today we will analyse EURUSD together☺️
The recent price action suggests a shift in mid-term momentum. A break below the current local range around 1.16802 will confirm the new direction downwards with the target being the next key level of 1.16684.and a reconvened placement of a stop-loss beyond the range.
❤️Sending you lots of Love and Hugs❤️

AUDUSD: Short Setup Ahead of Key Data OANDA:AUDUSD
AUDUSD is hovering near a rising trendline, with price action compressing and signaling a potential downside break in the coming sessions.
Just above, the 0.65900 resistance zone has capped recent rallies, and the pair’s failure to clear this level strengthens the case for a reversal.
Later today, we will see Westpac Consumer Confidence data for Australia, which could act as a catalyst for a sharp move. A weaker-than-expected print would likely pressure the Aussie further.
📋 Entry Checklist:
✅ Testing rising trendline, signaling potential breakdown
✅ Strong resistance at 0.65900 holding rallies
✅ Key consumer sentiment data could trigger volatility
📈 Trade Plan:
🔻 Sell Entry: 0.65600
❌ Stop Loss: 0.66200
✅ Take Profit: 0.65000
(Tap 👉 Trade Now 👈 on mobile to copy SL & TP easily)
📰 Fundamental Snapshot:
The Reserve Bank of Australia (RBA) surprised markets by holding rates steady at 3.85%, diverging from expectations of a potential cut. The RBA remains cautious amid persistent inflation risks driven by high labor costs and weak productivity, suggesting rates may stay restrictive longer.
Governor Michele Bullock highlighted that inflation could remain above forecasts, while Deputy Governor Andrew Hauser emphasized monitoring global uncertainties, including U.S. tariff developments, reflecting the RBA’s sensitivity to external headwinds impacting growth and trade.

AUDCAD LONG 14-7-2025indices
axy : bullish
cxy : bearish
trade long with proper risk management only 0.5 % per trade
