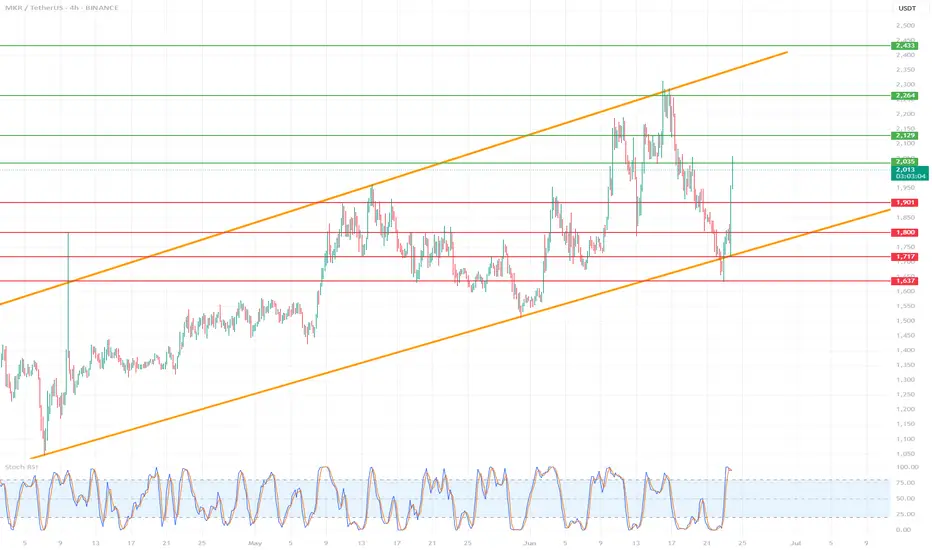
MKR/USDT (MakerDAO) on the 4H time frame🔷 1. Trend and market structure
🔸 Upward channel:
The price is moving in a wide, ascending channel (orange lines).
The lower line of the channel was last tested on June 22, 2025, which ended with a dynamic upward bounce.
The upper limit of the channel reaches around 2,450 USDT.
🕸️ Market phase:
In the short term, the market was in a downward correction phase within the uptrend.
Currently, we see a strong rebound from support - a new uptrend is possible.
🔷 2. Key horizontal levels (support/resistance)
🟥 Support:
1,637 USDT - local support (the lowest level of the red zone), almost tested at the bottom.
1,717 USDT - very technical support, tested several times.
1,800 USDT – psychological level and local consolidation.
1,901 USDT – last support peak, currently broken upwards.
🟩 Resistances:
2,003 USDT – current price level, currently tested as new resistance.
2,129 USDT – strong resistance from previous peaks.
2,264 USDT – previous swing high.
2,433 USDT – upper boundary of the channel and technical level from historical peaks.
🔷 3. Price and candle behavior
Strong demand reaction at the lower boundary of the channel: long pin bar/bull's embrace at the lower boundary.
The upward movement was dynamic and uniform, which indicates high buyer activity.
If the price stays above 1,901 USDT – further increases are possible.
🔷 4. Technical indicators
🔁 Stochastic RSI (4H):
Currently in the overbought zone, just below the level of 100 - a temporary correction or consolidation may occur.
However, with a strong upward trend, Stoch RSI may "stick" to the upper band - it does not yet give a clear S/S signal.
🔷 5. Technical scenarios
🟢 Bullish scenario (continuation of growth):
Condition: maintaining the level above 1,901 USDT.
Targets:
TP1: 2,129 USDT
TP2: 2,264 USDT
TP3: 2,433 USDT (upper limit of the channel)
Stop-loss: below 1,800 USDT
🔴 Bearish scenario (rejection of resistance):
Condition: strong rejection of 2,003 USDT and return below 1,901
Targets:
TP1: 1,800 USDT
TP2: 1,717 USDT
TP3: 1,637 USDT
SL: return above 2,003 USDT
🔷 6. Final remarks
The current upward movement looks like a "V-shape reversal" reaction - a sharp turnaround with dynamic volume suggests strong buyer interest.
The key will be the reaction to 2,003 USDT - a breakout and retest can give a very good long entry.
Short positions are risky as long as the price is in the lower half of the ascending channel.
Trendbasedfib
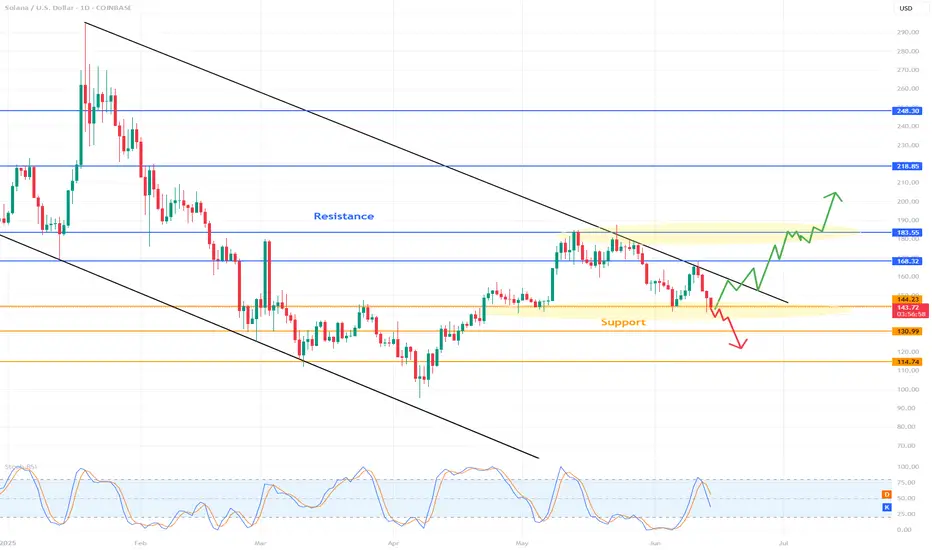
SOLUSD 1D Chart Review1. Main Trend
Downward Channel: Price moving in wide, downward channels (black trend lines), which means that the medium and long term remains bearish.
The upper trend line is a strong dynamic resistance, the lower one – support.
2. Key Horizontal
Resistance (Resistance):
$168.32: Strong resistance level, which it has responded to many times in the past.
$183.55: Another important resistance, confirmed by historical highs.
$218.85: Further resistance with an interval obligation.
$248.30: Very strong, long-term resistance (far from the current price for now).
Support (Support):
$144.23: actually occurs close to this support – very level.
$130.99: Another potential level where price could look for a rebound.
$114.74: Strong support, last bastion of bulls near March/April low.
3. Price action (Price action)
Last candles emitted pullback from downtrend line and down to support area of $144.23.
that any attempt to grow above trend line is limited by sellers.
$144.23 level currently existing short-term support - its loss may be available in case of $131 or possibly existing.
4. Indicator
Stochastic RSI (at the bottom of the chart):
Stochastic RSI indicator stated that airlines (blue and orange) were in power (overbought) in recent devices, but suddenly started to turn down.
Currently occurs in neutral zone, however application of protection (oversold). In case of threat occurrence now, it may suggest risk of attack, but it is not yet decided.
It is worth noting whether to go to the area of 20 and start turning back - in case of a necessary necessity.
5. Scenarios for the days
Bullish (growth):
Maintaining support at 144.23 USD and hitting the downtrend line (around 160-165 USD).
Breaking the trend line and resistance at 168.32 USD will give a signal to load in the area of 183-218 USD, but for the tenth time it seems to be less important, attention given the market structure.
Bearish (fall):
Breaking support at 144.23 USD and closing below on the daily candle - the next target to 131 USD, and then 114 USD.
The downtrend channel is still working against the bulls.
6. Summary
Main trend: downtrend.
Price: Close to support, but the risk of you leaving a big one.
Key horizontals: $144.23 (short-term support), $168.32 (main resistance).
Stochastic RSI: Heading towards oversold zone, but not yet giving a clear conclusion about a breakout.
Recommendation: Observe the application of price at $144.23 and the behavior of Stochastic RSI. In case of a breakout - it is possible that they will occur.
BTC/USD 1H chartHello everyone, let's look at the 1H BTC chart for USD, in this situation we can see how the price moves over a strong growth trend line. However, let's start by defining goals for the near future the price must face:
T1 = 109164 $
T2 = 110207 $
Т3 = 111463 $.
Let's go to Stop-Loss now in case of further declines on the market:
SL1 = 107264 $
SL2 = 106314 $
SL3 = 105578 $
SL4 = 104781 $
Looking at the RSI indicator, we see
Return above the upper limit, which can cause an attempt to relax at the coming hours.

BTC/USD 1H Short-Term🔍1. General Context and Short-Term Trend
Short-Term Trend: The last dozen or so candles have shown strong fluctuations — a typical sideways market (consolidation) after a clear upward impulse and a quick drop. The price is currently trading in the range of around $104,900–$106,500.
Recent Strong Move: Clear upward impulse from around $104,900 to around $106,900, followed by a quick correction.
📌2. Supports and Resistances (H1)
Supports:
$105,000–$105,200 — Bottom of local wicks and several demand tests.
$104,900 — Lowest point of the last few hours, clear buyer reaction.
Resistances:
$106,200–$106,400 — Upper area of several candles, strong price rejection.
106,900–107,000 USD – The peak of the last impulse, a place of clear supply.
✅3. Candlestick formations and price action
Pin bar / long wick: Candles with long lower wicks are visible around 105,000 USD, which suggests that buyers are defending support.
Double top? (Double top): Peaks around 106,900 USD (03.06 and 04.06) – a classic signal of a potential change in direction to the lower.
Possible consolidation: The last few hours have been a series of alternating candles, signaling the lack of a clear advantage of bulls or bears.
🧠4. Technical indicators (MACD and RSI)
MACD (lower panel)
The MACD line crossed the signal line from the bottom to the top, then a quick correction and currently the MACD is close to zero – no clear trend, momentum has slowed down.
MACD Histogram: Declining, close to zero, suggesting potential lack of strong trend and possibility of further consolidation.
RSI (middle panel)
RSI value ~44–48 – not overbought or oversold, neutral market state.
No divergence – RSI generally follows price, no strong divergences are visible.
RSI bounced off 30 (tested oversold zone and returned to neutral range).
🧠5. What could be important?
Volatility Squeeze: Low volatility after a sharp move often heralds another impulse.
Potential Fakeout: If support at $104,900 is broken falsely (e.g. quick wick and return), a move up could occur.
No clear trend on the hourly chart, rather sideways market in the short term.
📊Summary and scenarios
Scenario 1 (bullish):
If the $105,000-$104,900 level holds, we can expect a test of $106,200-$106,400 and perhaps another attempt to approach $107,000.
Scenario 2 (bearish):
If the $104,900 support is broken (with a candle closed below this level), the next target is around $104,500 and below.
What to watch out for?
Timing of macro data releases - may increase volatility.
Sudden breakouts from consolidation - no trend = higher risk of sudden, false moves.

ETHUSD short-term🔍1. Technical situation
ETH/USD is in a consolidation phase — the price is moving in a rather narrow range, without a clear upward or downward trend.
📊
The upper limit of this consolidation is the resistance zone of USD 2,664–2,717 (green rectangle on the chart).
The lower limit is the support zone of USD 2,495–2,446 (red rectangle).
2. Potential formation
A potential double bottom formation can be seen on the chart, which is a classic trend reversal formation to an upward one.
The lows occurred around May 25–31 and at the end of May.
Confirmation of the formation would be a breakout of the resistance zone of USD 2,664–2,717.
3. Technical indicators
RSI:
Currently, the RSI has rebounded from zone 40 and is heading up. Exceeding the 50 level may be a signal of buyers' strength and support for the bullish scenario.
On the chart: "Potential rebound signal - watch break above 50"
MACD:
MACD is close to generating a momentum change signal (potential intersection of the MACD and signal lines).
On the chart: "MACD near signal - watch for momentum shift"
4. Scenarios for the coming hours/days
Bullish scenario (up):
✅
If the price breaks above USD 2,717 (exit from consolidation upwards), a dynamic move towards USD 2,800 can be expected.
Support for this scenario will be signals from RSI and MACD.
Bearish scenario (down):
🔻
If the price rejects the resistance zone and returns below USD 2,446, the risk of going down to the next support in the area of USD 2,300 increases.
🧠
Summary
Key Levels:
📌
Support: $2,495-$2,446
Resistance: $2,664-$2,717
Currently, the market is in consolidation with an attempt to break out to the top.
Watch for: Resistance breakout (potential bullish signal) and support reactions (potential bearish).
Pattern: Potential double bottom - needs confirmation.

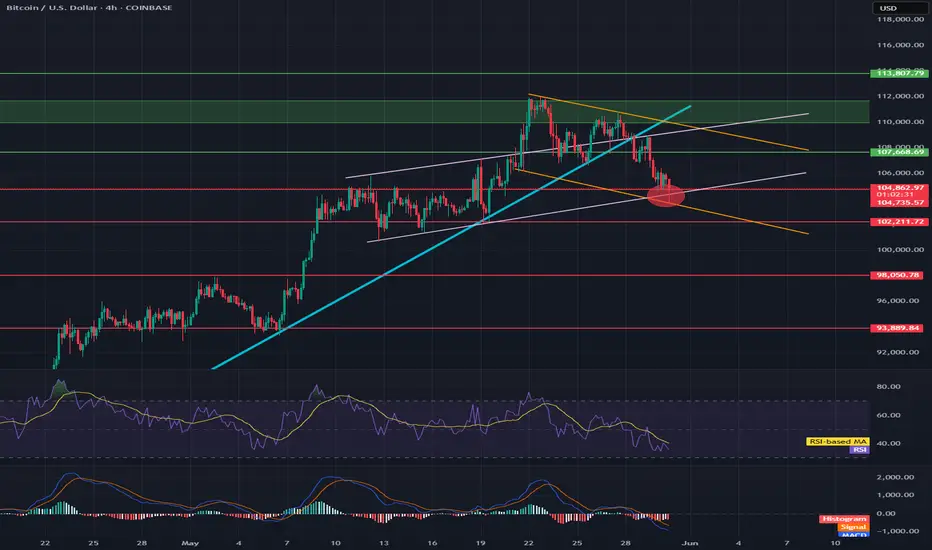
Will BTC hold its price?Hello everyone, I invite you to review the current situation on BTC. When we enter the four-hour interval, we can see how the BTC price has left the ongoing upward trend line at the bottom, and what's more, we can see how the current movement is creating a local downward trend channel in which the price is currently on the border of the previously created upward trend channel, which gives a strong support point.
Here we can see how the current downward movement has entered the support circle that starts around $ 104,800 and ends around $ 102,200, this is the place where two conflicting channels have converged. If these supports do not hold the price, we can see a quick recovery to around $ 98,000, and then to the level of $ 93,900.
Looking the other way, we can see that when the trend reverses, we first have resistance at $107,670, then a resistance zone from $110,000 to $111,700 is visible, at the border of two channels, and then resistance is visible around $113,800.
On the MACD indicator, we can see a return to the downtrend, while on the RSI we return to the lower part at the lower border, which could potentially provide energy for a future upward movement.
LTC/USDT 4H ChartHello everyone, let's look at the 4H LTC to USDT chart, in this situation we can see how the price is moving in a specific yellow triangle, in which we can see an attempt to exit from the bottom. On the other hand, the blue lines mark the main channel of the downtrend and here we can see how the price is fighting with its upper limit, but it is a strong resistance.
Let's start by defining the goals for the near future that the price has to face:
T1 = 101 USD
T2 = 111 USD
Т3 = 124 USD
Т4 = 147 USD
Now let's move on to the stop-loss in case the market continues to fall:
SL1 = 90 USD
SL2 = 80 USD
SL3 = 63 USD
The RSI indicator shows a rebound, but the movement remains around the middle of the range, which further leaves room for a potential deepening of the rebound.

BTC/USD 4h Chart ReviewHello everyone, I invite you to review the current situation on BTC. When we enter the four-hour interval, we can see how the BTC price is moving in the upward trend channel, in which several upward waves can be marked, which may indicate the beginning of another wave of growth.
Here you can see how the current rebound has brought the movement closer to a strong resistance zone from $ 110,400 to $ 113,200, only breaking out of this zone on top can give the price an increase in the area of strong resistance at $ 121,000.
Looking the other way, you can see that when the trend reverses, we first have a support zone from $ 106,600 to $ 105,400, however, if this zone is broken, we can see a quick return of the price to the area of strong support at $ 102,000.
The RSI indicator shows how a support line was formed from which the indicator bounced many times, giving the price an increase, while the MACD indicator maintained the upward trend and created room for another upward movement when the price recovered.

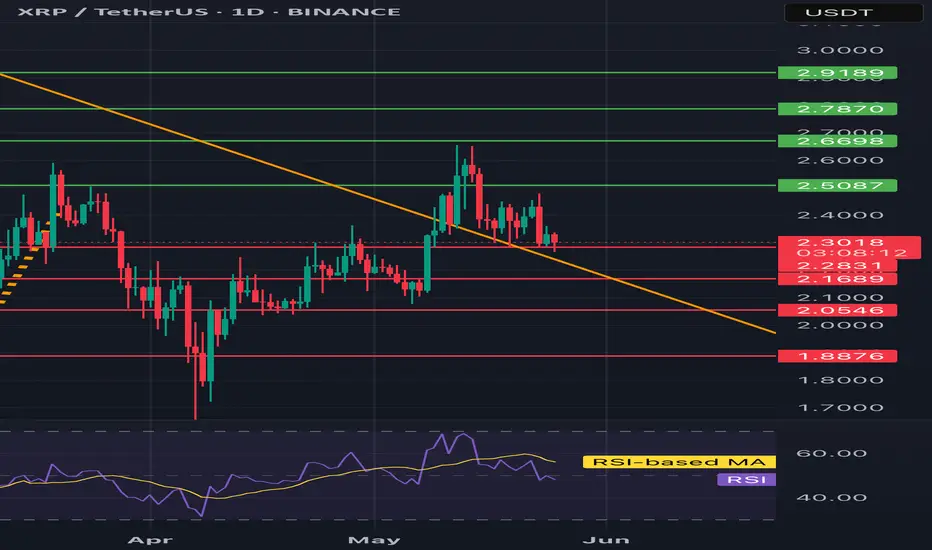
XRP/USDT 1D chart reviewHello everyone, let's look at the 1D XRP chart to USD, in this situation we can see how the price lasts above the downward trend line.
Going further, let's check the places of potential target for the price:
T1 = $ 2.51
T2 = $ 2.67
Т3 = 2.79 $ t4 = $ 2.92
Let's go to Stop-Loss now in case of further declines on the market:
SL1 = $ 2.31
SL2 = $ 2.17
SL3 = $ 2.06
SL4 = $ 1.89
Looking at the RSI indicator, you can see how he reacted and returned to the middle of the range, which creates a place for a panty growth.
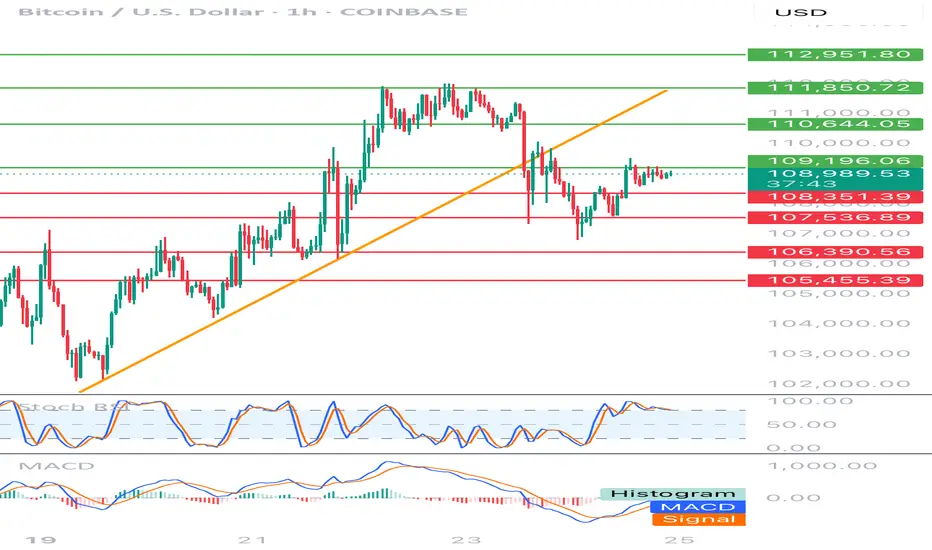
BTC-USD 1h chart targets and stoplossHello everyone, let's look at the 1H BTC chart to USD, in this situation we can see how the price dropped below the local upward trend line. Going further, let's check the places of potential target for the price:
T1 = 109196 $
T2 = 110644 $
Т3 = 111850 $ t4 = 112951 $
Let's go to Stop-Loss now in case of further declines on the market:
SL1 = 108351 $
SL2 = 107537 $
SL3 = 106390 $
SL4 = 105455 $
Looking at the RSI indicator, we see staying over the upper limit, which can give price drops, while the MacD indicator lasts at the bottom of the range and is close to returning to the upward trend.
BTC traffic update and channel exit.As we can see, the BTC price is moving according to the previously mentioned rules. Here we can see how the price left channel number 1 at the top, and the increase after leaving the channel gave an upward movement at the level of the height of the channel itself.
In this situation, it is worth paying attention to channel number 2, from which we also previously got an exit at the top with a strong upward movement, currently we can see how the price is fighting with strong resistance at the level of $ 111,500, however, taking into account the height of channel number 2, we can mark the level of around $ 121,500 as another very strong resistance.

BTC/USD 4H Chart targets and stoplossHello everyone, let's look at the 4H BTC to USD chart, in this situation we can see how the price has come out of the downtrend channel on top, and the upward movement after leaving the channel is close to the height of the downtrend channel.
Let's start by defining the targets for the near future that the price has to face:
However, at the beginning we can see how the price is struggling with a strong resistance zone from $103882 to $108349. Next, we have potential targets:
T1 = 112,740 USD
T2 = 116,525 USD
Т3 = 120,000 USD
Now let's move on to stop-loss in case the market continues to fall:
SL1 = 100,551 USD
SL2 = 97,446 USD
SL3 = 92,525 USD
SL4 = 88,286 USD
The RSI indicator shows that in the 4H interval, the movement is at the upper limit of the range, which clearly affects the sideways movement on the chart.

LTC-USDT 1W chart ReviewHello everyone, let's look at the 1W LTC chart to USDT, in this situation we can see how the price approached the upper limit of the inheritance trend channel, only when it manages to get out of it, the price will be able to go further towards the inheritance trend line.
Going further, let's check the places of potential target for the price:
T1 = $ 105
T2 = $ 115
Т3 = 129 $
T4 = $ 147
Let's go to Stop-Loss now in case of further declines on the market:
SL1 = $ 97
SL2 = 80 $
SL3 = $ 63
Looking at the RSI indicator, we see
As he approached the center of the range, but we still have enough space for the price to definitely move up.

DOGE/USDT 1D chart reviewHello everyone, let's look at the 1D dog chart to USDT, in this situation we can see, the price reflection here can be seen how the price continues under the downward trend line.
Going further, let's check the places of potential target for the price:
T1 = 0.246 $
T2 = 0.282 $
Т3 = 0.319 $ t4 = 0.369
Let's go to Stop-Loss now in case of further declines on the market:
SL1 = 0.229 $
SL2 = 0.195 $
SL3 = 0.157 $
Looking at the RSI indicator, you can see that when the indicator came out the top, it gave the relief for the price and now when the price lasts in a slight side trend, the indicator collects energy for a new move.

LINK/USDT 1W chart reviewHello everyone, let's look at the 1W link to USDT, in this situation we can see how the price is fighting for the mountain from the downward trend line over which we are currently.
Going further, let's check the places of potential target for the price:
T1 = $ 18.38
T2 = $ 21
Т3 = $ 23.53
Let's go to Stop-Loss now in case of further declines on the market:
SL1 = 15.31 $
SL2 = $ 13.17
SL3 = 10.53 $
Looking at the RSI indicator, we see a clear increase on the indicator and a return to the upper part of the range, but there is still room for continuing the ongoing strong growth.

ETH is fighting in a strong resistance zone!Hello everyone, I invite you to review the current situation on ETH. When we enter the one-day interval, we can see how the ETH price came out on top from a strong downward trend.
Here we can see how the current bounce brought the movement closer to a very strong resistance zone from $ 2,090 to $ 2,310, in which we can currently observe a fight for further upward movement. Only when the price comes out on top, it can go towards resistance at $ 2,740, and then move towards strong resistance at $ 3,070.
Looking the other way, we can see that when the trend reverses, we first have support at $ 1,837, then a very strong support zone from $ 1,610 to $ 1,404 is visible, however, if this zone is broken, we can see a quick decline to the support area at $ 1,071.
On the RSI indicator we can see how strong the ETH price movement is visible intensively on the indicator and here we can see how we are approaching the upper limit, which could potentially slow down the movement or give a temporary relief.

BTC/USD 1D chart ReviewHello everyone, let's look at the 1D BTC chart for USD, in this situation we can see how the price came out of a strong downward trend, which gave a strong upward movement for the price. Going further, let's check the places of potential target for the price:
T1 = 96592 $
T2 = 101878 $
Т3 = 109442 $
Let's go to Stop-Loss now in case of further declines on the market:
SL1 = 92363 $
SL2 = 89028 $
SL3 = 83498 $
SL4 = 79350 $
Looking at the RSI indicator, we can see that despite a small price change, the indicator strongly reacted what potentially can give energy to further price increases in the coming weeks.

LTC/USDT 12H chart reviewHello everyone, let's look at the 12H LTC chart to USDT, in this situation we can see how the price came out of the downward trend and currently you can see the movement of the newly created upward trend line. Going further, let's check the places of potential target for the price:
T1 = $ 89
T2 = $ 97
Т3 = $ 109
Let's go to Stop-Loss now in case of further declines on the market:
SL1 = 85 $
SL2 = $ 77
SL3 = $ 67
SL4 = $ 63
Looking at the RSI indicator, we see
Return to the lower limit, which can potentially give energy to make the price re -perform upward movement.

MKR/USDT 4h chart ReviewHello everyone, let's look at the 4H MKR chart to USDT, in this situation we can see how the price moves on the created upward trend line. Going further, let's check the places of potential target for the price:
T1 = $ 1576
T2 = 1657 $
Т3 = 1714 $
Let's go to Stop-Loss now in case of further declines on the market:
SL1 = $ 1529
SL2 = $ 1499
SL3 = $ 1450
SL4 = 1372 $
Looking at the RSI indicator, we see
How slight relaxations give space for further increases by living in the upward trend of price.

LINK/USDT 4H Chart ReviewHello everyone, let's look at the 4H chart LINK to USDT, in this situation we can see how the price was moving in a downward channel, from which we saw an exit to the top and the formation of a new local uptrend line.
Let's start by defining the targets for the near future that the price has to face:
T1 = 15.08 USD
T2 = 16.87 USD
Т3 = 17.93 USD
Т4 = 19.07 USD
Now let's move on to the stop-loss in case the market continues to fall:
SL1 = 13.98 USD
SL2 = 13.12 USD
SL3 = 11.74 USD
SL4 = 10.76 USD
SL5 = 9.48 USD
If we look at the RSI indicator we can see how the price correction gave a strong rebound on the indicator, which could potentially give strength for new growth.

ATOM/USDT review chart 4HHello everyone, let's look at the 4H ATOM chart for USDT, in this situation we can see how the price has affected from the upper limit of the downward trend channel, however, staying in the upper part of the channel. Going further, let's check the places of potential target for the price:
T1 = $ 4.79
T2 = $ 5,26
Т3 = 5.63 $
Let's go to Stop-Loss now in case of further declines on the market:
SL1 = $ 4.29
SL2 = $ 4.02
SL3 = $ 3,57
Looking at the RSI indicator, you can see a healthy relaxation crossing the lower limit, which produces space for a potentially new growth movement. The MacD indicator that has returned to the center of the range, which also creates potential for upward movement.

ETC/USDT 4h chart Hello everyone, let's look at the 4h graph etc to USDT, in this situation we can see how the price came out of the top of the lasting downward trend. Going further, let's check the places of potential target for the price:
T1 = $ 17.44
T2 = $ 18.75
Т3 = 20.73 $
T4 = 22.48 $
Let's go to Stop-Loss now in case of further declines on the market:
SL1 = $ 16.25
SL2 = $ 15.05
SL3 = $ 13.74
SL4 = $ 12.66
Looking at the RSI indicator, we see
As we entered the upper part of the range again, which apparently affected the slow price of the price.

ETH gives a strong exit from the descending channel!Hello everyone, I invite you to review the current situation on ETH, because you can see a significant rebound at the level of 30% from the last low. When we enter the four-hour interval, we can see how the ETH price moved in the local downtrend channel, from which we got an exit at the top, such a scenario often gives increases at the level of the channel height, which would bring the price closer to the levels of $ 2100.
Here you can see how the current rebound brought the movement closer to the resistance at the level of $ 1830, and then resistance is visible at the price of $ 1950, where the ETH price must then face a strong resistance zone from $ 2060 to $ 2100, where there could potentially be an upward movement after leaving the channel as in this case.
Looking the other way, you can see that when the trend reverses, we first have support at the level of $ 1730, but if it is broken, the ETH price may continue to fall and return to a strong support zone from $ 1480 to $ 1380.
It is worth paying attention to the MACD and RSI indicators because you can see how in the 4H interval we have gone beyond the upper limits of the ranges, which may translate into visible price consolidation on the chart in order to cool the situation.
