EURAUD, Trend continuationPrice has made a correction and pulled back into the trendline, a continuation of the uptrend is the next.
Trendcontinuation

Volume Spread Analysis - Understanding Traps & ConfirmationDespite the fact that the so-called “Big Players” in the game of ups and downs we call the market have the power to manipulate it in ways some cannot even imagine, what they ultimately seek is a healthy market. I’ve mentioned in previous posts that the market behaves like a living organism — and like any organism, it must be healthy in order to grow.
In simple terms, the traps institutional players set are there because they need cash flow — liquidity — to achieve that growth. But why do they need to use traps at all? The answer lies in the numbers: one institutional player is equivalent to hundreds, if not thousands, of uninformed or poorly trained retail traders. So, to sustain growth, they are not just inclined but sometimes forced to create traps.
Now imagine this: in a market with enormous capital, one big player is equivalent to 100 retail traders. If 25% of those traders were skilled — truly good at the game — think of how much more cash flow would occur, and how much healthier and more stable that growth could be.
But don’t be fooled — while big players may benefit from a small portion of skilled retail participants, it’s not their actual goal. Still, it wouldn't hurt them either, as long as liquidity and volatility are preserved. In fact, a higher percentage of skilled players could deepen liquidity and reduce the need for extreme manipulation.
However, if too many retail traders become skilled, the game tightens. Profit margins shrink. The edge that institutions hold becomes harder to maintain. And in such a scenario, consistent profitability becomes more difficult — for everyone.
As I’ve emphasized in previous ideas, there is a way to understand institutional traps — and one of the keys is learning how to interpret the Relative Strength Index (RSI) properly. However, since RSI is by nature an oscillator, its signals require confirmation. And what better tool to use for confirmation than Volume — specifically through the lens of Volume Spread Analysis (VSA)?
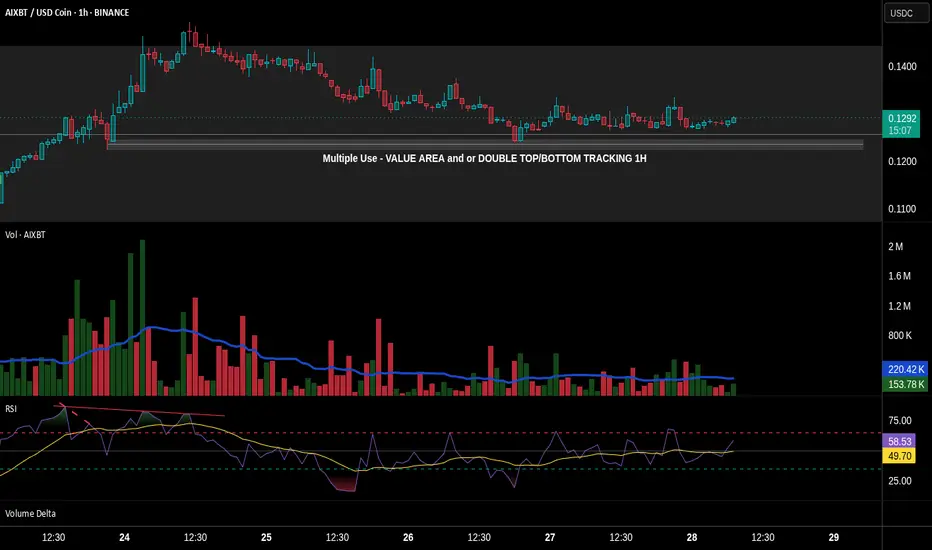
In this post, we’ll partially explore how these traps are revealed, using basic tools available on TradingView. We'll also uncover a potential trap in the chart of AIXBT/USD Coin from Binance, using the 1-hour time-frame.
🔹 1. Pre-Top Volume Cluster
Let’s begin at the very top of the chart. Just before this top, we can spot a bullish volume cluster — four consecutive volume spikes with rising price. In VSA, such a cluster often suggests that the current trend is reaching exhaustion.
⚠️ Important Note: Not all clusters mark a reversal. Even if we see one or two bearish candlesticks after-ward — even if they are engulfing — that alone does not confirm the reversal. The real signs are already present in the volume indicator.
As I’ve said in the past, in previously posted ideas: Big Players always leave footprints. Learning to read those footprints is the language every serious retail trader must eventually understand. And one of the clearest footprints is what we’ll discuss next.
🔻 2. The Buying Climax
A Buying Climax is a tell-tale sign of professional distribution — it appears (in our case) as a large bullish volume spike accompanied by a bearish candlestick, signaling the potential end of a rally.
In our AIXBT/USD Coin chart, we observe two buying climaxes:
• The first comes at the end of the bullish volume cluster, followed by a bearish candle.
• The second follows right after, repeating the same bearish confirmation.
🧠 Even though price was making a new Higher High — these repeated climaxes on increasing volume suggest supply is entering the market, and the uptrend is likely unsustainable.
✅ Conclusion
This is just one piece of the larger puzzle, but even basic tools like RSI and Volume, when read in the context of structure and intent, can reveal traps set by institutional hands. The more we train ourselves to see these signs, the closer we get to trading in harmony with the market’s true rhythm — not against it.
Now let’s take a look at another signal that hints at a possible reversal. But before we continue, keep in mind: what I’m about to describe doesn’t always play out in the simplified way I’ll mention here. The market behaves differently at any given moment — so this kind of analysis always requires a careful and adaptive approach.
This time, I’m referring to a smaller bearish cluster, made up of three volume spikes, each of them clearly above the 20-period Moving Average — and appearing just before the bullish cluster I highlighted earlier.
• The fact that the first spike in this bearish group breaks above the MA is a strong signal that bearish pressure is stepping in.
• The fact that all three spikes remain above the MA adds weight to that signal.
However — and this is crucial — just like I mentioned before, this alone doesn't confirm a reversal. It still requires confirmation.
Even though this smaller bearish cluster forms a new low, and even though it aligns with a bearish RSI divergence marked with a dashed trend line, it’s not a signal to enter a trade. Why? Because volume confirmation is missing. And that's exactly why RSI alone isn't enough. It can point to weakness — but not confirm the turn.
True confirmation only comes with the next bullish volume spike, which:
• a) breaks above the MA,
• b) is higher than the first bearish spike in the previous cluster,
• c) appears with an engulfing candlestick, and
• d) is supported by an RSI plot that follows the move.
This collective behavior — the interaction between price, volume, and momentum — is not random. It’s one of the many harmonies that exist in the market’s structure. And learning to recognize these harmonies is key to understanding when the market is genuine — and when it's trying to trap you.
🔚 Conclusion
All of this leads me to one conclusion — based not just on theory, but on direct experience.
We’ve all seen the countless videos across platforms where retail traders explain things like RSI divergences as if they’re guaranteed signals. But the truth is: not all of these videos are made by successful traders — and blindly following them can be dangerous.
Early in my trading journey, I made that exact mistake. I followed those “educational” videos without question, and nearly blew my account in the process.
Can you imagine what would happen if someone entered a trade solely based on the divergence we discussed — without waiting for confirmation?
If you’ve followed this chart example to its end, you already know the answer.
Worse, this kind of psychological frustration often leads to even bigger mistakes — especially if you haven’t applied one of the simplest protective tools: the Stop Loss. And sadly, many traders skip it.
So let this be a reminder:
A divergence is not a signal. Confirmation is everything.
Let’s now take things a step deeper — by partially revealing something that remains known only to a small circle of elite traders.
Something that’s rarely discussed in public — yet sits hidden in plain sight.
Many traders know that Volume Spread Analysis (VSA) is based on the teachings of Richard Wyckoff and expanded through Tom Williams in Master the Markets. And yes — the most of VSA’s power comes from those principles.
But that’s only part of the story. What did these two big names revealing in secret code using multiple paragraphs and terminologies, but purposely do not reveal it in simple words in a few lines. And they are doing the right thing. Because if I said to myself that if everyone knew that then the market might crashed, then for sure they had that thought as well
What truly sets VSA apart, and what gives it its real power, is that it operates in two distinct languages.
🧩 The Hidden Language of VSA — What Most Don’t See
Let’s now go a step deeper — by partially revealing something known only to a few traders who’ve spent enough time observing the market beyond surface-level signals.
Something that’s often overlooked, yet has always been in plain sight.
We all know that VSA stands for Volume Spread Analysis.
And we commonly refer to “spread” as the distance between the open and the close of a candlestick. This is what many traders fixate on — the relationship between price movement and volume.
But that’s only part of the story.
What did names like Wyckoff and Tom Williams really reveal?
They spoke in code — long paragraphs, obscure terminology, layered ideas — never quite saying "this is the hidden key" in a few plain words.
And they were right to do so.
Because I’ve thought the same thing myself:
If everyone knew this… if it was simplified and passed around like a hack… the market could collapse into chaos.
If I’ve had that thought, I’m certain they did too.
So instead, they left trails. Patterns. Puzzles.
They left the second language in the open — but made sure only those with patience, discipline, and time in the charts would ever truly hear it.
There are things the open and close can’t tell you, but...
That… is part of what I meant earlier when I said VSA speaks in two languages.
Some of you already sense what I’m pointing toward.
For the rest — keep watching.
You’ll know it when you see it.
And once you do, you’ll never unsee it again.
Let’s begin with what most traders already know.
We say "spread" in VSA to refer to the range between the open and the close of a candlestick. This spread, in relation to volume, tells us whether a candle shows strength or weakness.
• A wide spread on high volume may signal professional activity.
• A narrow spread on high volume could suggest absorption or hidden effort.
This is the first language — the most commonly taught, and the most widely shared.
But what about the second?
Here's where things get interesting.
Let’s revisit our AIXBT/USD Coin chart, and specifically the large engulfing candlestick that forms around 18:30, just after the very top.
Now ask yourself:
• 🔍 Where did this candle open?
• 📍 What previous zone did it revisit or retest? What’s the story behind on that retest?
• Have you noticed the macro scale Hidden bearish divergence between RSI & PA?
What you're seeing is not just a rejection.
It’s a trigger zone — a price level left behind earlier by institutional activity.
This candle, with its precise open, combined with the volume behavior, is no coincidence. It's not just a rejection — it's a setup, part of a pre-engineered trap. By stealing what Tom Williams said: Big players are simply saying to uninformed traders – “thank you for your money”.
The interaction of price levels over time, the zones formed by previous activity, and how volume behavior aligns with those zones to signal intent.
Most traders never see this and even fewer can interpret it.
Why This Matters
That engulfing candlestick is not just a visual cue — it's a multiple level footprint.
It confirms everything we discussed earlier about how the market is manipulated — often in ways most traders can’t even begin to imagine. Two opposite forces within a zone. One prevails while the other reveals a future!
So now, let this sink in:
To truly master VSA, one must learn to read both languages.
The visible structure, and the hidden context.
One without the other is incomplete.
Now you know why Confirmation is so crucial.
That’s all for now. I hope that all the above paragraphs were able to give you a hint of how things work! And remember: Everything I write is just a small glimpse of the whole that needs to be considered.
Until next time — stay safe, trade wisely, and never stop learning.
Key Support Test – Will RAY Hold & Rally?$RAY/USDT chart shows a key retest of the breakout zone, which previously acted as resistance and is now a crucial support level. A successful bounce could confirm bullish continuation, while a breakdown may lead to further downside.
Additionally, the Stochastic RSI is signaling a bullish crossover at oversold levels, indicating potential upward momentum. If buyers hold this zone, RAY could see a strong rally.
DYOR, NFA

XAUUSD's Volatility: Will it Fake Us Out or Continue Long?Many have been anticipating Gold to move in both directions. Some are expecting a nice drop while others are camping out for that long. I've been on both sides. Here, I explain my reasons for wanting to Long Gold (XAUUSD) with anticipated targets for both a short-term sell and the buy continuation.
Please boost this if you like my ideas. Comment with your thoughts and/or agreement. I look forward to connecting!

Divergence Trading Explained For Beginners -DAX Pullback TradeTrading divergence in the Forex or Stock market can be an important tool. Learn how to identify divergences & practically apply them to your technical analysis to increase your edge & profits in the financial markets.
In this video you'll learn
What is a bullish and bearish divergence
How to use divergence to spot potential reversals in the market
How to use volume to identify key levels of reversals
How to measure out a "Kill Zone"
What are tweezer tops & tweezer bottoms & why they are important
How to use the Fibonacci retracement tool
How to use the Relative Strength Index (RSI Indicator)
Your Trading Coach - Akil

Updated Wave 5 Count XRPHello There,
From the price action today, I have updated the count with an ED or Ending Diagonal. Also I updated Wave 4 and I don't think it was a triangle, but a sideways combo. It is still possible for it to be a triangle, but would have to do a deep dive to confirm that count. Today on how low we went in the 4th of the Larger degree 5th, we broke wave 1 on varies exchanges and therefore, must go with the higher probable count of a ED.
The Final targets can vary, but I laid out two ranges for $3.8 - $4.4 ish. we will have to see how this ABC or structure forms.
After hitting this targets, I do expect an correction in the $1.5 - $2 ish range, before possibly going for the $8 - $12 range.. this correction will probably takes months, so I would recommend to take as much profit as possible this final move to the $4ish range.
Thank you,
God Bless and Trade on

XRP/USD Trade Update - Liquidity Grab & Potential Reversal I’m still holding my XRP/USD long position, but price recently broke to the downside from a wedge formation. Instead of continuing directly toward my TP, it’s now seeking engineered liquidity before making its next move.
🔎 Key Observations:
✅ Liquidity Grab: Price is dipping into a key liquidity zone, sweeping weak hands before a potential move back up.
✅ 30M Order Block: I’ve identified a demand zone around 2.8170, which could act as support for a reversal.
✅ Bullish Continuation? If price holds the 2.8170 area and reacts strongly, I anticipate a move back toward TP levels. However, if this zone fails, I’ll reassess my bias.
🎯 Plan Moving Forward:
📌 Watching the 30M order block reaction closely.
📌 If bullish confirmation appears, I expect a push back toward my TP.
📌 If invalidated, I’ll adjust my trade accordingly.
Let me know what you think—are you still bullish on XRP/USD? Drop your thoughts in the comments!
#XRPUSD #SmartMoneyConcepts #Liquidity #OrderBlocks #Forex #CryptoTrading
Bless Trading!

GBP/USD Bullish Setup: Buyers Show Strong InterestAnalysis:
The Cable (GBP/USD) on the hourly chart has demonstrated impressive strength to the upside recently. However, on Friday, we observed a trend-changing pullback, with price retreating from a high of 1.2502 to a low of 1.2426.
Following this, the price broke the previous high again before creating a momentum low at 1.2414 earlier today.
On the 5-minute chart, a bullish setup has now formed following the momentum low. This suggests that buyers remain engaged, and we could see a bullish move back towards the 1.2499 level or potentially the high of 1.2524.
Entry Price: 1.2447 Long Entry
Stop Loss: 1.2412
Happy trading!

Gold Market Weekly Analysis | XAUUSD Price action OutlookGold prices experienced a nearly 1% decline last week, largely influenced by a series of US economic data releases. Mixed signals from consumer and producer inflation reports kept markets cautious, but the lower-than-expected Initial Jobless Claims report strengthened investor confidence in a potential Federal Reserve rate cut at its December 17-18 meeting. Currently, traders are assigning a 93% probability to a 25 basis points (bps) rate reduction.
Next week promises to be eventful, with key US economic releases such as S&P Global Flash PMIs, Retail Sales, Industrial Production, and the core PCE Price Index, alongside the pivotal FOMC policy decision. These will play a critical role in shaping gold's trajectory.
In this video, I dive deep into the XAUUSD chart, breaking down technical and fundamental factors to help us navigate the upcoming trading week.
📢 Disclaimer: This video is for educational purposes only and does not constitute financial advice. Please consult with a professional before making trading decisions.
#GoldAnalysis #XAUUSD #GoldPriceForecast #FOMC #RateCut #ForexTrading #MarketOutlook

TP Hit, Letting Remains RunMore To The Upside Bias As We Above Both daily & Weekly.
Potential Discounts To Occur As We In OverBrought Zone, Therefore Pullbacks Retracements On The Rise Before Continuing To The UpSide.
Trade Safe Everyone.
Happy Wednesday.
😎

USDCHFThere is Bullish Trend forming pattern of ABCD. At HH find inverted hammer, price will come down to print HL. From there we buy and will ride the trend


Gold Price Outlook: Key Insights for Next Weeks Trading DecisionGold prices dropped to a three-week low, as investors dumped the Gold commodity for the U.S. dollar following Donald Trump's presidential victory. With expectations of a stronger dollar and potential inflation-driving tariffs under Trump, the Federal Reserve may rethink its easing cycle. This video breaks down key market moves and sentiment shifts post-election, as traders reassess their ‘Trump trade’ strategies amid tariff uncertainty.
Looking ahead, next week's U.S. economic data releases—including inflation and retail sales—along with comments from Federal Reserve officials, are set to shape Gold’s direction. Join us to analyze the behavioural trends impacting XAU/USD and prepare for new trading opportunities in the week ahead.
#GoldMarket #XAUUSD #ForexTrading #TrumpEffect #USDollar #GoldAnalysis #TechnicalAnalysis #MarketOutlook
Disclaimer Notice:
Trading in the foreign exchange market and other instruments carries a high risk and may not be suitable for all investors. The content provided here is for educational purposes only. Evaluate your financial situation and consult with a financial advisor before making any investment decisions. Past performance is not indicative of future results.

Gold : BUYGold bullish trading is a compelling option for investors and traders who aim to capitalize on the rising value of gold in global markets. Often considered a "safe haven" asset, gold tends to attract significant attention during times of economic uncertainty, inflation, and market volatility. A bullish approach to gold trading generally involves betting on its price increase through a variety of strategies, from spot trading and futures to gold ETFs and mining stocks.
One of the primary appeals of a bullish gold strategy is its potential to hedge against inflation. As fiat currencies lose purchasing power, gold's intrinsic value often holds steady or rises, making it an ideal asset to protect wealth. Furthermore, global demand for gold remains robust, with central banks, jewelers, and technology sectors consistently creating a strong foundation for its long-term appreciation.
In terms of trading, bullish positions in gold can be profitable, especially when paired with technical analysis and macroeconomic indicators. Many traders look for signs of economic instability, like geopolitical tensions or declining interest rates, as signals to enter bullish gold trades. In such conditions, spot prices often surge, rewarding those with bullish positions.
However, gold trading also requires caution, as the market can experience pullbacks due to profit-taking or shifts in monetary policy. Moreover, gold’s movements can sometimes be sluggish compared to other assets, so timing is essential to maximize gains. Risk management strategies, such as stop-loss orders, are essential in volatile markets to safeguard profits.
Overall, gold bullish trading is a reliable way to diversify a portfolio and hedge against economic downturns. With the right market insights and risk management, traders can benefit from this timeless asset’s long-standing value and stability.

trendline break strategythis is a trendline strategy based on resistance and support.good old price action

Gold Price Outlook: Key Insights for Next Weeks Trading DecisionAs we head into the new week, gold prices remain resilient, fueled by heightened Middle East tensions and U.S. election uncertainty that keeps investors seeking safe-haven assets. Despite dollar strength and recent rate cuts by the Federal Reserve, gold has surged over 32% this year, reflecting sustained demand in the face of global instability.
In this analysis, we cover critical areas for buyers and sellers alike, focusing on structural patterns, market psychology, and potential trade opportunities you won’t want to miss. Whether you're watching the price action or setting up entry points, these insights will equip you with a clear roadmap for the week ahead.
Will gold continue its strong performance, or could a new catalyst shift the trend?
📌 Stay tuned as we navigate the next big moves in the Gold market!
#goldprice #goldtrading #investing #commodities #marketanalysis #tradingstrategy #goldforecast #geopolitics #election2024 #safehaven #financialmarkets #forex #daytrading #swingtrading #middleeast #usdollar #economicuncertainty📺🔔💼
Disclaimer Notice:
Trading in the foreign exchange market and other instruments carries a high risk and may not be suitable for all investors. The content provided here is for educational purposes only. Evaluate your financial situation and consult with a financial advisor before making any investment decisions. Past performance is not indicative of future results.

GU look like it setting up for a nice entry for London sessionI been looking for a solid sell entry to continue the bearish trend that GU has been in. The dollar failed to break out and is now retracing to grab more liquidity to push up. in turn giving us a nice entry for a sale. We have to be patient and allow price to find its resistance levels. Expecting a nice set up for London.

Gold Surges After U.S. Inflation Data | New perspective In this week’s analysis, we dive into Gold's 1% surge following U.S. inflation data, which has sparked fresh uncertainty over inflation trends and boosted demand for safe-haven assets. The Consumer Price Index rose by 0.2% last month, while bullish PPI figures suggest the Fed could be on track for interest rate cuts in 2024.
With escalating geopolitical tensions, could Gold rally beyond $3,000 before year-end?
XAUUSD Technical Overview:
This week, we’re zeroing in on the critical $2,660 zone. If Gold stays above this level, bulls may maintain control, potentially pushing prices to new highs. However, if Gold dips below, bears could force a pullback toward the descending channel’s support line.
📌 Stay tuned as we navigate the next big moves in the Gold market!
#GoldMarket #XAUUSD #InflationData #FederalReserve #SafeHavenAssets #Geopolitics #MarketAnalysis📺🔔💼
Disclaimer Notice:
Trading in the foreign exchange market and other instruments carries a high risk and may not be suitable for all investors. The content provided here is for educational purposes only. Evaluate your financial situation and consult with a financial advisor before making any investment decisions. Past performance is not indicative of future results.

EURUSD Further Up Trend potentialEURUSD has been in a bullish trend, and the recent impulse move down, followed by a pullback that took out liquidity below the 1.1100 support level, could signal the end of a correction. This behaviour is typical in bullish markets, where price pulls back to gather liquidity before resuming the upward trend. Given the overall bullish sentiment, there is a strong potential for a continuation of the trend.
With strong bullish momentum, the market may be set to break through last month's high. The target is the resistance zone around 1.12000

XAUUSD | GOLDSPOT | New perspective | follow-up detailThe Federal Reserve delivered a surprise 50 basis point rate cut, sending gold prices skyrocketing past $2,600! 🤯 This larger-than-expected cut underscores the Fed's commitment to maintaining low unemployment as inflation continues to ease. 📉
🚨 Gold prices surged past $2,600, reaching all-time highs as speculation grows that the Fed will keep lowering borrowing costs. Along with rising geopolitical tensions in the Middle East, global central banks are now expected to follow the Fed's path of easing monetary policy and slashing interest rates. 🌍
The Fed’s December 2024 fund rate futures suggest another significant drop, with 53 basis points expected across the final two meetings this year. Markets are now pricing in a 25 bps cut in both November and December.
📅 What’s Next? Looking ahead to next week, key Fed figures like Atlanta Fed’s Raphael Bostic, Chicago’s Austan Goolsbee, and Minnesota’s Neel Kashkari will take center stage. Important data releases, including S&P Global Flash PMIs, housing data, and the Fed’s preferred inflation gauge, the Core Personal Consumption Expenditures (PCE) Price Index, will also play a vital role in shaping the XAU/USD outlook.
🔍 In this video, we analyze the technical structure of the gold chart and key fundamental factors to prepare for next week's trading.
XAUUSD Technical Overview:
This week, we're focusing on the $2,590 zone. This could be a make-or-break point. If gold stays above this zone: Bulls might maintain control, potentially pushing prices higher and setting up new highs. If gold drops below the zone, Bears might gain the upper hand in an attempt to retrace into the structure-support line of the ascending channel. Join me as we explore these factors and potential opportunities in the gold market. Like, subscribe, and hit the notification bell for the latest analysis and insights!
📌 Follow my journey as I map out the next moves in this dynamic market!
#GoldPrices #XAUUSD #FederalReserve #InterestRates #JeromePowell #RateCuts #MiddleEastTensions #GoldTechnicalAnalysis #FOMC #MarketAnalysis #Inflation #GoldTrading #ForexTrading📺🔔💼
Disclaimer Notice:
Trading in the foreign exchange market and other instruments carries a high risk and may not be suitable for all investors. The content provided here is for educational purposes only. Evaluate your financial situation and consult with a financial advisor before making any investment decisions. Past performance is not indicative of future results.

GBPUSD 1.31319 -0.09 % INTRADAY SET-UP SHORT IDEA NY SESSIONHELLO TRADERS
Hope everyone is doing great
📌 A look at The CABLE Heading into the NY PM SESSION
* Still on a bearish Overflow on the 4H looking for a continuation with the bears on GU.
* We just put in a short term high which might possibly be inducement with that 4h -OB but we will see with price.
* sweep of the short term high would signal mitigation of the -OB and should it hold will be looking for possible shorts at the Oder-block.
1H GBPUSD
The 1H -ob is rejecting with London pushing into this PD ARRAY, closure will be a signal for directional bias on GU heading into NY and towards the closure of London.
* Rejection at this OB possibly signals continuation with the bears.
15M
* Looking for the take of that ERL.
* Looks like we are in a seek & destroy profile looking to take as such
* awaiting the 4H to confirm directional bias heading into NY am session.
* BASED on the price action served next session...
* We will see what does the market dish.
🤷♂️😉🐻📉🐮📈
HOPE YOU ENJOYED THIS OUT LOOK, SHARE YOUR PLAN BELOW,🚀 & LETS TAKE SOME WINS THIS WEEK.
SEE YOU ON THE CHARTS.
IF THIS IDEA ASSISTS IN ANY WAY OR IF YOU ENJOYED THIS ONE
SMASH THAT 🚀 & LEAVE A COMMENT.
ALWAYS APPRECIATED
____________________________________________________________________________________________________________________
Kindly follow your entry rules on entries & stops. |* Some of The idea's may be predictive yet are not financial advice or signals. | *Trading plans can change at anytime reactive to the market. | * Many stars must align with the plan before executing the trade, kindly follow your rules & RISK MANAGEMENT.
_____________________________________________________________________________________________________________________
|
* ENTRY & SL -KINDLY FOLLOW YOUR RULES | * RISK-MANAGEMENT | *PERIOD - I TAKE MY TRADES ON A INTRA DAY SESSIONS BASIS THIS IS NOT FINACIAL ADVICE TO EXCECUTE ❤
LOVELY TRADING WEEK TO YOU!

GBPUSD | Perspective for the new week | Follow-upThe British Pound gains significant traction as the UK Office for National Statistics reports a rebound in Retail Sales for July, with monthly and annual figures rising by 0.5% and 1.4% respectively. This momentum comes ahead of the Bank of England’s (BoE) crucial September monetary policy meeting, where decisions could hinge on the sharp decline in service sector inflation and a surprising drop in the Unemployment Rate, signalling an expanding economy.
On the US front, jobless claims continue to fall for the second consecutive week, challenging the earlier Nonfarm Payrolls (NFP) data that suggested a weaker labor market. Market speculation for large rate cuts has eased, yet expectations for a dovish Federal Reserve decision in September remain strong, with policymakers signalling comfort with upcoming interest-rate cuts.
With these recent developments, the GBPUSD remains in a volatile state. The rebound in UK retail sales and the positive signals from the US labor market suggests that there is potential for further gains for the British pound. However, the BoE's policy decision and the Fed's stance on interest rates will be key factors to watch in the coming weeks.
How will buyers and sellers position themselves in the coming week?
GBPUSD Technical Analysis:
Will buyers break above $1.29500 next week? Watch this video for key trades this week. Join the discussion for updates on GBP/USD trading. Stay tuned for more content. Happy trading!
Disclaimer Notice:
Trading in the foreign exchange market and other instruments carries high risk and may not be suitable for all investors. The content provided here is for educational purposes only. Evaluate your financial situation and consult with a financial advisor before making any investment decisions. Past performance is not indicative of future results.

XAUUSD | GOLDSPOT | New perspective | follow-up detailGold (XAU/USD) prices surged to near $2,430 in Friday's New York session, rebounding after a turbulent week sparked by the Bank of Japan's surprise rate hike. But with the Fed's potential September rate cut looming, will gold continue its climb?
The recent recovery highlights a firm near-term outlook for gold, driven by strong speculation that the Federal Reserve (Fed) will begin reducing interest rates in September.
There is ongoing debate among investors about the Fed’s approach to rate cuts. Some are anticipating a more aggressive 50 basis point (bp) reduction, while others expect a 25 bp cut. According to the CME FedWatch tool, current 30-day Federal Funds futures data shows a 54.5% probability of a 50 bp cut in September. Additionally, projections for the year indicate a potential total reduction of 100 bps.
In this video, I explored the current market sentiment, weighed the chances of both buyers and sellers in this volatile environment and discussed how to prepare for potential trading opportunities in the upcoming week.
XAUUSD Technical Overview:
This week, we're focusing on the $2,425 zone. This could be a make-or-break point just like it did last week. If gold stays above this zone: Bulls might maintain control, potentially pushing prices higher and setting up new highs. If gold drops below the zone then Bears might gain the upper hand in an attempt to retrace into the structure-support line of the ascending channel in the process. Join me as we explore these factors and potential opportunities in the gold market. Like, subscribe, and hit the notification bell for the latest analysis and insights!
📌 Follow my journey as I map out the next moves in this dynamic market!
#gold #goldprice #goldtrading #swingtrading #marketanalysis #fed #rates #economy #usdata #nonfarmpayrolls #tradingstrategy #technicalanalysis #investing #finance #goldinvestors #goldbugs #goldnews #marketupdate📺🔔💼
Disclaimer Notice:
Trading in the foreign exchange market and other instruments carries a high risk and may not be suitable for all investors. The content provided here is for educational purposes only. Evaluate your financial situation and consult with a financial advisor before making any investment decisions. Past performance is not indicative of future results.
