Trendcontinuation

NZDCAD - ShortLooking for a break and close past the recent lows and a continuation down to next level of support

BITCOIN BULL RUNI still see Bitcoin raising the stakes by another $2,000 before seeing a Long Term Significant Drop in Price. Bitcoin doesn't per-say move by Fully Detail Technical Analysis (Patterns) more about how price reacts around Historical Data, the more predictable moves happen due to watching detail in price fluctuation.

USDCZK Trend Continuation Currently waiting on price to show some sort of minor exhaustion at this interesting area to continue this Bull Run. (Descending Trend Breakout Strategy)

AUDJPYAfter the big down move we are now getting the retest. We could see another bearish wave. Price would need to stay below the previous high of the breakout

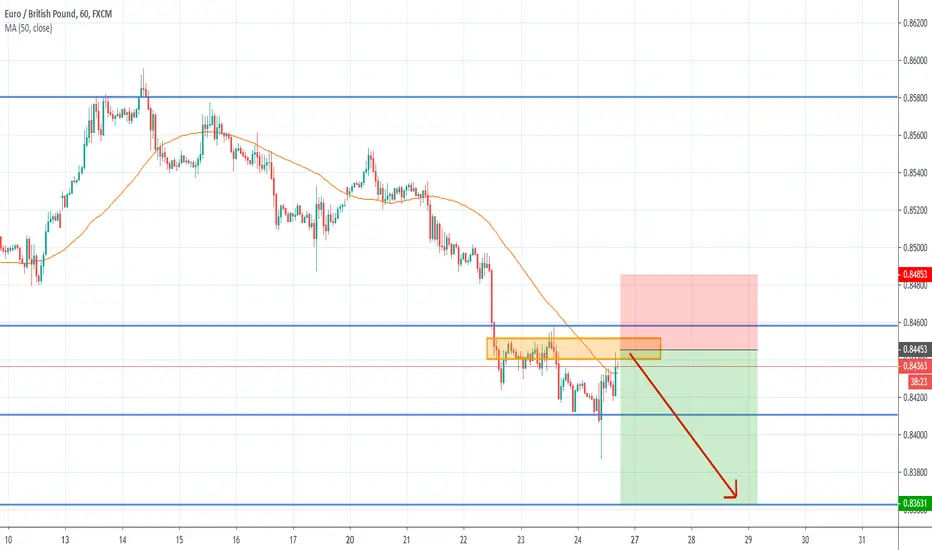
EURGBP - Still BearishHi Traders!
The market is now in a strong downtrend.
In a healthy trend, it is often difficult to look for an area from where the market could bounce back or continue.
That's why we use the 50 period MA to identify where the market is at an important level.
Now the market is in a retracement move.
The 50 period MA is also touching the price, so now it could possibl continue its trend.
The risk-to-reward ratio is 1 to 2.
We recommend to sell the Trend Continuation at the resistance area and the 50MA.
Thanks and good luck :)!
XBTUSDThinking of buying more contracts once and if the market comes back to the $8200 i have already closed half my position for some profits just going to wait for a pull back to buy more. if it doesn't pull back then at least i am still in the trade . targets are $9400 area.

USDCAD Short: 61.8 Fib level & 100 Moving AverageSo, we have double indication for USDCAD to continue its way down. First, it bounced off 61.8 fibo level, which is a major fibo level. Second, it keeps making lower-highs after the price touched 100 period Moving Average line represented in orange, which I like because people can produce dozens of different analysis in their charts using different methods but 100 period Moving Average line is the same everywhere in the world. It's objective, and I like objective things. I'd like to wait for a break of structure in much lower time frame before considering a short position, coz, y'know... entry precision and stuff. Cheers!

BITCOIN looks very BULLISH - This is where you can BUYHey tradomaniacs,
Bitcoin looks overall very bullish and could initiate new Up-MOMENTUM very soon in order to continue the uptrend.
In this scenario I can clearly see two chance to buy Bitcoin after the breakout of the current correction in form of a FLAG-Pattern.
The market is currently fighting between three significant MA`s and has shown more momentum upwards after breaking above the 200 M/A which could be our new support.
The best scenario would be another re-test of 6.000 which is a high supply-zone looking at the weekly chart.
We`d have a nice chance to buy Bitcoin for a low price before it should get back to 12.000 - 14.000.
The second chance to buy would be the break above the current trendline and resistance-fan the market has created @ 9.000.
Wait for the brekaout and a retest of the current market-structure before you buy.
We see lots of bullish divergences indicating a weakness of bears here.
Good Luck! =)
-----------------------------
LEAVE A LIKE AND A COMMENT - I appreciate every support! =)
Peace and good trades
Irasor
Wanna see more? Don`t forget to follow me.
Any questions? PM me. :-)

May the trend ContinueHome Depot shows a beautiful pullback to 200 moving average and also Fib 0.382, looks like it will continue the trend towards the golden ratio of 257$ Golden ratio 1.618

GBPAUD - Long SetupMy bias on GA still remaining bullish, based on structure we will ending the correction phase and ready to rally to the upside.

Simple Lower time frame trend continuation tradeSimple trend continuation using Fibonacci to measure out entry zone and extended targets

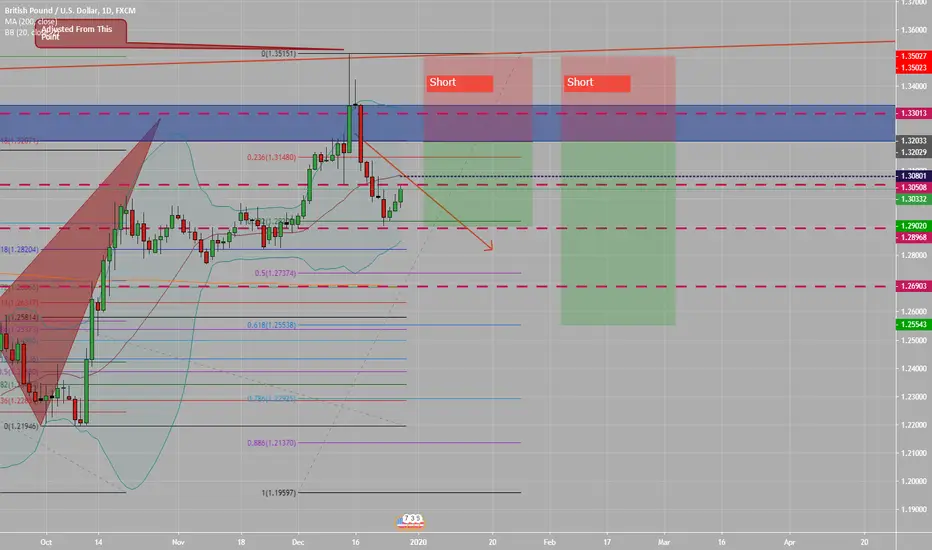
Next Level To Add To GBPUSD Short Is 1.3080 But..Next Level To Add To GBPUSD Short Is 1.3080 But..
We must have a strop loss above 61.8 Fib level i.e. 1.32547
Target1: 1.2900
Target2: 1.2696
Target3: 1.2550
GBPUSD - Trend Continuation - Bearish Flag + RetestHi Traders!
As you can see the market is in a healthy downtrend.
The market even broke out of the support at 1.29700.
The candle which broke out was a very strong candle in relation to the others.
That is a sign of strength in the market.
After that the market retests the area with a bearish flag.
If the market bounces back successfully, then there is a good chance of a trend continuation.
We recommend to sell the break of the flag with a risk-to-reward of 1 to 2.5.
Thanks and good luck :)!

GBPUSD-Weekly Market Analysis-Dec19,Wk3As expected, the bullish flag(chart on the link on related ideas), focus on the bullish flag) is going to make its dealing. This is of course due to the UK General Election of the Conservative party winning the majority seats, which I've mentioned in my previous analysis.
Congrats to those who have engaged the trade. At this moment, I'm waiting for a retracement into the buy zone and engage in a longer-term trade.

EURPLN - D - H4 TRENDFOLLOWING - TOP CR 5.99HELLO COMMUNITY,
HERE IS MY LONG IDEA FOR THE EURPLN / EURO - POLISH ZLOTY.
IF YOU LIKE MY IDEAS THEN PLEASE LEAVE A LIKE AND FOLLOW ME.
1. STRONG SUPPORT
2. THE BULLS COME IN THE MARKET
3. HIGHER LOW
4. H4 UP TREND
5. MY ORDER
BEST REGARDS

EurUsdEurUsd 60 put an impulsive move to the downisde breaking through support and now we are in the clear to go to lower levels of support just below. The blue zones underneath are potential extended targets you can take based on your approach. We are currently putting in some nice small rejection candles on the 60 into our previous support now resistance levels so we can see the push down from here should this strong move continue to the downside. We also have RSI oversold which is a nice sign of strength.

EURNOK Short IdeaLast week finally closed out with a breakout of Price is Major Uptrend Channel. Will be waiting for an exhaustion after price plummets bearish, Fibonacci retracement and Extension will be key in this trading idea with the 38% lining up with our retest of breakout trendline and showing a major continuation in bearish trend.

BASICS TECHNICAL ANALYSIS - TRENDFOLLOW FORMATIONFORMATION ANALYSIS: PRICE PATTERNS AND CHART FORMATIONS
A trend setting of technical analysis is formation analysis. In doing so, certain combinations of movement and correction are considered.
If such a combination is detected, the trader can try to trade the resolution of the formation.
Basically, a different is made between the trend continuation formations and the trend reversal formations.
They are often caused by resistance and support lines.
Trend continuation pattern:
Confirm the strength of a trend. These are, for example, rising / falling triangles. Even flags and pennants (see picture) are seen as a trend continuation.

Trade Ideas Position: AUDCAD GartleyA bearish gartley setup on a trend trading opportunity that was spotted by HPA. Trade waiting for confirmation to engage.

NZDCAD LONG CONTIUATIONThis pair tends to make double bottoms every swing low before continuing, so far price hasn't achieved one at Support which was our heavy Resistance before hand. An engulfing candle/ Bullish momentum would be a great indication that Buyers are in fact entering this area.

GBPNZD SHORT OPPORTUNITY Using Structural Trading Analysis, I'd like to see price break its support and speculate 4hr time frame price action to find a reason to enter this bearish continuation.

CHFJPY BEARISH CONTINUATIONPrice has reached and ranged at Resistance and continued to show that Buyers are going to be able to break above this time, price then showed our first impulsive leg. After an impulse we wait for a correction, our most ideal and picture perfect entry would be at the 38% matched with whats our new resistance but I do see how price can retrace to the 61.8 % faking our and stumbling all sellers that are ready to enter at the 38%. Elliot wave rules are met if price retraces to the 61.8% then a Sell Order may be placed. Let's allow price to fluctuate then begin to look for an entry, Short.
