Trendcontinuation

S&P / NZX 50 Index Gross - Risk RewardNZX:NZ50G
These trades are the ones that change your account tremendously.
You can trade with technical analysis, with fundamental analysis, with quantitative analysis.
What counts is having Risk Reward and Winrate that determine a positive Profit Factor on your strategies and therefore a growth on a statistical basis.

US30 BULLISH TREND CONTINUATION Price Action (Technical Analysis): Looking for a Bullish Hammer or Long Lower Shadow in the 4hour/Daily before entering long on the pullback to previous structure.
Fundamental Analysis: DXY, being shorted.

FSLR - Bullish trend since Nov 2018, Buy the DipBought the fear of trade war Yuan news, looking for a long term uptrend with medium term healthy swings within a steady channel.
Looking to swing trade tops and bottoms as long as we are in the parallel channel.
I look for opportunity in stable range, slow volatility, good entry / exit points and also it helps if the company seems well placed for the current zeitgeist.
The trick is to have overall diversification of assets, but also enough of these monthly plays that allows a higher frequency of trades.

Expecting C wave to complete at the .618 of the 06/26 high At the green box (green) to complete Wave 2 then up for Wave 3
levels indicated in chart
Don't follow my analysis unless you agree
and as always, it's on you
PGBGL

NzdJpy Trend ContinuationClean Trend on NzdJpy 60 but overall at support on the HTFs so only looking for a retest and no extensions to the downside, decent strength on the RSI aswell

AudJpy Trend ContinuationAudJpy has a bit more legs in my opinion despite the double bottom touching off a minor support level I belive we can get a retest and also maybe a follow through slightly lower


Market structure retestSo we seen price breakout the low and then give us a retest at 0.69730 area on the 15min and failed to break back up above it meaning to me that price should still continue further down to previous market low @0.69200 and i have my stop loss at previous market WICK high which is at 0.69910 meaning my ratio is a is a 7:1 i will keep posting simplicit trades as they are key to my trading ideas and swinging for hours on end im anticipating on holding these trades till tp gets hit or i will have a trailing 200 pip tp @.69530 once price gets to 69.430 if price struggles to break the .69530 then i will move my sl to take profit. feedback is welcome

EurChf Trend ContinuationNice clean and strong downtrend on the 60 coming off minor support but I think it can get retested at least. Daily held support and currently oversold in a downtrend which is slightly conflicting but decision is made off the 60.

EurAud Trend ContinuationEurAud has put in a new low again on the 60 with a Head and Shoulders pattern on daily adding confluence to the setup. I think we can get a retest of the lows at least and wouldn't look further due to the divergence on the RSI swings but a decent opportunity nevertheless.


CADJPY BEARISH STRUCTURE BOUNCECADJPY is at the edge of downward structure with bearish hidden divergence. Time to go down !
Follow me for more amazing setups.

Trade Ideas Position: USDJPY SharkBearish Shark triggered in the morning, if you have not traded this and understand harmonic pattern well, the 2nd target still provides a 2:1 Reward is to Risk Ratio(RRR)

EurAud ShortMinor break so we can expect a slightly deeper pullback preferably and 'expected' from the zones drawn out. Some room to go down lower but I will only play for the retest if an entry reason presents itself.

UsdCad Short ContinuationFollowing a break of structure if we pullback to any of the zones in red. We tend to go to the deeper levels of structure so there is some room to go lower but it isnt smooth sailing either.

AudJpy Pullback ContinuationIf we get a pullback to the zone I can see us retesting the highs due to the strength of the move. However you do want to be wary of the Daily downtrend currently despite being in a wick of support.

EUR/JPY Wave analysisThe counter is in a long-term bearish trend.
However, the short-term trend suggests a short-term sideways trend.
The range is defined in a bearish flag formation and it is the wave 4 of the bearish cycle.
We expect the pair to wither the sideways trend upon reaching the resistive trendline and restart its bearish trend.

Overall view of EURUSD - Update of June 24thPrices broke the resistance zone giving more room for a continuous bull trend, after forming a Higher Low @1.11800 near the low of the year @1.11080.
Possible targets: @1.14500 (+50pips) and @1.15000 (+100 pips).
Advice: Stay bullish and buy at any low point while we don't break down the resistance zone (became a support magnet) or 1.13000 bottom level.

NzdJpy Trend Continuation/Potential Head and ShouldersNzdJpy has come to minor level of resistance and we dont really have as much conviction in the swings and currently pulling back quite deep so can see a potential head and shoulders too.

GbpNzd ShortDecent trend on the GbpNzd with a violation of support and room to go lower,decent Rsi strength aswell and a nice minor supply zone within my killzone.

NzdUsd longDecent Long opportunity on the NzdUsd with some room to go higher after a few levels of structure being broken, You would want to be wary of the minor zone below the killzone drawn out but a decent opportunity. If we get the pullback I would be looking to buy it up.

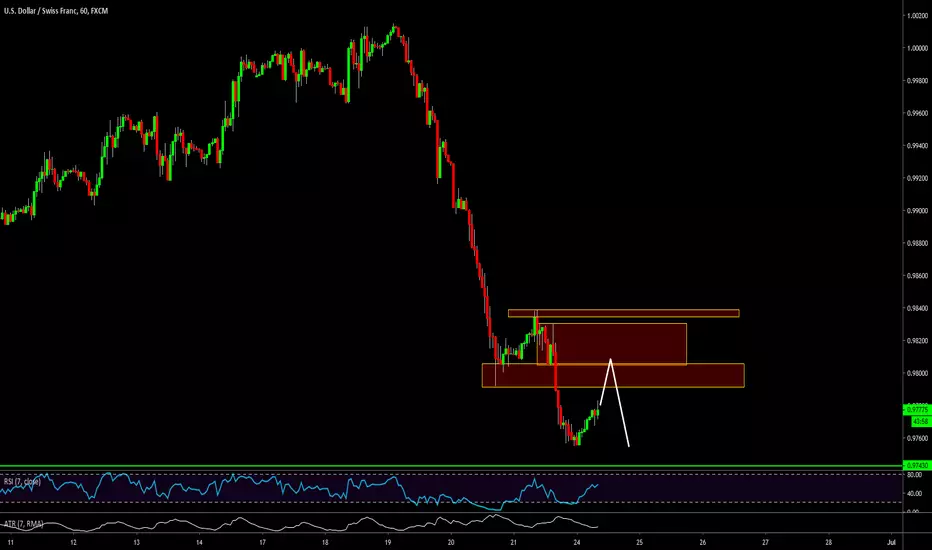
UsdChf Trend Continuation ShortDecent opportunity on the Chf today with some room to go down to the next level of support, pullback in this killzone is something to look at for an entry reason. Specifically like the minor level within the zone for but anywhere there works.