SP500 Short on downtrend continuation ??Reason to Short
1) SP500 = downtrend
2) Near-term support broken
stay tuned!
Trendcontinuation

EUR/USD: The years-end-analysis - Likely to see PARITY!Hey Tradomaniacs,
welcome to another weekly overview of EUR/USD!
Let`s take a look at the year and what we see is a huge Sell-Off aswell!
EUR/USD started this year @ 1,19873 and found our years high @ 1,25628 in feburary.
After that we`ve just consolidated in a range between the peak and 1,22.
FED`s rate hikes consistently punished the EUR which was affected by many different political circumstances
like Brexit, italy, france and so on.
The European Central Bank decided to quit the QE not as expected - But these might be the first signs of a hawkish policy.
But will we seriously see a rate hike this year? I don`t think so.
What is the consequence of the financial crisis in 2008?
The ECB did nothing else than shifting a problem with financial injections by a ZERO-interest-rate-policy
and the Money-Print-Rage + the QE.
I bet you`ve heared about the quantity equation.
The best way to fight inflation is to increase the interest rate. Since the recession is slowly on its way to destroy
our economy again indicated by a cooling down economy and stockmarket the ECB can not just increase the interest-rate in 2019
as planned and Draghi probably wont even increase them during his term.
Why? Because the only way to suppor the economy is cheap debts/money/credits.
Technical aspects:
--------------------------------------------------------------------------------------------------------------------
After the break through the Neckline we`ve seen a test of the 61,6% retracement and could show us the first impulse
after the breakout of this S/H/S-Pattern. the next move is a retracement back to the trendline, where we bounced off again
and created a doji aboce the candles body.
Is all this a retracement ala kissback before we continue the journey to the south called "parity"?
The FED`s policy is pretty hawkish because Jerome Powel has officially confirmed that the FED-PUT is gone.
He won`t take a look at the Wallstreet anymore and prefers to take the economy and its climate as his indicator for his monetary policy.
The S/H/S-Pattern target would be @ 1,05 which is between the 1.414 and 1.618 Fibonacci-Extension.
The time-Zones are pretty accurate and should be taken seriously.
Conclusion: I`m more bearish but it`s all up to the political situations around us in Europe plus
the ECB`s upcoming desicions.
--------------------------------------------------------------------------------------------------------------------
We will see what happens!
I WISH YOU A HAPPY NEW YEARS EVE! Enjoy the time with family and friends! :-)
---------------------------------------------------------------------------------------
LEAVE A LIKE AND A COMMENT - I appreciate every support! =)
Peace and good trades
Irasor
Wanna see more? Don`t forget to follow me.
Any questions? PM me. :-)

How To Read Structure (Charts) Tutorial- Section: 3 Charts 12-18The highly anticipated release of the How to read structure tutorial is finally here! Thank you for your patience traders, lets get right into it. In Section one and two of the how to read structure tutorial, we spent a lot of time going over the process that I use to identify potential reversals as well as what I consider to be confirmation of a trend reversal. In this section we are going to learn why I use this process & how it helps me identify the difference between a pull back and an actual reversal. We are also going to take our first detailed look into how this process is used to identify trading ranges as they are occurring & we will end with a brief introduction regarding how to properly use multiple timeframes to increase your strategies performance and overall returns.
Section 3 Will Consist of 7 Charts:
Chart 12- Simple Pullbacks Explained.
Chart 13- One Simple Way To Identify A Fake Reversal + Identifying The Complex Pullback.
Chart 14- My Method Of Identifying Trading Ranges Before They Occur.
Chart 15/16- Continuation Of Chart 14 & Why The Complex Pullback Method Is Effective.
Chart 17/18- An Effective Way To Use Multiple Timeframes With A Strategy.
Chart 12- Simple Pullbacks Explained & Ground Work For Learning The Complex Pullback Method
The majority of people who try their hand at trading, do not have any formal training or education of any kind therefore most of the trading related knowledge they learn is obtained through free sources, books or online courses that never fully go all the way, leaving them with a ton of questions and confused. Proper chart reading and structure analysis is one of the most commonly misunderstood aspects amongst novice traders, and at little to no fault of their own. It is important to understand that not all structure analysis is the performed the same, each trader may have his/her own process for reading structure so if this is a topic you wish to learn, I highly recommend learning one traders specific process to avoid confusion and conflicts with education that you may have learned elsewhere.
Chart 13- One Simple Way To Identify A Fake Reversal & Identifying The Complex Pullback (my process)
It is said and assumed that- "In order to identify a trading range, price must trade in it for an extended period of time". This is true with the traditional method of technical analysis however the Complex Pullback is an advanced structure analysis method that I have used to successfully identify trading ranges as they are occurring for years... With this method, we do not have to wait for a trading range to be established before identifying it as one, which gives us the ability to spot & avoid many false reversals. Incorporating this method into your strategies, can dramatically increase its performance & returns. Please see the chart below to get a better understanding of how this method works.
Chart 14- My Method Of Identifying Trading Ranges Before They Occur
Chart 15/16- Continuation Of Chart 14 & Why The Complex Pullback Method Is Effective
Each 4hr candle represents 4hrs of price action therefore, each 4hr candle can be seen as 4- 1hr candles. Lower timeframes, can be used to obtain more information about price action. For example- If your strategy uses a specific candlestick as an entry signal, dropping down to the 1hr chart would give you an additional 3 candles which would result in 3 more opportunities for your entry signal to appear.
Chart 17/18- An Effective Way To Use Multiple Timeframes With A Strategy
As always, I hope this tutorial was helpful to you. Please leave your feedback in the comments below, & if you got value from this please share & give the tutorial a thumbs up. Your Shares & Likes really help to get these tutorials out to traders who are trying to learn, While your feedback lets me know that these free tutorials are helpful to you. I will continue to share them if they are of value. If you would like to learn more about how to read charts, and structure based trading please see sections 1 & 2 of the "How to read charts, structure based trading tutorials" (linked in the related ideas section below) or head over to TradersNsights:
Courses/Lessons
Forex Coaching
To request a tutorial or topics you would like to see in the future, Fill out a quick request form and enter "Request" in the subject field or simply comment below.
More Free Trading Related Education

XAUUSD to reach 1260
The price of the XAUUSD has skyrocketed by the bullish market. Due to this uptrend, the trend lines of the triangle have been broken.
From this we can say that a new trend is under way. After zone 1240 has passed, a temporary pullback is created.
when this pullback ends there will be a new upward movement. I think that this upward trend will have a minimal effect towards the 1260 zone.
For now, the small (blue) trendline is respected. If this continues, I expect that the price will reach the TP.
If our TP is reached and the analysis went well, we have a profit of:
- TP #1 +/- 160 pips
The safest place for a stop loss is point 1235.00 ( +/- 80 pips). You can of course always adjust this. This is due to the operation of your own money management.

AUDCAD Short - 1HR TF bearish trend continuationHi, guys I hope that you are all well!
Typically at this time of year markets generally quite down due to Christmas approaching, however we are seeing some strong moves in the market across my portfolio and AUDCAD happens to be one of them.
What I am looking for is bearish trend continuation following a pullback up into the most recent area of consolidation/range in anticipation for sellers to step back into the market and make one final retest of the lows at .9570's.
So far price action has tested this area/kill zone a few times and buyers continue to find resistance.
RSI has also gone OB (80) but I am still yet to get an entry myself as price action has not yet formed a valid LLLC candlestick within the identified kill zone and until I have the entry reason I cannot enter just yet.
We do also have some FIB confluence within the kill zone to add further reason for why sellers could step back into this market and the next level of structure support being down at lows of .9560's
I will continue to monitor this pair and hopefully I will get my entry reasons met and able to get involved in the trade itself.
Trade with confidence,
Henri W.

Simple Patterns Tutorial, The Correct Way To Trade Double Tops In this short tutorial, we will look at the three most common Double Top formations along with how to properly trade them and when/where they typically appear on a chart. Double Tops work very well as trend continuation patterns for the obvious reason that you are trading with the underlying trend (strength) in the market however, Double Tops can also be a great tool for identifying and trading trend reversals. I do not recommend trading these patterns as reversals at every support or resistance level, as trading this way will most likely not be a consistently profitable trading strategy. One method to trading these patterns as reversals is to use higher timeframes to identify important price levels.
For Example- You may use the Daily chart to identify important support/resistance structure levels while using the 1hr chart to actually identify and trade the double top itself.. Every strategy should have something called conditions and criteria's for entry.. If you follow my work, you have heard me say this in the past. In the case of this example, A daily level of structure Support/Resistance would be our condition and a double top on the 1hr chart would be our criteria for entry.. You rules should state this:
Condition:
1) Price must retest a daily level of support or resistance in order to look for entry criteria.
Criteria:
1) After price has retested a daily level of support/resistance, I am allowed to look for a double top
entry on the 60 minutes timeframe.
-See example of this exact trade at bottom of description (Chart 4 and 5)
Chart One: Most Common Double Tops
Chart Two: Examples Of Double Top Reversals & Trend Continuation
Chart Three: Double Top Trade Examples
Chart Four: Daily Retest Of Support/Resistance:
Chart Five: Double Top On 60 Minute Timeframe:
Often, you will notice that price is up-trending on the daily chart but down-trending on the hourly charts. Many traders get confused regarding how to handle this confliction of trend.. One way to handle this is by doing what is stated above. Use a higher timeframe like the daily chart to find important price levels, and use a lower timeframe like the hourly or minute charts to trade at these levels. Just because the daily trend is up does not mean we cannot trade a double top reversal on the 1hr chart as that timeframe may be down-trending in a perfectly healthy daily uptrend.. I hope this was explained clearly, please feel free to ask me any questions
you have in the comments below or via private chat & I will be happy to help. Also please let me know what double top you think is the best to trade (see chart 3) in the comments below. I will do a follow up lesson to answer this question I am asking you. I think the answer may surprise you & know it will be a AAH-HHA moment in your trading journey!
If you would like to put in a request regarding what trading content you'd like to learn more about, please use the link below to submit a vote for future trading tutorials and topics!
tradersnsights.myshopify.com
Free Position Size Calculator:
goo.gl
TradersNsights Facebook:
www.facebook.com
Thanks Traders, as always I hope this was helpful to you!

Finna go Short on GBPUSDA simple analysis, all circle with color coded (blue and red) represent where I point out the fibo, as I expecting, this week flow it gonna be a pullback (like on past week) and continuation of downtrend till hit 161.80% (might not hit but nearly to that particular level) . gotta keep on eye during NFP (every 1st week of the month).
all the best traders.

Trade Ideas Position: GBPUSD BatBearish Bat spotted as it is a trend continuation trade, I will be taking some extended targets.
Having the knowledge of Harmonic Patterns and Structure, gave us an edge in our trading results.
Last month alone, we produced a total of 2,333pips of net profits to our subscribers.
If you do not want to miss any more trade ideas, just subscribe to us by clicking the link below:
forex100academy.com

Psychological trading hack #0003 - finding your true friendIs finding your 'true friend' a psychological issue? Absolutely! We normally think of 'friends' as people - and that can be something of a mistake (based on personal experience), as I explain.
Your true friend in trading is right there hidden in the backdrop behind the candles - and that's why you see no candles in the screencast.
So I'm saying, find the tools and the methods which will lead to finding the real true friend. Then let your true friend help you.

NZD/USD Trend Continuation: Channel Formation, Bull Flag on 4HNZD/USD has been bullish as of recently so we follow trend continuation.
We are currently in a corrective state, but approaching structure levels.
We see a trend channel that price is following, so if we continue this channel we should expect movement to the upside since we just finished a corrective wave.
We can also see a large bull flag formation. If this is valid, and we see a break of the upper resistance of the channel, we should also expect further bullish movement.
We see two bullish doji candles (circled in blue) which should be followed by a bullish move
RSI is not oversold or overbought = room for movement in either direction

GBPJPY late Long SetUpGBJPY put series of higher lows indicating potential bullish trend.
Weekly Time Frame confirms the possibility of decent uptrend.
Entry is based on 4-hour time frame, yes, little bit late.
Also second high is not higher than the previous one.
Risk/Reward ratio is quite decent although I do not expect to rally fully to the top.
Important is to keep in mind that the trade was entered late, it is almost third move high and highes did not rise as should.
However, I see a decent opportunity to try to ride the wave little bit longer before it potential defeat by bears.
The trade should be little bit more demanding in the aspect of checking the situation because above stated entry situation.
We shall see what would happens.

USD/JPY Trend Continuation Approach: Double Top or Breakout?Alternate Trade Approach to my recent Long Idea:
IF USD/JPY does not respect recent bounce off of smaller triangle pattern, (in black--might need to zoom out),
then it may correct even further and:
retest the support of the smaller black triangle
OR
find support at the lower level of the larger triangle (in orange--zoon out) , which also coincides with structure support.
I am still BULLISH on USD/JPY after this correction, or if we have a firm break of the 113.3 Level
Here is an alternative LONG approach to USD/JPY

USDCHF Trend Continuation: Recently Broke Support, Now RetestingUSD/CHF Recently broke its upward momentum and has begun a downtrend.
We are currently testing resistance.
If USD/CHF fails to break this resistance level , we can expect further downward movement.
Side Note: We see that the blue resistance has been broken, this may be an indication of bullish momentum, although I see it as a small structure break before a bounce downward off of the strong structure resistance .
-RSI was diverging before recent downtrend... Currently not in oversold state.

1 Hour Trend Continuation TradeThis recent pullback into structure has offered a high probability trend continuation trade on the cards. looking for a potential bounce from the currently tested support area and a push up to test the 0.73700 zone

Trend Following Opportunity To ShortAfter the series of lower highes and lower lowes as the sign of bear taking over potential to get to the short trade.
Entry from the retracement based on consecutive series of bearish candles.
Target based on last support.
Stop loss wider in order to provide the space in case of need.
Despite larger stop loss still decent risk/rewards opportunity.

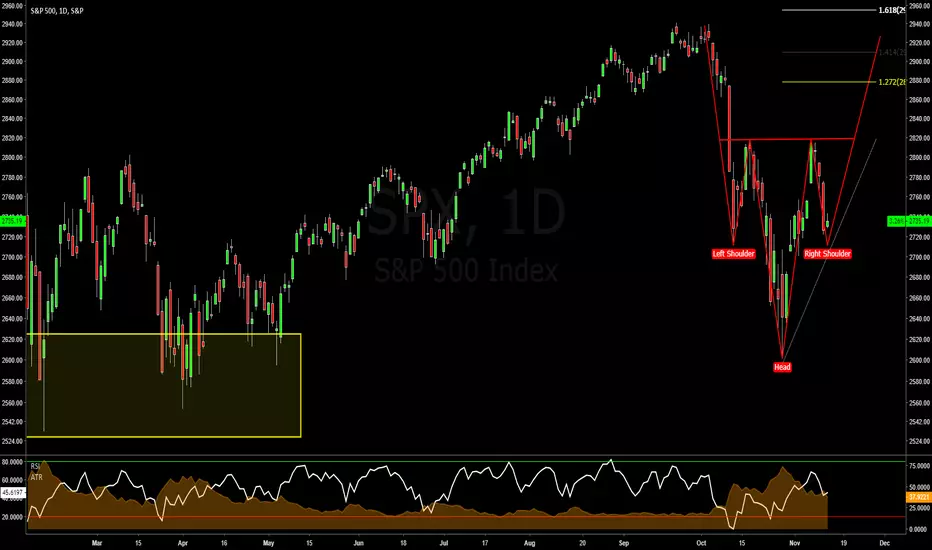
S&P - Head & Shoulder BottomAfter putting in a retracement to retest previous structure lows the S&P is now trading at the right should of what may turn out to be a head and shoulders bottom pattern.
The head and shoulders is a classic reversal pattern & IF completed I would predict that we're likely to retest the previous structure highs which line up at a one - to - one measured move & a fibonacci extension level.
Akil
EURGBP - ShortSelling EURGBP expecting a trend continuation.
As always : Opening 2 positions. TP1 is fairly quick and TP2 is open to let it run.

NZDJPY - Selling JPYOANDA:NZDJPY : Selling the JPY against the NZD. Trend continuation, TP1 at 1:1 at the top of the structure. Let the rest run.

stochastic rsi + 100 ema strategyi have tried this strategy and i find it profitable with this rules:
stochastic rsi:
K = 5
D = 10
rsi length = 14
stochastic length = 14
Ema: 100
Rules: if the prise moves above the ema, then you are looking for a long positon. when the stochastic rsi is moving above the 80, look for a pull back. when the pullback comes you want the rsi to go below the 20 zone withoute eny crosses on the way down from the 80 zone. When the rsi then makes a cross below the 20 open a buy position. the risk reward shoud be 1:1 on first target and 2:1 on second. set the previos structure high as first targets. Dont trade if the prise closes below the 100 ema before the cross, this would make it unvalid. One more is that the structure high before the pullback must be higher than the previos stricture high. The same rules apply when the prise moves below the ema, just opposite.
This is my first article and i hope you found it educatinal.

TREND CONTINUATIONWe a significant break of the bearish trendline, and subsequent high momentum bearish leg, we are interested to go long here, however we must wait for bulls to run out of gas and give us a better price in a form of a bullish flag or ideally a bullback to the previous market structure.. We will engage into this pair only if we have a confirmation.

USDJPY - BULLISH BREAKOUT TO POTENTIAL D COMPLETION This morning we were able to capture 1st targets on a USDJPY potential bullish breakout and I wanted to stop by for a second & talk about secondary opportunities to get involved as well.
Now before we get started please understand that it was a little difficult to fit the entirety of this trade idea on to the chart as multiple timeframe analysis was involved, but I'll try my best to explain what I'm looking at. However, for reference, you may want to check out a recent video I did titled " Using The ABCD Pattern" as it walks you through the initial process of why I was looking to get long.
Now that we've broken previous structure highs with a confirmed break & close above, we can make the prediction that price action is likely to continue higher. Where to? Well only the market knows that & seeing how today is election day, anything can happen. But based purely off of the technicals my prediction would be a move to retest the previous shoulder line of the head and shoulders top that we saw back in mid October. (See linked chart below)
If I weren't involved already, my way of looking to get involved would be waiting for the market to provide us with some relief in the form of a pullback & then look to catch the next extension higher.
Your Trading Coach - Akil

BEARISH TREND CONTINUATION TRADE/H&S REVERSAL SETUP ON GBPJPYGBPJPY is in a clear bearish trend, and price is just about to retest the neckline of broken head & shoulder pattern which aligned with 61.8 Fib, daily resistance zone, and mean value. Our goal is to find a short entry, with that in mind, we wait for a clear break of Counter Trend Line (CTL) for entry.
There is currently two CTL on the chart, the break of the short-term CTL that's close to price will be used for an aggressive entry while the CTL that's extended from current price action can be used for a conservative entry.
NOTE: A strong bullish close above the resistance zone and desecing trendline will invalidate this setup.
If you like this kind of content/trade idea, kindly leave comment and follow me.

ElanStrategy v2.0 (weighted MA's)A trend-following strategy with a twist.
I worked on the premise that Bitcoin price swings can not be predicted properly, since it's such a heavily manipulated market. Therefore, I chose to work with following the trend instead of predicting reversals.
It uses a weighted average of short, medium, and long range MA's.
This is the second version (see link below for v1.0), The main difference is that this new version uses a less binary position - it will change the position more gradually.
This one will automatically correct for bar duration, and works well from 1 to 4 hour charts. (1 hour chart seems to have data going back to only 2018/01/01 at the moment of writing, so I recommend using the 2H chart or higher)
