ILU @ 13 SEP 2021ILU
- Previous analysis was done on 9 Sep - Suggested entry around 9.90 levels
- Since then, the stock has rebounded off the short-term support and created a new all-time high today
- If you missed out the previously suggested entry, current price levels still present some buying opportunities
- R is less than 10%
- Strategy-to-buy (DYOR) – Suggest entry at current levels if believe the stock is capable of forming new all-time highs
Trendfollowing

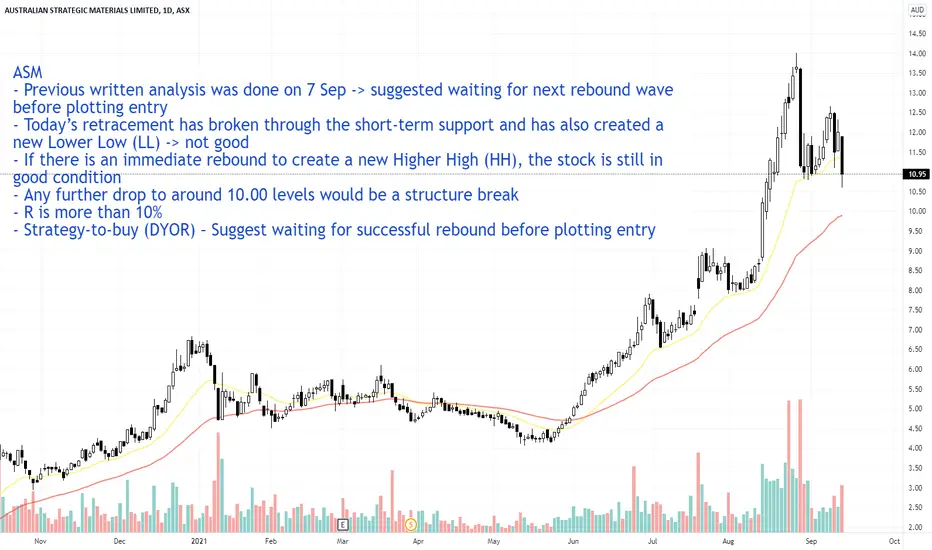
ASM @ 13 SEP 2021ASM
- Previous written analysis was done on 7 Sep -> suggested waiting for next rebound wave before plotting entry
- Today’s retracement has broken through the short-term support and has also created a new Lower Low (LL) -> not good
- If there is an immediate rebound to create a new Higher High (HH), the stock is still in good condition
- Any further drop to around 10.00 levels would be a structure break
- R is more than 10%
- Strategy-to-buy (DYOR) – Suggest waiting for successful rebound before plotting entry
360 @ 13 SEP 2021360
- Previous written analysis was done on 8 Sep -> suggested waiting for rebound wave before plotting entry
- Today’s price action is a nice pivot and a new Higher Low (HL) has formed
- A successful rebound look to be around 9.60 levels
- Potential psychological resistance at 10.00 levels
- R is less than 10%
- Strategy-to-buy (DYOR) – Suggest waiting for successful rebound before plotting entry if believe the stock can break psychological resistance

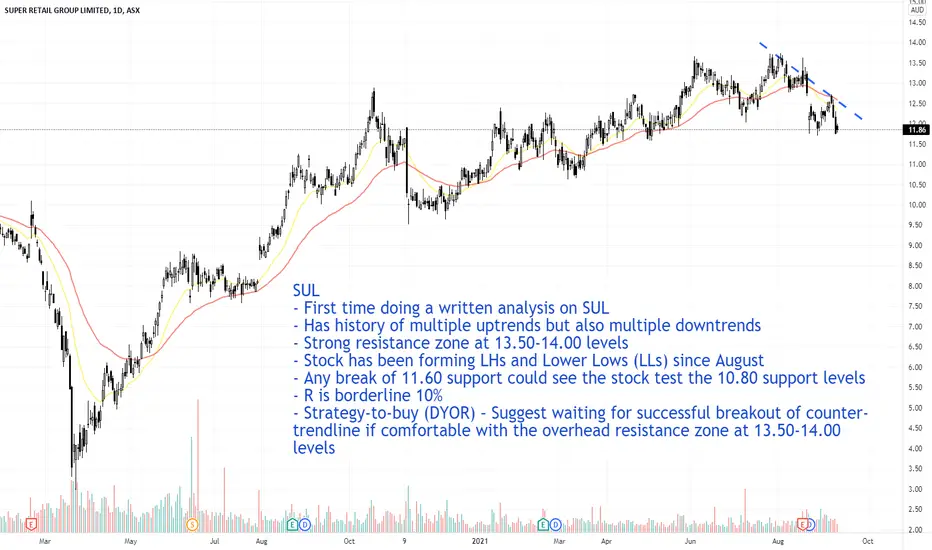
SUL @ 10 Sep 2021SUL
- First time doing a written analysis on SUL
- Has history of multiple uptrends but also multiple downtrends
- Strong resistance zone at 13.50-14.00 levels
- Stock has been forming LHs and Lower Lows (LLs) since August
- Any break of 11.60 support could see the stock test the 10.80 support levels
- R is borderline 10%
- Strategy-to-buy (DYOR) – Suggest waiting for successful breakout of counter-trendline if comfortable with the overhead resistance zone at 13.50-14.00 levels
LYC @ 10 SEP 2021LYC
- Previous analysis was done on 31 Aug - Suggested waiting for successful rebound to 7.50 levels
- Stock recently formed a mini retracement wave and today’s price action would be considered a successful rebound
- Technically, the stock hasn’t successfully rebounded after the mid-Aug retracement
- To manage risk, half position entries are recommended
- R is less than 10%
- Strategy-to-buy (DYOR) – Suggest half position entry at current levels if confident that stock can rebound to 7.50 levels

IGO @ 10 Sep 2021IGO
- First time doing a written analysis on IGO
- Has history of multiple uptrends but also multiple downtrends
- Historically, the stock has traded in a tight range that is bounded by strong resistances and supports
- Created new all-time high a month ago when it briefly tested the 10.00 psychological resistance
- Stock recently formed a Lower High (LH) and Higher Low (HL)
- A break of either the counter-trendline resistance or the trendline support might lead to a strong push in either direction
- R is less than 10%
- Strategy-to-buy (DYOR) – Suggest waiting for successful breakout of counter-trendline

Warning signs... ETH signalling more downside?The signs were starting to develop, but yesterday really brought the picture into clearer focus:
- ETH daily showing downside potential with RSI divergence to price
- MACD (longer MA settings) starting to cross down
My daily stop-and-reverse system has gotten me out of everything. So sitting on the side lines until things change:
P.S. This is marked as a short idea, but I never actually go short, just bearish for now. #LongOnly

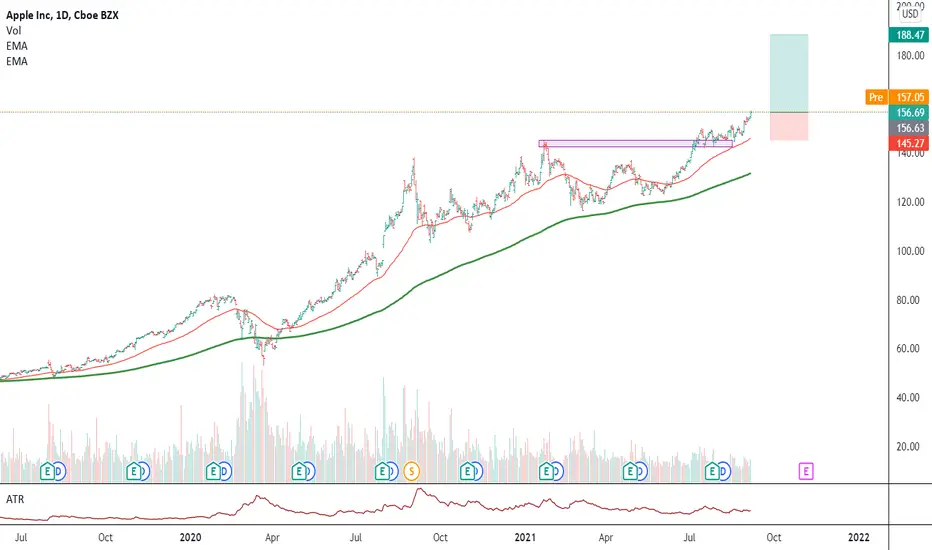
AAPL long ideaNASDAQ:AAPL yet another all time high.
I will nibble a bit here; I would like a 1:3 risk:reward trade therefore the target has no bearing on any area of value. Only the stop level is derived from a close below the 50EMA, which I'll use as a trailing stop loss for this trade.
Apple is Apple, there isn't much one can say from a fundamental analysis perspective. The brand keep the fans cuming, forgive me, I couldn't resist.
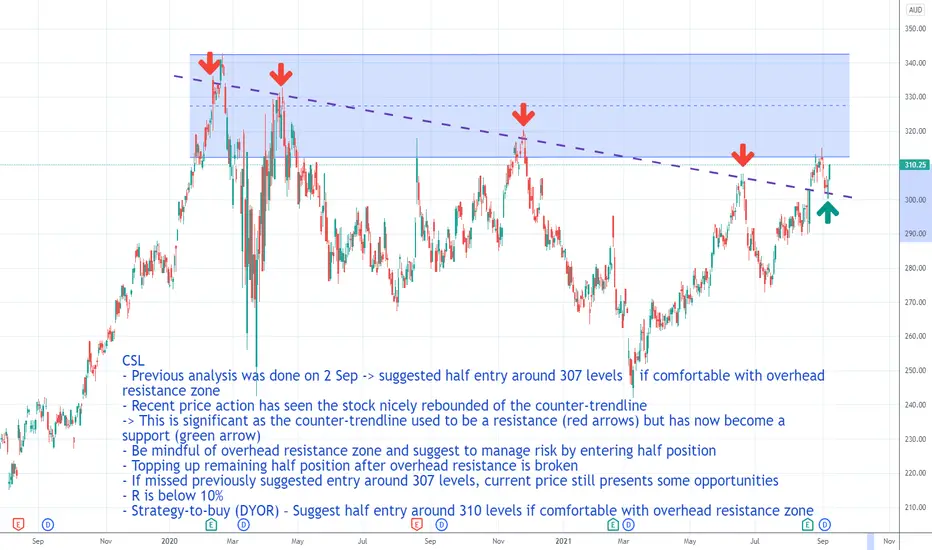
CSL @ 7 SEP 2021CSL
- Previous analysis was done on 2 Sep -> suggested half entry around 307 levels if comfortable with overhead resistance zone
- Recent price action has seen the stock nicely rebounded of the counter-trendline -> This is significant as the counter-trendline used to be a resistance (red arrows) but has now become a support (green arrow)
- Be mindful of overhead resistance zone and suggest to manage risk by entering half position
- Topping up remaining half position after overhead resistance is broken
- If missed previously suggested entry around 307 levels, current price still presents some opportunities
- R is below 10%
- Strategy-to-buy (DYOR) – Suggest half entry around 310 levels if comfortable with overhead resistance zone
Bitcoin Surges Up!Blink and you can end up missing some big moves in Bitcoin which is taking on a
life of its own. This instrument was showing signs of weakness in May this year
where it fell to below $30,000 and hit the weekly 50 simple moving average.
In July, the buyers came back into the market and have pushed price up 79%
to where it currently stands at over $50,000.
Although the last 2 months have been bullish, price is still over $13,000 away
from the all-time high at $64,895 so there is still a bit of fight for the bulls
to overcome.
This current decline followed by the bounce could easily turn into a long-term
period of consolidation that could last for months and even years. Right now
though, the momentum could take price to record highs.
With Bitcoin on the move, you will notice that other coins are starting to move
too and Ethereum is another strong cryptocurrency. Bitcoin is seen as the main
cryptocurrency and the index for this market that shows us how this market
is performing overall.
We now want to see price breakout and rally through the rest of the year.
See below for more information on our trading techniques.
As always, keep it simple, keep it Sublime.

More Record Highs For The S&P 500!The S&P 500 continues to climb up the slope formed from the 20 and 50 simple
moving averages. In the last post, price had broken above a previous high at
$4480, and has now moved up another 1.5%.
The trend in this Index is strong, and we can see a nice pattern of higher highs
and higher lows forming here.
It was only back in April when price was approaching the $4,000 round number,
and there was some uncertainty whether price would make it past.
5 months later and price has moved well beyond that level and looks set to
move towards $5,000.
The journey to $5,000 may be a bumpy one as we might see periods of
consolidation and other forms of turbulence along the way.
Price is halfway there and the market currently looks strong as a whole,
with stocks creating record highs in the strong sectors such as Health Care
and Real Estate.
We shall continue to take only the highest probability opportunities to
increase our edge over the market.
See below for more information on our trading techniques.
As always, keep it simple, keep it Sublime.

CAR @ 6 SEP 2021CAR
- Previous analysis was done on 1 Sep - Suggested waiting for a successful rebound and entry around 26 levels
- Today’s price action is good albeit slightly below the daily average volume
- Created new all-time high
- R is borderline 10%
- Strategy-to-buy (DYOR) – Suggest entry at current levels if believe the stock is capable of creating new highs

ARB @ 6 SEP 2021ARB
- Previous analysis was done on 2 Sep - Suggested waiting for a successful rebound to around 54 levels
- After slowly retracing to the short-term support, today’s price action is the first sign of a technical rebound
- From a technical perspective, a successful rebound would be around 54 levels
- R is less than 10%
- Strategy-to-buy (DYOR) – Suggest waiting for successful rebound to around 54 levels if believe the stock is capable of creating new all-time highs

WES @ 1 SEP 2021WES
- Previous analysis was done on 30 Aug -> suggested to wait for price recovery above the short-term resistance before any entry
- I also mentioned that any further drop in price will constitute a Structure Break
- Stock is currently trading at the 58 support levels
- Traders should execute their Stops once certain pre-determined prices are triggered
- Strategy-to-buy (DYOR) – Suggest waiting for a series of Higher Highs (HHs) and Higher Lows (HLs) to form first

TLS @ 1 SEP 2021TLS
- First time doing a written analysis on TLS
- Stock was in a long downtrend since 2015 and this introduces a lot of overhead resistances
- Stock looks to be challenging the 4.00 resistance soon
- R is less than 10%
- Strategy-to-buy (DYOR) – Suggest waiting for successful breakout of overhead resistances before entry and only if comfortable with the multiple overhead resistances

QPM @ 1 SEP 2021QPM
- First time doing a written analysis on QPM
- Stock started to show uptrend in 2021
- Currently trading near a resistance that was formed in 2012 -> it would be more difficult to sustain the overall price trajectory
- I usually classify stocks less than 50 cents as a penny stock as a relatively healthy pullback to the short-term support could see price swings of 10-20% -> too volatile for me
- A stock that attracts short-term traders but it’s advisable to stay away if you prefer peace of mind
- R is more than 10%
- Strategy-to-buy (DYOR) – Suggest waiting for overhead resistance to be broken first. Only enter if comfortable with the price swings

JHX @ 1 SEP 2021JHX
- First time doing a written analysis on JHX
- Nice uptrend over the last few months
- Stock is trading near all-time high regions
- A pullback to the short-term support would be better for the overall health of the trend
- A successful rebound look to be around 54 levels
- R is less than 10%
- Strategy-to-buy (DYOR) – Suggest waiting near 54 levels if believe the stock is capable of creating new all-time highs

CAR @ 1 SEP 2021CAR
- First time doing a written analysis on CAR
- Has a history of good uptrends over the years
- Recent price action since mid-Aug has seen the stock gone up quite far from the short-term support
- I was hoping to see a stronger pullback to the short-term support for a better setup for entry
- This week’s price action shows signs of a reversal and the stock looks to be in a rebound
- A successful rebound would be near 26 levels -> due to sharp retracement at the beginning of the retracement wave
- R is less than 10%
- Strategy-to-buy (DYOR) – Suggest waiting for a successful rebound before entry near 26 levels

MPL @ 31 Aug 2021MPL
- First time doing a written analysis on MPL
- Over the last 6 years, the stock has been trading within 2.40-3.60 levels
- Stock is currently trading near all-time high regions -> A successful breakout has a potential to see the stock fly
- Price consolidation over the last 2 weeks to test the short-term support looks like a breather before testing the last overhead resistance
- R is less than 10%
- Strategy-to-buy (DYOR) – Suggest waiting for a successful breakout

LYC @ 31 Aug 2021LYC
- First time doing a written analysis on LYC
- Has some history of good uptrends that lasts for months
- Also has history of downtrends that lasts for years -> represents overhead resistances for the stock
- Stock price may not go up as fast as other stocks without these overhead resistances
- Stock is currently trading between the short- and mid-term averages -> any break of support or resistance would require above average volume
- A rebound to around 7.50 levels would be considered a successful rebound
- R is more than 10%
- Strategy-to-buy (DYOR) – Suggest waiting for successful rebound to 7.50 levels

INR @ 31 Aug 2021INR
- First time doing a written analysis on INR
- History of good uptrends that tend to last 2-3 months
- Created new all-time high today
- Price is far from the short-term support –> best to wait for retracement and successful rebound
- R is more than 10%
- Strategy-to-buy (DYOR) – Suggest to wait for retracement and successful rebound before entering

HLS @ 31 Aug 2021HLS
- Previous analysis was done on 26 Aug -> suggested to wait for successful breakout of strong resistance
- Since then, the stock has retraced all the way down to test the mid-term support
- Today’s price action is first sign of a potential rebound -> but more positive indicators are required
- Some traders may try to use the Support Strategy for entry, but it sometimes pays to be cautious
- strong resistance zone (formed since 2013) at 5.15-5.35 levels
- R is less than 10%
- Strategy-to-buy (DYOR) – Suggest waiting for successful breakout of strong resistance zone

XRF @ 30 August 2021XRF
- First time doing a written analysis on XRF
- Uptrend started since mid-April 2021 -> doesn’t have a long history of good uptrend
- Has a series of HHs and HLs but could be more significant
- Trading at all-time high regions
- Stock is currently a bit far from the short-term support
- R is less than 10%
- Strategy-to-buy (DYOR) – Entry at current price if believe the stock can continue to form new highs
