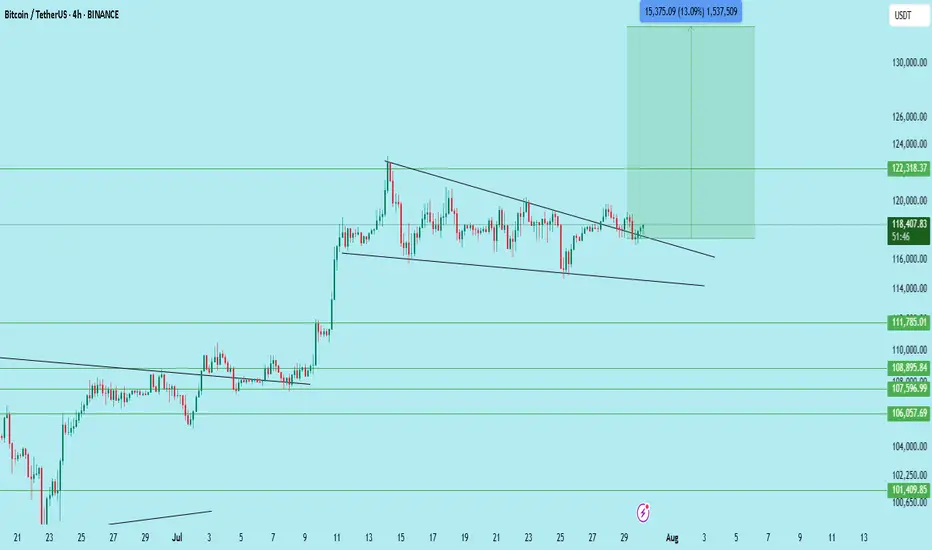
$BTC/USDT – Bull Flag Breakout on 4H | Targeting $133,700Bitcoin has just broken out of a well-defined bull flag structure on the 4H chart, signaling a potential continuation of the previous uptrend.
This breakout comes after a strong impulsive move upward, followed by a textbook flag consolidation with lower highs and lows forming a descending channel. The breakout above the flag resistance suggests a bullish continuation pattern is in play.
Technical Breakdown:
Pattern: Bull Flag (Continuation)
Flagpole base: ~106,700
Breakout zone: ~117,600
Retest Support: 116,000
Immediate Resistance: 122,300
Expected Target: 133,700 (based on flagpole projection)
Invalidation: Breakdown below 115,500
Expected Move:
Measured Move Target: ~13% upside from breakout
Confluence: Target aligns with past supply zone near 133K–135K
Price has also reclaimed the 50 EMA on the 4H chart, and the volume on the breakout shows bullish interest. Watching closely for a clean retest of the breakout zone for confirmation.
Conclusion:
BTC is showing bullish continuation after breaking out of a flag. A successful retest of 117.6K–116K range could offer further upside. Traders should manage risk accordingly.
DYOR | Not Financial Advice
Trendingideas
BITCOIN's Situation (12h) !!!So if you pay attention to the TON chart you can see that the price has formed a Ascending wedge which means it is expected to price move as equal as the measured price movement.( AB=CD )
NOTE: wait for break of the WEDGE .
Best regards CobraVanguard.💚

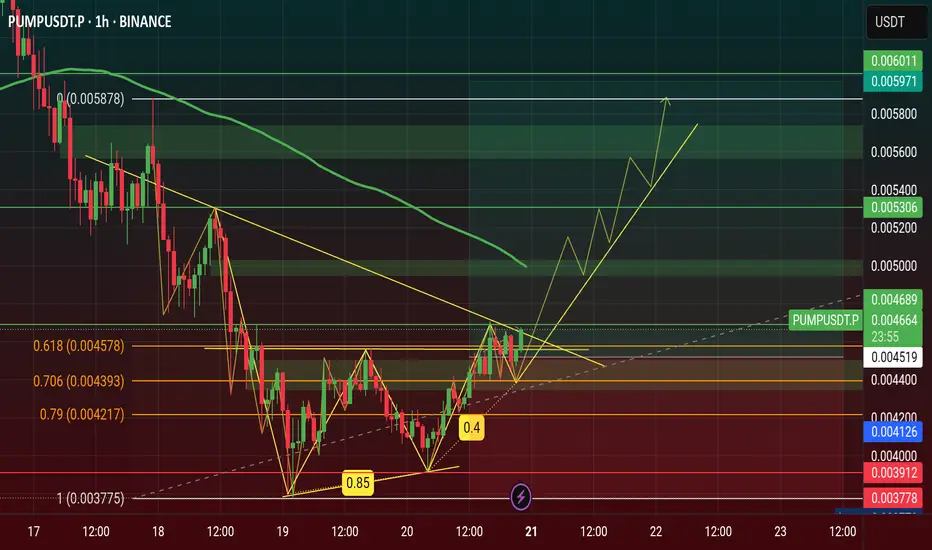
$PUMP Price Will Hit $0.006 this July 2025 see on Chart...🚀 NYSE:PUMP Price Will Hit $0.006 this July 2025, NYSE:PUMP is Showing a Double Bottom Pattern Looking on Chart now.
Double Bottom Pattern is a Reversal Pattern and It's will Manipulation Price of Pump. I'm Find a Three White Shoulders Candle in bottom price area on 4h Chart & It is a Bullish Candle. Now Price Retest and If it's Breakout it will be happened this month.
#Write2Earn #TrendingPredictions #AltcoinSeasonLoading #pump #SUBROOFFICIAL
Disclaimer: This article is for informational purposes only and does not constitute financial advice. Always conduct your own research before making any investment decisions. Digital asset prices are subject to high market risk and price volatility. The value of your investment may go down or up, and you may not get back the amount invested. You are solely responsible for your investment decisions and Binance is not available for any losses you may incur. Past performance is not a reliable predictor of future performance.
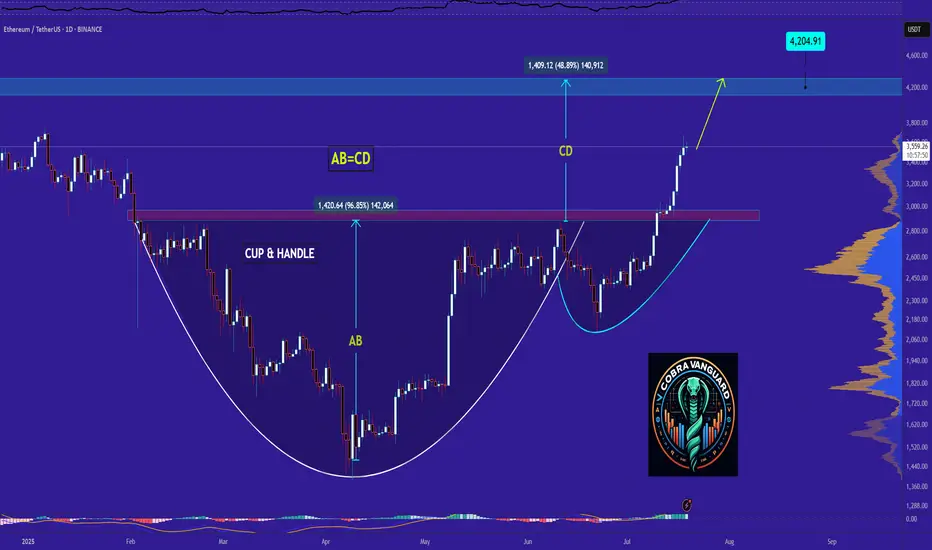
Ethereum - Time to buy again!Exactly, based on previous analyses, the price is rapidly approaching $4,000. But we need to be cautious because whenever it hits round numbers, something big usually happens!!!
previous analysis
Best regards CobraVanguard.💚
Bitcoin is bullish now & many Traders don't see it !!!I might be wrong and this might never happen, but it might come true From a technical perspective!!!
Remmember
Stay Awesome , CobraVanguard.
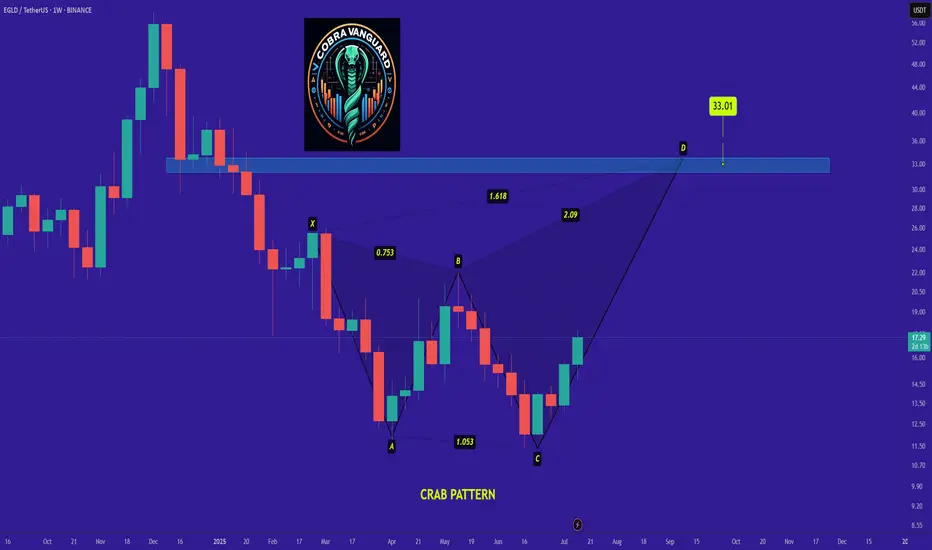
EGLD is bullish now & many Traders don't see it !!!Be careful with EGLD !!!
we can hope that the price will act like a Crab pattern and the price will grow well.
I expect that the price will grow very quickly...
Stay Awesome , CobraVanguard.
Be careful with RIPPLE !!!The pennant pattern has been broken, and the price follows an AB=CD pattern, targeting a rise above the 5 dollar.
Best regards CobraVanguard.💚

Why BNB Remains Bullish and Its Next Potential Move !Currently,is forming an ascending triangle, indicating a potential price increase. It is anticipated that the price could rise, aligning with the projected price movement (AB=CD).
However, it is crucial to wait for the triangle to break before taking any action.
Stay Awesome , CobraVanguard.

SOLANA's Situation, A Comprehensive Analysis (1h) !!!The price on the 1-hour timeframe is within an ascending triangle, which can be promising. If the price breaks this pattern with bullish candles, it could easily rise by the distance of AB=CD .
Best regards CobraVanguard.💚

bitcoin - Time to buy again!As I mentioned, the price has started the third bullish wave and has shown good growth so far, with the bullish wave still ongoing. In my opinion, the price could rise to $127k, after which it may correct to form the fourth corrective wave.
previous analysis

DOGE's Situation, A Comprehensive Analysis (1h) !!!The price on the 1-hour timeframe is within an ascending triangle, which can be promising. If the price breaks this pattern with bullish candles, it could easily rise by the distance of AB=CD .
Best regards CobraVanguard.💚

$BNB Chart Showing Bullish Flag Pattern and Price Will Hit +$750CRYPTOCAP:BNB Previously Chart showing Bullish Inverse Head and Shoulder Pattern and Gain Profit of Range. It's a Reversal Pattern .
Now Chart Showing a Bullish Flag Pattern and it's Continuation Pattern. Time to Bullish for BNB Coin for FOMC 10th July Thursday 2025.
The upsloping 20-day EMA and the RSI just above the midpoint indicate a slight edge to the bulls. If the $665 resistance falls, the BNBUSD pair could rise to $675 and then to $698.
Sellers are likely to pose a solid challenge at $698 because a break above it could propel the pair to $732. I'm guess BNB Price Breakout of ATH and $888 Mystery will Happen.
This optimistic view will be negated in the near term if the price turns down and breaks below the moving averages. The pair may then drop to $636.
NEWSBTC: BNB Price Gears Up for Upside Break — Will Bulls Deliver?
BNB price is gaining pace above the $650 support zone. The price is now showing positive signs and might aim for more gains in the near term.
BNB price is attempting to recover from the $620 support zone.
The price is now trading above $655 and the 100-hourly simple moving average.
There is a key contracting triangle forming with resistance at $662 on the hourly chart of the BNB/USD pair (data source from Binance).
The pair must stay above the $655 level to start another increase in the near term.
BNB Price Eyes More Gains
After forming a base above the $620 level, BNB price started a fresh increase. There was a move above the $645 and $650 resistance levels, like Ethereum and Bitcoin.
The price even surged above the $660 level. A high was formed at $666 before there was a downside correction. The price dipped below the 50% Fib retracement level of the upward move from the $650 swing low to the $666 swing high.
The price is now trading above $655 and the 100-hourly simple moving average. On the upside, the price could face resistance near the $662 level. There is also a key contracting triangle forming with resistance at $662 on the hourly chart of the BNB/USD pair.
The next resistance sits near the $665 level. A clear move above the $665 zone could send the price higher. In the stated case, BNB price could test $672. A close above the $672 resistance might set the pace for a larger move toward the $680 resistance. Any more gains might call for a test of the $700 level in the near term.
Another Decline? If BNB fails to clear the $662 resistance, it could start another decline.
Initial support on the downside is near the $655 level and the 61.8% Fib retracement level of the upward move from the $650 swing low to the $666 swing high. The next major support is near the $650 level.
The main support sits at $644. If there is a downside break below the $644 support, the price could drop toward the $632 support. Any more losses could initiate a larger decline toward the $620 level.
Technical Indicators
Hourly MACD – The MACD for BNB/USD is gaining pace in the bullish zone.
Hourly RSI (Relative Strength Index) – The RSI for BNB/USD is currently above the 50 level.
Major Support Levels – $655 and $650.
Major Resistance Levels – $662 and $665.
#Write2Earn #BinanceSquareFamily #BinanceTurns8 #BNB #SUBROOFFICIAL
Disclaimer: This article is for informational purposes only and does not constitute financial advice. Always conduct your own research before making any investment decisions. Digital asset prices are subject to high market risk and price volatility. The value of your investment may go down or up, and you may not get back the amount invested. You are solely responsible for your investment decisions and Binance is not available for any losses you may incur. Past performance is not a reliable predictor of future performance. You should only invest in products you are familiar with and where you understand the risks. You should carefully consider your investment experience, financial situation, investment objectives and risk tolerance and consult an independent financial adviser prior to making any investment.

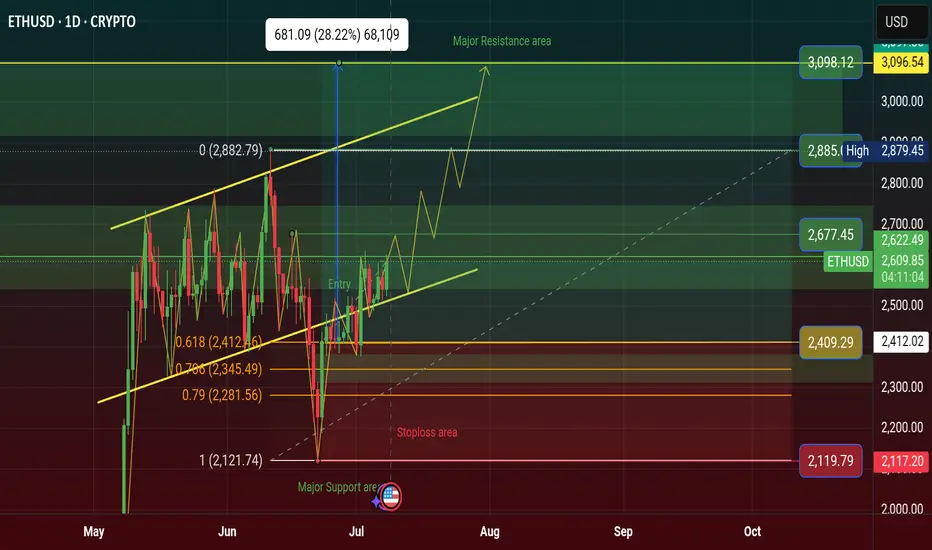
$ETH Price Will Rising $3098 in Q3, Bullish Flag Inverse AngleCRYPTOCAP:ETH price will Rising $3098 in Q3 in 2025, Price Showing a Bullish Flag Inverse Angle. it's a Reversal Pattern and Manipulation Price. See more on Chart.
Crypto News: An Ethereum address holding 900 ETH started moving coins Monday after spending nearly 10 years dormant.
The holder received these genesis coins in 2015 when ETH traded below 50 cents.
These pre-mined tokens were distributed to early Ethereum contributors before mining began.
Their current value reaches 2.2 million with ETH trading around 2,529 per coin.
This represents potential gains exceeding 5,000% from the original sub-dollar entry price.
The move follows similar whale activity, including a 27.6 million Ethereum sale in April.
Last week saw a Bitcoin whale move 8 billion after 14 years of hodling.
ETH remains 48% below its 2021 all-time high of 4,878 despite recent stability.
The holder technically isn't a whale, which requires a minimum of 10,000 ETH at current prices.
#Write2Earn #BinanceSquareFamily #ETH #SUBROOFFICIAL
Disclaimer: This article is for informational purposes only and does not constitute financial advice. Always conduct your own research before making any investment decisions. Digital asset prices are subject to high market risk and price volatility. The value of your investment may go down or up, and you may not get back the amount invested.
$SOL Price Will Hit $228 Q3, Inverse Head and Shoulder Pattern✨ CRYPTOCAP:SOL Price Will Hit $228 in Q3 of 2025 | Solana Chart Showing Inverse Head and Shoulder Pattern. It's a Bullish Reversal Pattern.
‣ Solana price is hovering below key resistance; a breakout above $159 and it's going to $228.
ETF Buzz Grows, but Price Action Still Caught in Limbo Here is why this could be the catalyst that sends price to all time highs Do THIS before that happens.
‣ Solana ETF Buzz Grows, but Price Action Still Caught in Limbo
🔸BlockNews The SEC has asked SOL ETF applicants to revise and refile submissions by end of July, fueling speculation of an ETF approval before October. Solana’s daily active addresses just hit a record 15.39 million, pointing to rising demand and user engagement on the network.
#Write2Earn #NFPWatch #BinanceSquareFamily #TrumpTariffs #SUBROOFFICIAL
Disclaimer: This article is for informational purposes only and does not constitute financial advice. Always conduct your own research before making any investment decisions. Digital asset prices are subject to high market risk and price volatility.

$LOT Price Showing Symmetrical Triangle Pattern & Breakout aboveASX:LOT is a League of Traders Trading Competition Platform. LOT is an Native token of this platform.
Every Trading Player Have LOT point and they convert to LOT token and get on there wallet. Who Join LOT Trading League for LOT point? The main competition is top level and get free price.
💡 TOKEN OVERVIEW ( ASX:LOT )
Market capitalization: 3.89 M USD
Fully diluted market cap : 25.90 M USD
Trading volume 24h: 2.89 M USD
All time high: 0.044869 USD
Circulating supply: 150.00 M
Max supply: 1.00 B
Total supply: 1.00 B
A new Native token Release on Binance Alpha and when it's release on Binance Coin than we will see more pumping this Native Token Price.
ASX:LOT price now at $0.026186 and this year 2025 I'm Prediction the price will be happened $0.45-$0.75 hit. If Biggest Tournament will start this year on this Platform. Than Possible to worldwide Tournament make more Pumping price. Because of the Big investor will become investment on this LOT native Token.
We have to decisions long-term investment this coin. The main thing is that some Coin will be scammed. But League of Traders Platform is the Legit of Cross Chain Trading Competition.
The Crypto Scammer will not Permission listed there token on the Top Exchange of Binance Market. #SUBROOFFICIAL
Disclaimer: This article is for informational purposes only and does not constitute financial advice. Always conduct your own research before making any investment decisions. Digital asset prices are subject to high market risk and price volatility. The value of your investment may go down or up, and you may not get back the amount invested. You are solely responsible for your investment decisions and Binance is not available for any losses you may incur. Past performance is not a reliable predictor of future performance. You should only invest in products you are familiar with and where you understand the risks. You should carefully consider your investment experience, financial situation, investment objectives and risk tolerance and consult an independent financial adviser prior to making any investment.

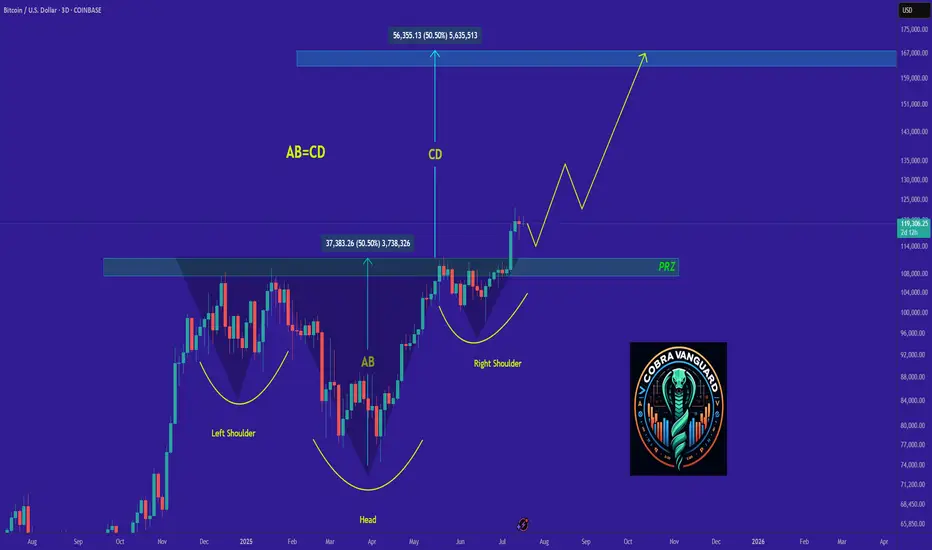
BTC's Situation, A Comprehensive Analysis !!!The situation has become quite strange. Bitcoin is forming deceptive patterns, and altcoins continue their downward trend. Currently, Bitcoin is positioned within two triangles—one symmetrical and the other descending. Now that Bitcoin has reached the top of the triangle and appears ready to break upward, it might actually be hiding yet another trap within the price action.
This market has shown disregard for technical patterns, and every time the price approaches historically significant levels, it reveals its true intentions and disappoints us. This cycle tends to repeat.
In my opinion, we’re likely to see one more drop in Bitcoin’s price. After that, instead of continuing the expected downtrend from the pattern, the price could break the descending formation and experience a strong upward move.
Stay Awesome , CobraVanguard.

"ADA - Time to buy again!"If the price can break through this Wedge's resistance, I expect it to reach $0.80 in a short time.
Stay Awesome , CobraVanguard.

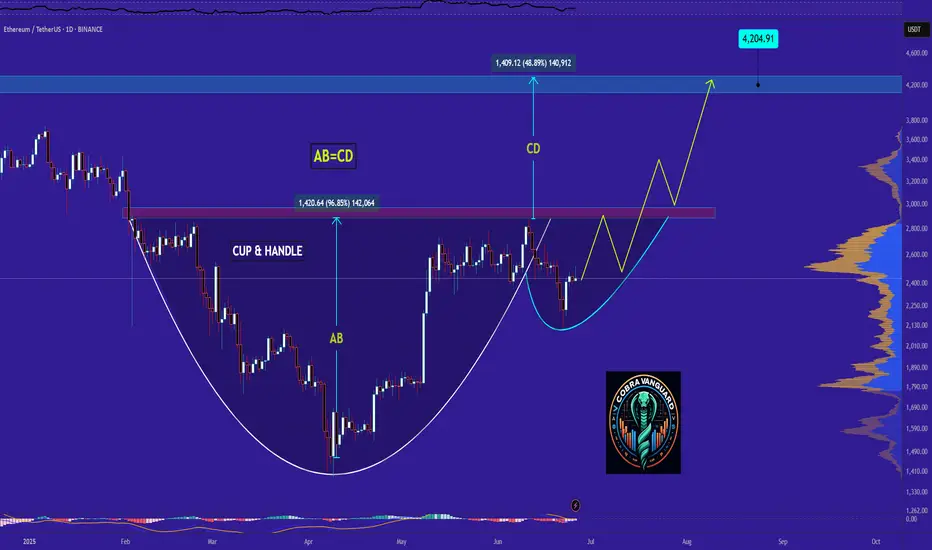
ETH It will grow soon...It can be said that the price has formed a cup and handle pattern, which it is completing soon. If the price follows this pattern, it can be expected that Ethereum will reach its peak again.
Best regards CobraVanguard.💚
DOGE Ready for PUMP or what ?What I see now is that the price could correct to the PRZ and then pump again, and currently, there is no specific bullish pattern in the chart. which could cause the price to drop below 17 cents.
Best regards CobraVanguard.💚

ETH's situation+ Target PredictionCurrently, ETH is forming an ascending triangle and cup and handle, indicating a potential price increase. It is anticipated that the price could rise, aligning with the projected price movement (AB=CD).
Continued strength could lead to upward movement toward targets at $2700, $2900, and $3.100
However, it is crucial to wait for the triangle to break before taking any action.
Give me some energy !!
✨We spend hours finding potential opportunities and writing useful ideas, we would be happy if you support us.
Best regards CobraVanguard.💚
_ _ _ _ __ _ _ _ _ _ _ _ _ _ _ _ _ _ _ _ _ _ _ _ _ _ _ _ _ _ _ _
✅Thank you, and for more ideas, hit ❤️Like❤️ and 🌟Follow🌟!
⚠️Things can change...
The markets are always changing and even with all these signals, the market changes tend to be strong and fast!!

XRP Ready for PUMP or what ?Ripple has successfully broken out of the falling wedge pattern and retested the breakout zone,the price is holding firmly above previous resistance, which now acts as strong support.
Continued strength could lead to upward movement toward targets at $2.65, $2.95, and $3.35
Stay Awesome , CobraVanguard

"BTC - Time to buy again!" (Update)As mentioned in the previous analysis, the price reached the top of the wedge and broke out with a price increase. Now that Bitcoin's price is above the wedge, it can be said that with a slight price correction, it could follow the pattern and make a measured move where AB = CD.
PREVIOUS ANALYSIS
Give me some energy !!
✨We spend hours finding potential opportunities and writing useful ideas, we would be happy if you support us.
Best regards CobraVanguard.💚
_ _ _ _ __ _ _ _ _ _ _ _ _ _ _ _ _ _ _ _ _ _ _ _ _ _ _ _ _ _ _ _
✅Thank you, and for more ideas, hit ❤️Like❤️ and 🌟Follow🌟!
⚠️Things can change...
The markets are always changing and even with all these signals, the market changes tend to be strong and fast!!

Maybe your biggest risk is your biggest chance !!!Bitcoin will reach $130k with a slight price correction.
my previous analysis in last year !!
Give me some energy !!
✨We spend hours finding potential opportunities and writing useful ideas, we would be happy if you support us.
Best regards CobraVanguard.💚
_ _ _ _ __ _ _ _ _ _ _ _ _ _ _ _ _ _ _ _ _ _ _ _ _ _ _ _ _ _ _ _
✅Thank you, and for more ideas, hit ❤️Like❤️ and 🌟Follow🌟!
⚠️Things can change...
The markets are always changing and even with all these signals, the market changes tend to be strong and fast!!
