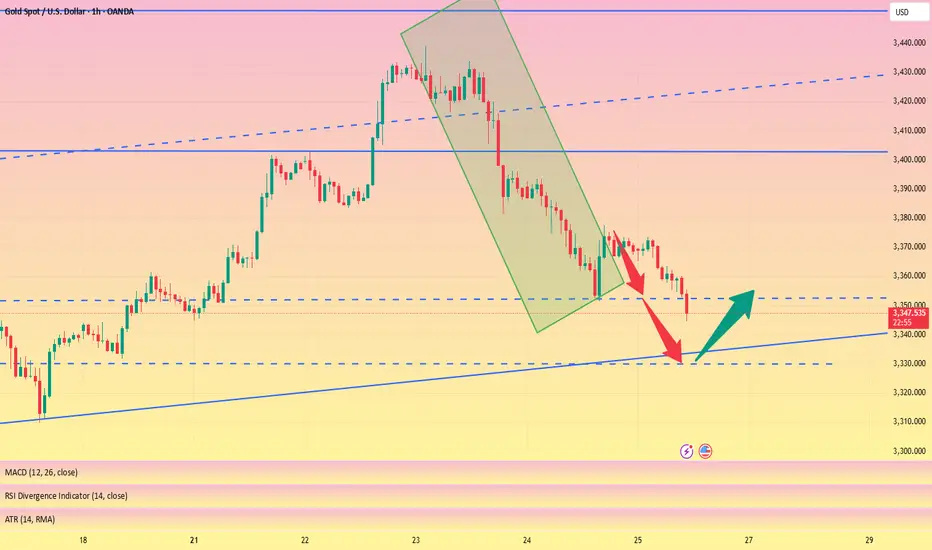
GOLD → Countertrend correction, retest of 3345 before growthFX:XAUUSD , undergoing a deep correction after a false breakout of local resistance at 3433, has reached the support of the upward trend. Will the bulls be able to maintain the trend?
Gold held below $3,400 on Friday, rebounding from $3,350, and is poised to end the week higher. Investors are watching the conflict between Thailand and Cambodia, which is boosting demand for safe-haven assets, and are also awaiting decisions from the Fed and the Bank of Japan next week. The markets received additional support from US trade deals with Asian countries and progress in negotiations with the EU, easing fears of a tariff war.
As part of the correction, gold is testing trend support and the 3345-3337 zone of interest. A false breakdown, lack of downward momentum, and bulls holding prices above 3345 could trigger growth and a continuation of the main upward trend.
Resistance levels: 3375, 3383
Support levels: 3345, 3337, 3330
Technically, the support level of 3345 plays a fairly important role in the market. If, during the correction, the bulls manage to hold their ground above this zone, the prospects for recovery will be high, especially against the backdrop of geopolitical problems.
Best regards, R. Linda!
Trend Lines

NASDAQ Potential UpsidesHey Traders, in today's trading session we are monitoring NAS100 for a buying opportunity around 23,140 zone, NASDAQ is trading in an uptrend and currently is in a correction phase in which it is approaching the trend 23,140 support and resistance area.
Trade safe, Joe.

GBPUSD → Retest of previously broken resistance...FX:GBPUSD has entered a correction phase after breaking through the local downtrend. If the price remains in the 1.3450–1.346 zone, this will confirm the formation of a new trading range...
The market is entering a correction phase due to the dollar. A countertrend retest of the support zone is forming. Earlier, the currency pair broke the local trend and is entering a flat phase. The retest of support may end with a recovery. If, within the local movement and after a false breakout of the 1.345 - 1.3467 zone, the bulls keep the price above the buying zone, then in the short and medium term, we can expect growth to continue.
Support levels: 1.3467, 1.345
Resistance levels: 1.35, 1.3584
A false breakdown of support at 1.3467 will confirm a change in the local trend (correction). The market may return to the recovery phase of the global trend.
Best regards, R. Linda!

HelenP. I Euro can reach resistance zone and then dropHi folks today I'm prepared for you Euro analytics. If we look at the chart, we can observe a mature uptrend that has been supported by a major ascending trend line for an extended period. However, the momentum of this trend appears to be waning, as evidenced by the price's recent failure to establish new highs. The asset is currently trading below the critical resistance zone of 1.1770 - 1.1800, an area that has proven to be a significant barrier for buyers. My analysis for a short position is based on the condition of a final retest of this resistance zone. I believe the price will make another attempt to rally into this area, and a forceful rejection from this zone would serve as the confirmation that sellers are taking definitive control of the market. Such a rejection would likely initiate a strong downward impulse with sufficient momentum to break the long-standing ascending trend line, a pivotal event that would shift the market structure. Therefore, the primary goal for this bearish scenario is set at the 1.1600 level, a logical target for the price to reach after such a significant structural break. If you like my analytics you may support me with your like/comment ❤️
Disclaimer: As part of ThinkMarkets’ Influencer Program, I am sponsored to share and publish their charts in my analysis.

NZDUSD Potential UpsidesHey Traders, in today's trading session we are monitoring NZDUSD for a buying opportunity around 0.59800 zone, NZDUSD is trading in an uptrend and currently is in a correction phase in which it is approaching the trend at 0.59800 support and resistance area.
Trade safe, Joe.

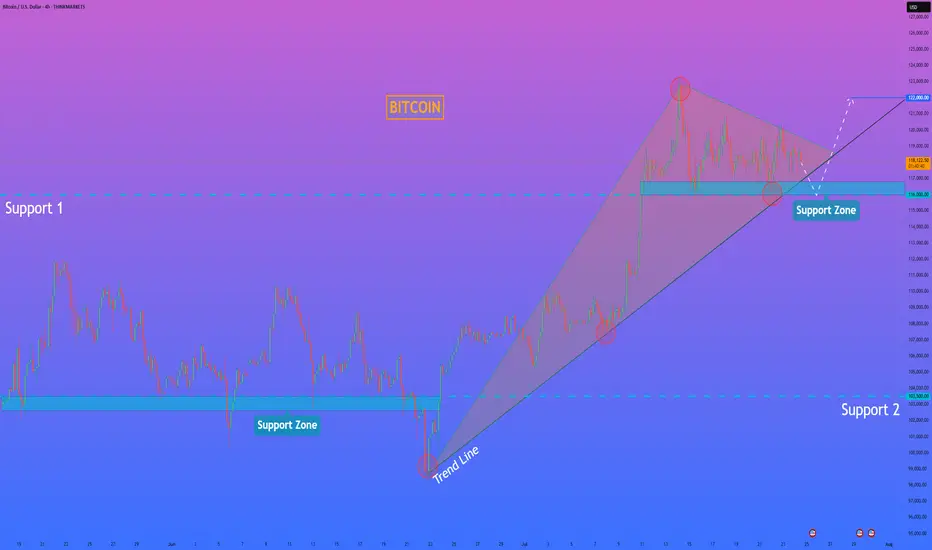
BITCOIN → Correction within a downward channel. 112K or 125K?BINANCE:BTCUSDT is consolidating. However, a local downward trading range is forming relative to the current setup. What is the probability of a correction continuing to 112K or growth to 125K?
Daily structure: a local correctional channel within a global bullish trend. We have cascading resistance at 119.2, 119.6, 120, and 120.8. It will be quite difficult to break through this zone on the first attempt, but MM can use it to form traps and collect liquidity.
At the bottom, everything is simpler — a breakdown of the local bullish structure, the formation of an intermediate minimum, below which there is a void down to 112K.
Yesterday, relative to 115-116K, mm staged a massacre (trap) on both sides of the market.
Liquidity collection, return to the range, and growth. The reaction to the false breakdown of support is quite strong. Since the opening of the session, Bitcoin has been heading towards resistance, but there may not be enough potential to break through the upper resistance conglomerate, so I expect to see a pullback or decline to 116-115-114.
Resistance levels: 119.2, 120.1, 120.85
Support levels: 116.37, 115.67, 112
Technically and fundamentally, I do not see any drivers that could support the market (I am talking about Bitcoin, since the driver for altcoins is the decline in Bitcoin's dominance). It is possible that this may appear later. In the current situation, I am considering a false breakout and correction, as the market has not yet finished consolidating or correcting, and the current downward trading range may be extended.
PS: As the price moves towards resistance, it is necessary to monitor the reaction. The market itself will show what it is preparing for...
Best regards, R. Linda!

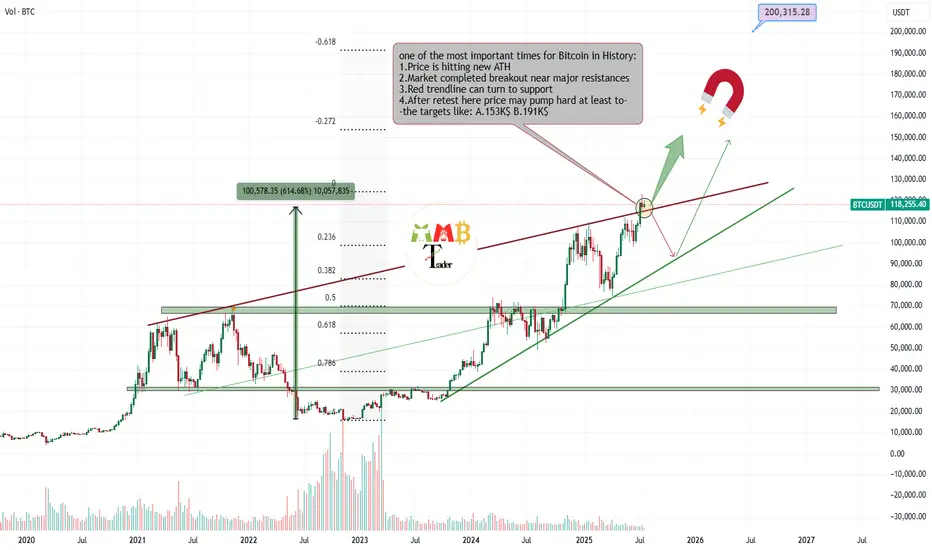
Bitcoin is retesting Critical zone for targeting almost 200K$Most traders around world now don't know what to do with their own trades or spot holdings, because some are in profit and how doubt of more pump and are still holding and some others miss this massive pump and think it can rest and fall now and it is not a good time to enter long.
And many other questions and thoughts At this time is simply check the chart and do these simple steps which are some mentioned and some not due to huge content.
Delete all of my previous drawings and start new Charting the price and see new trendlines or supports and resistances formed.
Then technically check the volume and breakouts and ... once again and here for Bitcoin i still find out chart looks extremely bullish to me and at this orange zone which is price is getting a little slow some important things may happen.
30% is expecting price fall below red trendline again and see short-term fall.
70% is expecting price complete retest of breakout here or pump more ASAP and then hitting targes like 150K$ and more for $BTCUSDT.
DISCLAIMER: ((trade based on your own decision))
<<press like👍 if you enjoy💚
USDJPY Breakout and Potential RetraceHey Traders, in today's trading session we are monitoring USDJPY for a buying opportunity around 146.300 zone, USDJPY was trading in a downtrend and successfully managed to break it out. Currently is in a correction phase in which it is approaching the retrace area at 146.300 support and resistance area.
Trade safe, Joe.

Vetusdt buy opportunityVetusdt completed wave 2 correction and price preparing for the big wave 3 move with the potential leading structure, the plan is to accumulate fromt the provided zone and hold for the setup targets.

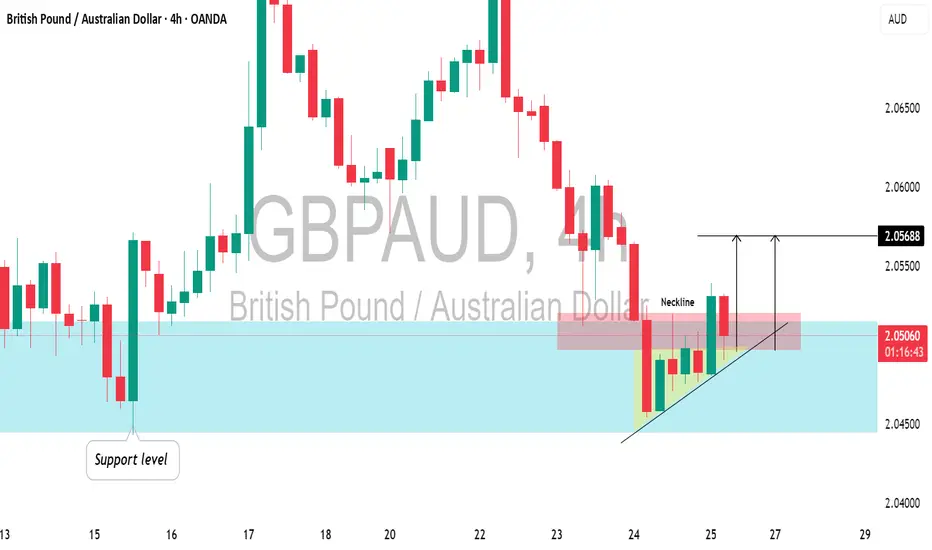
GBPAUD: Another Pullback Trade for TodayGBPAUD formed an ascending triangle pattern at a significant daily/intraday horizontal support.
And breaking its neckline indicates buyer strength.
I anticipate the pair could rise to the 2.0568 level.
Two Trades to go Bullish on TSLAHello, I’m The Cafe Trader.
We’ve been tracking the MAG 7, and Tesla is the next focus for our short-term options or swing trade strategy.
I’m looking at two scenarios that are likely to play out with TSLA over the next few weeks.
For fundamental and long-term analysis, check my other article on TradingView.
⸻
Even though we’re sitting near the middle, bulls have just pushed into a bearish liquidity level (marked “Bottom of Supply”). We don’t know how much supply is left here, but the fact that bulls are pressing in suggests the bears are losing steam. This doesn’t mean price won’t pull back—it just means bearish follow-through may be weaker.
With that in mind, here are the two main scenarios:
⸻
1. Green Arrow — Bullish Test of Sellers
– Stock
If bulls keep the pressure on, we may see a test of the “Big Sellers” zone. The reaction there will tell us a lot.
If we see a sharp rejection (a quick tag followed by a flush) or a fake breakout that reverses, I’d approach longs more cautiously.
However, an aggressive entry long around the “Top of Demand” (around $321) could make sense, especially considering how buyers have been stepping in. This setup is primed to retest highs.
– Options
Pricing will be key here—especially post-earnings (EOD).
I’d look 2 weeks out. If you can snag a 335C for $5.00–$7.00, that’s solid.
Target profit would be into the Big Sellers zone. If we get a strong move before then that nets 3R–5R, I’d take it.
⸻
2. Red Arrow — Bearish Reaction + Big Buyer Support
– Stock
If earnings disappoint, we could see a shift in momentum. That said, big buyers should step in around $295.
This is actually the more likely scenario in my view.
From there, I’d look for a swing back up into the 330–350 range.
We’ll need to see how sellers handle the drop—are they aggressive, or is it just a lack of buyer interest?
Either way, this could align well with long-term buy zones.
– Options
On a flush to $295, I’d look for 3–5 day expiration calls around the 305 strike. @ a price between $1.50–$1.70 (look for 2-3R)
After the bounce, I’d expect a pause or retest of the uptrend line.
Then I’d look 2–3 weeks out for the 325C or 330C, ideally between $3.00–$5.00.
I’ll keep an eye on option pricing and update if we reach that level.
⸻
That’s all for short-term TSLA.
Follow for more charting and trade ideas.
📲 @thecafetrader

XAUUSD bullish breakout from major supply zone retracement done📊XAUUSD Forecast – 1H Timeframe
Gold has broken out above the major supply zone at 3375, showing strong bullish intent
Price is now pulling back — retracement in progress back to the breakout level for a potential bullish continuation
📍 Key Zone to Watch:
3375 now acting as strong support — waiting for a bullish confirmation candle from this zone
🎯 Next Resistance / Target Levels:
🔹 3399 – minor resistance
🔹 3435 – key supply zone on watch
🧠Waiting patiently for confirmation before re-entering — structure still bullish on the 1H timeframe
What’s your next move on Gold? Drop your thoughts below
👍 Like | 🔔 Follow | 💭 Comment for real-time trade ideas
#xauusd #gold

EUR/USD - Bullish parallel channel formation!The EUR/USD currency pair is currently exhibiting a bullish market structure on the 4-hour timeframe, moving steadily within a well-defined ascending parallel channel. Price action has consistently bounced between the lower and upper boundaries of the channel, with each dip finding support at the lower trendline and each rally meeting resistance near the upper trendline. This ongoing pattern suggests a strong and orderly bullish trend as the pair continues to make higher highs and higher lows within the channel.
The Market’s Upward Momentum
One notable feature of this trend is the recurring formation of 4-hour Fair Value Gaps (FVGs) during each upward leg. These FVGs act as temporary inefficiencies in the price movement, which the market consistently returns to fill before resuming its bullish momentum. As shown in the chart, the EUR/USD has filled multiple FVGs over the past week. Today, the pair once again retraced to fill a newly formed 4H FVG and has since continued its move higher. This repeated behavior reinforces the strength of the uptrend, as the market efficiently corrects itself and then propels further in the direction of the overall trend.
Bullish Outlook
From a bullish perspective, the key level to watch is the horizontal resistance zone around 1.1766. A confirmed break and hold above this level would signal a strong continuation of the current uptrend. Should the price sustain itself above this level, it could initiate a renewed push toward the upper boundary of the ascending channel, potentially targeting levels near 1.1820 and beyond. This scenario would confirm market confidence and open the door for further gains.
Bearish Risk
On the flip side, the bearish case would involve a false breakout above the 1.1766 resistance level, followed by a sharp rejection and a break below the rising lower trendline of the channel. Such a move would invalidate the current structure and shift the bias to the downside. In that case, the 4-hour FVG located between approximately 1.1710 and 1.1740 will act as a critical support zone. If this area fails to hold, it could trigger a deeper retracement and potentially lead to a more prolonged bearish correction.
Final thoughts
In summary, the EUR/USD is currently respecting a bullish parallel channel on the 4-hour timeframe, with upward moves consistently leaving and then filling 4H FVGs before continuing higher. The 1.1766 level is pivotal, a sustained break above it favors continued bullish momentum, while a rejection and breakdown from the channel could signal a bearish reversal. Traders should closely monitor price behavior around this key level and the integrity of the ascending channel to anticipate the next significant move.
-------------------------
Disclosure: I am part of Trade Nation's Influencer program and receive a monthly fee for using their TradingView charts in my analysis.
Thanks for your support. If you enjoyed this analysis, make sure to follow me so you don't miss the next one. And if you found it helpful, feel free to drop a like 👍 and leave a comment 💬, I’d love to hear your thoughts!

AUD/USD Bulls Eye BreakoutThe Australian Dollar surged more than 1.8% this week with AUD/USD now testing multi-month uptrend resistance at fresh yearly highs. A four-day rally takes price into confluent resistance at the September low / upper parallel at 6622- The focus is on today’s close with the immediate advance vulnerable while below this key slope. Subsequent resistance objectives eyed at the 2019 low at 6671 and the 78.6% retracement of the broader 2024 decline at 6723.
Initial support rests with the July open at 6581 and is backed by the May high-day close (HDC) / weekly open at 6486-6506. Losses would need to be limited to this region for the late-June advance to remain viable (near-term bullish invalidation). Subsequent support seen at the June low-day close (LDC) at 6458 with a break below 6350 ultimately needed to suggest a more significant high is in place / larger reversal is underway.
Bottom line: A breakout of the July opening-range takes AUD/USD into confluent uptrend resistance- risk for topside exhaustion / price inflection here. From a trading standpoint, a good zone to reduce portions of long-exposure / raise protective stops – losses shudl be limited to 6486 IF price is heading higher on this stretch with a close above this slope needed to fuel the next leg of the advance.
Keep in mind the FOMC interest rate decision is on tap next week with Core Personal Consumption Expenditures (PCE) and Non-Farm Payrolls (NFPs) slated into the monthly cross. Stay nimble into the releases and watch the weekly closes here.
-MB

Gold Futures Update – 0.5 Fib Stop Hit, Eyes on 0.618 ConfluenceGold Futures Update – 0.5 Fib Stop Hit, Eyes on 0.618 Confluence
Our initial long setup at the 0.5 Fibonacci retracement level has been stopped out, but the structure remains constructive.
Price is now approaching a key confluence zone at $3,336 , where:
The 0.618 fib retracement from the recent swing low to high aligns perfectly,
The ascending trendline support (respected multiple times since May) intersects, and
The oint of Control (POC) from the visible volume profile shows dominant volume transacted.
This area represents a high-probability support level where bulls may attempt to defend again. We’re monitoring for reaction and potential entry signals around this level. A break below would invalidate the rising wedge structure and shift bias toward lower fib extensions.
HelenP. I Bitcoin can fall to support zone and then start riseHi folks today I'm prepared for you Bitcoin analytics. If we look at the Bitcoin chart, the most prominent feature is the formation of a large bullish pennant following a strong upward impulse. This type of consolidation pattern typically suggests that the market is pausing to gather strength before continuing in the direction of the primary trend. The price is currently consolidating within the boundaries of this pennant, which are defined by an upper resistance line and a strong ascending trend line acting as the lower support. It is crucial to note the confluence of this ascending trend line with the horizontal support zone between 116000 and 116800, creating a powerful area of potential support. My analysis is based on the expectation that the price will make a final test of this key support confluence. I believe that a dip towards the 116000 - 116800 zone will be met with strong buying interest. A clear rejection from this area, confirming that buyers are defending both the horizontal and dynamic support, would be the critical condition validating a long position. A successful bounce should provide the catalyst for a bullish breakout from the top of the pennant, signaling the resumption of the uptrend. Therefore, I have set the primary goal for this subsequent upward move at the 122000 level, a logical target that would confirm the continuation of the bullish market structure. If you like my analytics you may support me with your like/comment ❤️
Disclaimer: As part of ThinkMarkets’ Influencer Program, I am sponsored to share and publish their charts in my analysis.
Altseason 2025 – EthseasonWe’ve officially entered #ETH season. Some liquidity is flowing into alts, but CRYPTOCAP:ETH has now taken the lead from CRYPTOCAP:BTC as the big dog.
Old retail is here and slowly buying this dip... but the new retail is nowhere to be seen, yet! Still positioning for that full-blown altseason:
🥑 POLONIEX:GUACUSDT 🧱 MEXC:YBRUSDT ⛏️ MEXC:KLSUSDT
🌐 HTX:SYNTUSDT 🧪 MEXC:DEAIUSDT ✳️ MEXC:SAIUSDT
🔗 POLONIEX:LLUSDT 🎮 KUCOIN:MYRIAUSDT 🤖 COINEX:ENQAIUSDT
#crypto #altseason2025 #altseason #ethseason

Wait for 3330 to buy the bottom and reduce unnecessary operation#XAUUSD
We have made good profits from short selling yesterday. Currently, gold has fallen to 3350📎. The 4HMACD death cross has increased in volume and is expected to continue to decline. Consider going long near 3330📈. I don’t think it is prudent to bottom out at 3340. Move forward steadily on Friday and reduce unnecessary operations⚖️.
🚀 BUY 3335-3330
🚀 TP 3345-3362
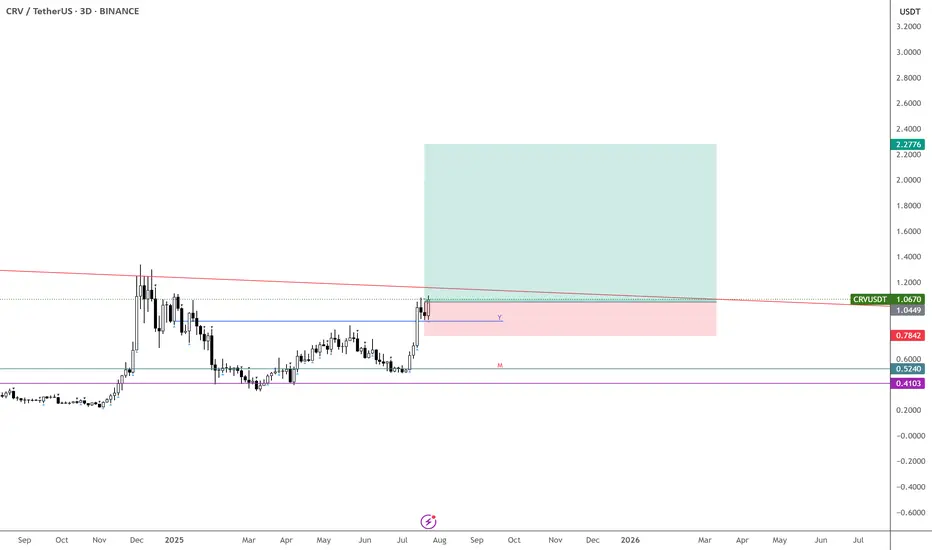
CVR – Ready to Run, Monthly Confirmation In
Tons of strength showing on $CVRUSDT—expecting continuation from here and even more once the trendline breaks.
The monthly candle is confirming the move, pointing to a potential 6-month uptrend. Looks like this one is finally ready for the run we’ve been waiting for.
Buying here and stacking more around 90c if given the chance.
First target: above $2.
BINANCE:ENAUSDT may have gotten away—but this one won’t.
A Legends Continuation. BTCHello I am the Cafe Trader.
Today we are going to look at a trade inspired by the Legendary Trader and Scalper Al Brooks.
If you are not familiar with him I recommend having a strong foundation with price action before giving him a look.
It's no secret that BTC is at levels many thought it would never reach, and yet many others are convinced of 5 - 10x more from this run alone. It can be crushing to feel like you missed out on the move, so instead of getting FOMO, I've detailed a guide to help you in the short or the long term.
Long Term
As of right now you are looking at 4 different levels of demand. It is up to you to measure your conviction, understanding why you want to invest, and how much you are willing to risk. Recognize that Many Big hedge funds have been hesitant with accumulating hoards of Crypto do to its volatile nature, considering it too risky.
So with this in mind, I have given you 4 levels to add BTC to your long term depending on your personal conviction.
Hyper Aggressive = Top of Demand $115,500 (willing to risk 50%)
Aggressive = Demand $99,500-101,250 (willing to risk 40%)
Fair Price = Strong Demand $74,000 - 78,000 (willing to risk 25%)
Steal = Extreme Demand $42,000 - 50,800 (willing to risk 10%)
Thinking about how much you are willing to risk will help you level out your Fear of missing this move, and get pricing that meets your personal demand.
Short Term
My fellow traders, this is a nugget (inspired) from Al Brooks. The "Two Bar Trend Break" .
In a strong trend (not in a range), When you get a trend break (I like to go top of wick to top of wick for this trade), if the second bar doesn't have a huge topping tail, but closes near the top, you can enter this trade.
Here is a trade that happened this month That hasn't filled yet (it got close).
Entry At the close of the second green candle $116,000.
Measure the bottom of the First candle that broke (called the Signal candle) to the top of the second bar that broke (called the Entery Candle). If you take that measurement, and add it to your take profit, you will have a 1R Scalp (1 measure of risk to 1 measure of reward).
This isn't a true scalp, typically they should be in the same bar or next bar, but this follows similar principles.
That's all for BTC, stay tuned for more analysis as we go over Ethereum, XRP, and one more of your choosing.
Happy Trading!
@thecafetrader

SUI Analysis (6H)If you're on the hunt for extreme risks and potentially high rewards — SUI might be calling your name.
Currently, SUI is trending within a well-respected ascending channel, and just today, it tapped both the demand zone and the lower boundary of this channel.
That’s what we call a double support, and it often signals a strong potential bounce.
SUI now appears to be forming a bullish flag pattern. If this formation breaks to the upside, it could trigger the fifth impulsive wave in line with Elliott Wave Theory.
In such a case, the main target is projected around $5.00–$5.20.
Extreme setups demand extreme conviction.
Good luck.
GBPJPY Potential UpsidesHey Traders, in the coming week we are monitoring GBPJPY for a buying opportunity around 197.900 zone, GBPJPY is trading in an uptrend and currently is in a correction phase in which it is approaching the trend at 197.900 support and resistance area.
Trade safe, Joe.

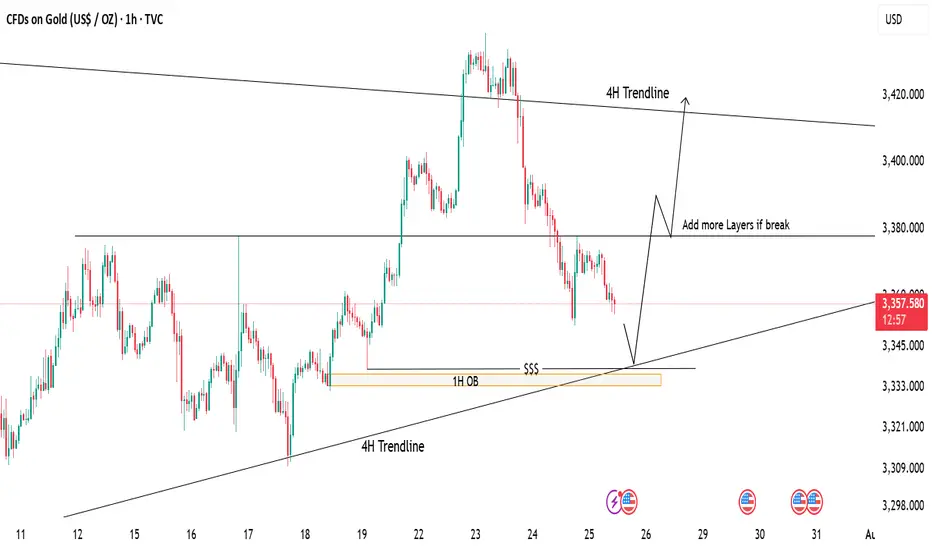
Gold Tapping Into Major Support – Eyes on Bullish ReversalPrice is currently retracing after a strong drop from recent highs. We're now approaching a key demand zone, aligning with:
📍 1H Order Block (OB)
📍 4H Trendline Support
📍 Liquidity Zone ($$$)
📉 If price taps into this area, it may offer a high-probability long setup.
📈 First target: 3380 (mid-range resistance)
🧱 If this breaks, we can look to scale in/add more positions, targeting the 4H trendline zone near 3420.
⚠️ Waiting for price reaction at support – patience is key!