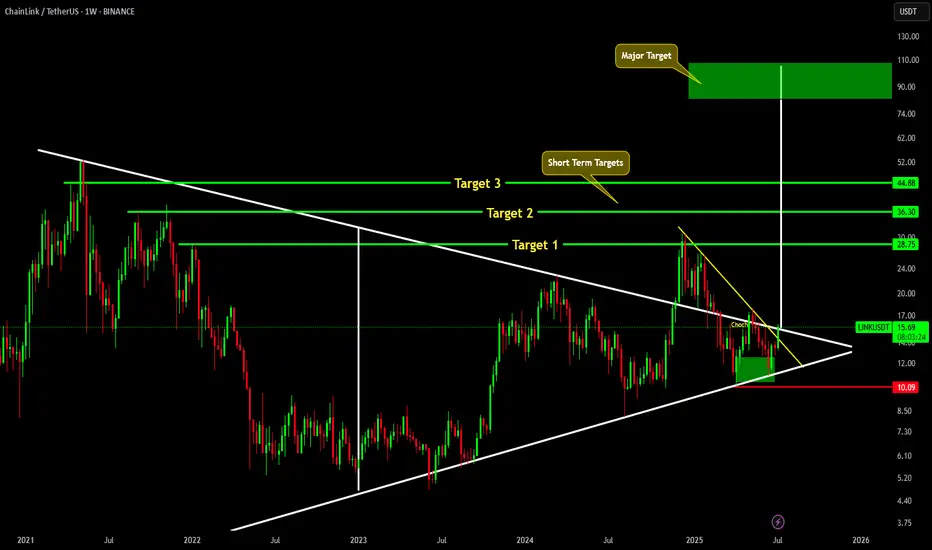
LINK MAJOR MOVE AHEAD !!!CRYPTOCAP:LINK is about to break above major trendline. If it successfully breaks above it, we will see CRYPTOCAP:LINK hitting short term targets of 28, 26 & 44. And Major target for link is around 80-100$.
Trend Lines
KALA BIO (KALA) Bullish Channel Breakout Setup – Eyes on $13 KALA BIO (KALA) is forming a bullish ascending channel after a prolonged base, with price consistently making higher lows and higher highs. The current setup suggests strong accumulation, and the stock is now approaching a potential breakout point.
A clear uptrend channel is visible, and a breakout from this pattern could trigger a powerful move towards the analyst target at $13.00, as marked on the chart. The green arrow highlights the expected bullish momentum if the breakout materializes.
Trade Idea:
Entry: On breakout above the upper channel line, confirming momentum
Target: $13.00 (analyst target)
Stop: Below the channel support or recent swing low to manage risk
Volume confirmation and overall market sentiment will be key. As always, use proper risk management and do your own research before entering any trade.

BTM Triangle Squeeze: Watching for Breakout Above TrendlineBitcoin Depot Inc. (BTM) is setting up for a potentially explosive move as price action consolidates within a tightening triangle pattern. After a strong rally from mid-May, BTM found consistent support along an ascending trendline, recently bouncing and holding above this key area.
Currently, price is pressing up against a well-defined descending breakout line. A clear break and close above this trendline could signal the start of a new bullish leg, especially with analyst price targets near $7.00 suggesting further upside potential.
My Trade Plan:
Entry: Watching for a confirmed breakout above the descending trendline, ideally on higher volume.
Target: Analyst price target at $7.00, with potential for further extension.
Stop: Below the ascending support line or recent swing low to manage risk.
This setup shows strong momentum and a classic technical pattern. As always, I will wait for confirmation before entering, and will manage risk accordingly. This is not financial advice—please do your own research before trading.

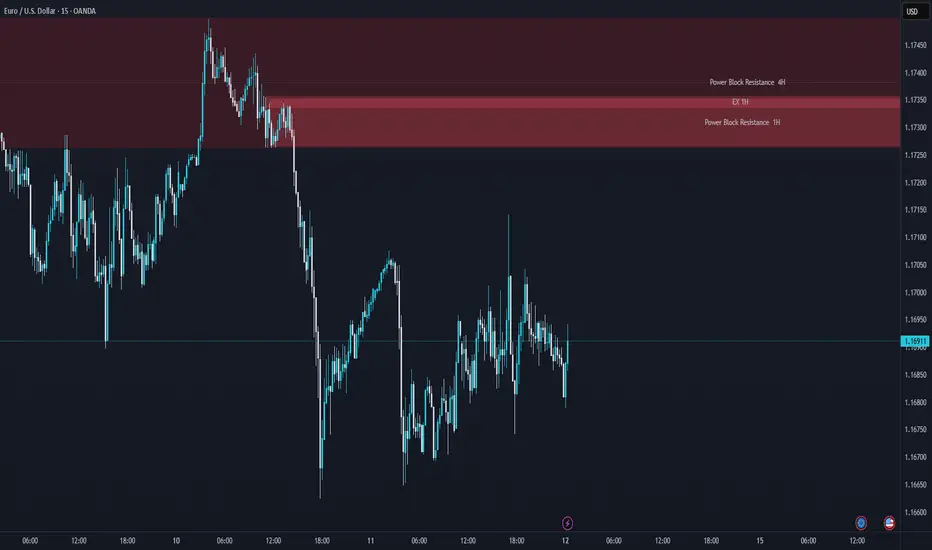
USDJPY M15 Support & Resistance Levels🚀 Here are some key zones I've identified on the 15m timeframe.
These zones are based on real-time data analysis performed by a custom software I personally developed.
The tool is designed to scan the market continuously and highlight potential areas of interest based on price action behavior and volume dynamics.
Your feedback is welcome!

Bearish Signal | Technical + Custom AlgoSmart Trend Signal | Technical Analysis + Custom Algorithm
This signal is the result of a combination of classic technical trend analysis and a proprietary software I personally developed.
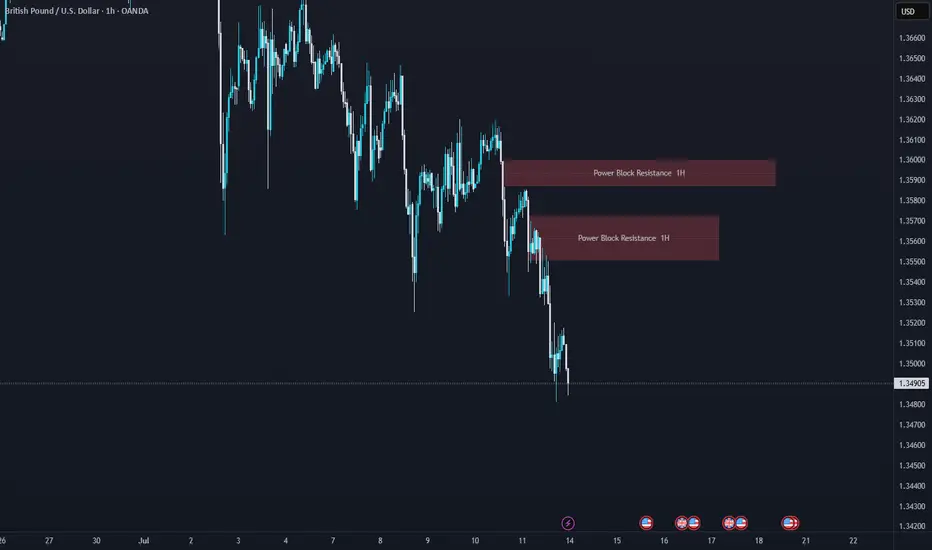
GBPUSD Bearish Signal | Technical + Custom AlgoSmart Trend Signal | Technical Analysis + Custom Algorithm
This signal is the result of a combination of classic technical trend analysis and a proprietary software I personally developed.
SHIBUSDT Best 3 points to save 600% gainHi as we can see on this chart Price is just starting to pump and hit our 600% Target and even then it is still far from Previous ATH.
Market is getting bullish once again and we are looking for rise and gain here too and our targets are all mentioned on the chart and major pump will start after breakout of red trendline.
DISCLAIMER: ((trade based on your own decision))
<<press like👍 if you enjoy💚

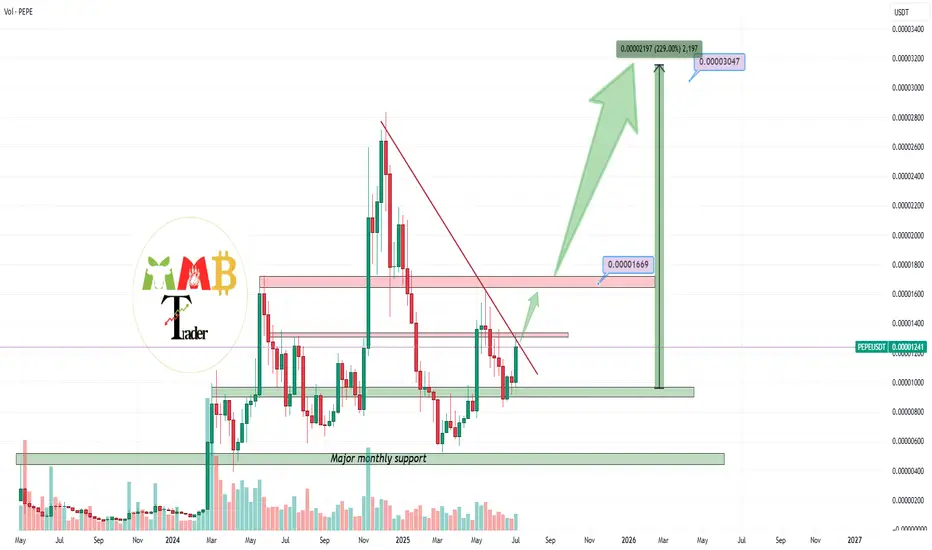
SLPUSDT +250% gain is nothing for it in this bull market Major monthly low and daily support is trying to rocket it and pump it like previous time and this time at least +250% rise is nothing special with this chart.
0.0010$ to 0.0012$ is now major monthly support zone and we can expect at least target 0.0030$ now and in bull market like this soon the pump will start with high volume around 15B SLP for weekly candles.
DISCLAIMER: ((trade based on your own decision))
<<press like👍 if you enjoy💚

PEPEUSDT high potential pump is cooking As we can see price is near major resistance of 0.000013$ and any breakout here to the upside is going to pump price hard to the targets like 0.000040$.
Two major resistance here is now same which are 0.000013$ which is weekly resistance zone + red trendline resistance also now is here so after breaking this resistance pump is expected and i am looking for heavy pump and even new ATH here.
DISCLAIMER: ((trade based on your own decision))
<<press like👍 if you enjoy💚
Gold trend analysis: long positions are still the general trend
After opening on Friday morning, it started to rise directly. The opening was the low of the day and continued into the European session, reaching the highest point near 3340-45, which was also close to the previous high point. After touching this position, the bears also ushered in a symbolic correction and tried to test the position above 30 many times. However, it finally catered to the strength of the bulls and began to break through in the US session, reaching the highest point near 3369, and also pierced the previous high of 3365 for the first time, and then retreated and corrected again. The daily line also closed in the form of a large positive line with an upper lead. The gold hourly line continued to diverge from the golden cross upward bullish arrangement. The gold bullish strength is still there, and the gold moving average support has also moved up to around 3320-25. After gold broke through the 3345 line on Friday, it rose all the way, reaching the highest point of 3369. We continue to be bullish on gold when it falls back to the 3320-25 line next week. The short-term 3320-25 line of gold has formed a strong support, and gold will continue to buy on dips when it falls back next week. If your current gold operation is not ideal, I hope Yulia can make your investment smooth. Welcome to communicate with us!
From the 4-hour analysis, the support below is around 3320-25, and the short-term bullish strong dividing line is around 3365-3370. The overall low-multiple bullish rhythm remains unchanged. Before the daily level falls below the 3300 mark, any retracement is a long opportunity. Be cautious about short positions against the trend.
Gold operation strategy:
Gold retracement 3320-25 line long, stop loss 3313, target 3365-70 line, break and continue to hold

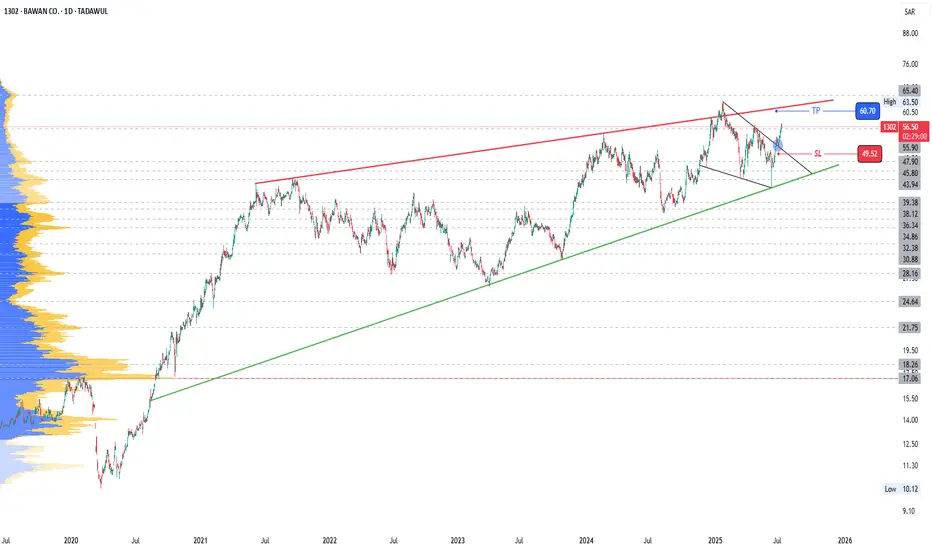
1302: Breakout of trendline resistance1302
Moving within a Rising Wedge
Price has just broken a short term resistance.
Short trade up to the top of rising wedge can be taken
Levels are marked
Trail SL accordingly.
Do proper risk management.
Watch for breakout of Rising Wedge top (Resistance)
GOLD (XAUUSD): Another Bullish Pattern
Gold perfectly respected a rising trend line on a daily and
bounce from that, as I predicted earlier.
I see a strong bullish pattern on that now.
The price formed a cup & handle pattern and closed
on Friday, testing its neckline.
The next bullish confirmation that you should look for is its breakout.
Daily candle close above 3367 level will provide a breakout validation.
A bullish continuation will be expected then.
❤️Please, support my work with like, thank you!❤️
I am part of Trade Nation's Influencer program and receive a monthly fee for using their TradingView charts in my analysis.

Altseason 2025 - Wave 3Bitcoin is approaching its next destination between $125K and $250K, and that means its time to shift focus to altcoins. We’re not in full-blown altseason yet, but the foundations are forming. BTC dominance needs to drop fast, that’s the key trigger. Once it does, the rotation into alts could accelerate quickly.
Favorites so far this cycle:
🥑 POLONIEX:GUACUSDT 🧱 MEXC:YBRUSDT ⛏️ MEXC:KLSUSDT
🌐 HTX:SYNTUSDT 🧪 POLONIEX:DEAIUSDT *⃣ MEXC:SAIUSDT
🔗 POLONIEX:LLUSDT 🎮 KUCOIN:MYRIAUSDT 🤖 COINEX:ENQAIUSDT

XAUUSD 4HHello,
this is my own opinion about XAUUSD timeframe 4h today
as far as i can see, XAUUSD 4h still in trendline channel downtrend
but, in meantime, we can see also pattern Flag has form, so i think we can entry now or wait for break downtrend/flag
but the seller volume is quite big in the previous candle 4h, so manage your own RRR (Risk Reward Ratio)
PWH = Previous Week High
PWL = Previous Week Low
Price now is around 4h bull fvg + daily
if we use fibonacci price also hit 0.618

HYPEUSDT KUCOIN:HYPEUSDT 4H Analysis Price has broken out above the 44.5 support zone and is holding strong 🚀. As long as this level holds, targets are set at 50.615 and 57.164 📈. If 44.5 breaks down, next support is seen at 40.433 🔻.
Key Levels:
✅ Support: 44.5
🟩 Targets: 50.615 → 57.164
🔴 Next support if breakdown: 40.433

NEAR Breakout Confirmed—But Is This Just a Bull Trap?Yello Paradisers! Did you see that breakout on #NEARUSDT? After weeks of consistent lower highs and a clearly defined descending resistance, price action has finally snapped that bearish structure and completed a textbook inverse Head and Shoulders formation on the 12H chart. This kind of pattern doesn’t appear often at key cycle points, and when it does—especially with confirmation—it becomes a high-probability signal of a trend reversal.
💎#NEARUSDT ,The neckline of the inverse H&S, sitting around the $2.17–$2.23 zone, has now been broken and crucially retested as support. This means the former resistance is now acting as a probable base for bulls, and if price remains above this area, the market is likely preparing for a strong probable impulsive move to the upside.
💎The structure shows clear bullish intent, and from a technical perspective, the first resistance comes in at $2.72. A clean break above that could open the door toward the major resistance zone between $2.97 and $3.05, which would complete the projected breakout target of the H&S pattern.
💎If bulls manage to maintain control above the $2.17–$2.23 support zone, we expect price to slowly build momentum toward $2.72, with increased volatility likely once that level is tested. Should that break occur with volume, the next leg may extend rapidly into the major resistance zone. However, if price fails to hold above this flipped support zone, we will be closely watching the $2.02–$1.89 area as the last major support before invalidation.
💎A daily candle closing below $1.798 would invalidate this entire bullish thesis and put the market back into a neutral-to-bearish range.
💎Adding more probability to this setup, NEAR is now trading above multi-timeframe EMA on higher time frame. This multi-timeframe EMA alignment supports bullish continuation, as momentum begins to shift in favor of buyers. However, continuation depends heavily on how price reacts at each resistance level—especially as we enter the mid-$2.70s.
💎The probable move from here is bullish, with the expectation that NEAR pushes toward the $2.72 level in the short term, followed by a potential rally to $2.97–$3.05 if momentum sustains. This scenario remains valid as long as price holds above $2.17, and especially above $2.02. Below that, the structure weakens. Below $1.798, the bullish bias becomes fully invalidated.
This is the only way you will make it far in your crypto trading journey. Stay sharp and patient, Paradisers. It’s not about chasing pumps—it’s about positioning smartly before the crowd.
MyCryptoParadise
iFeel the success🌴

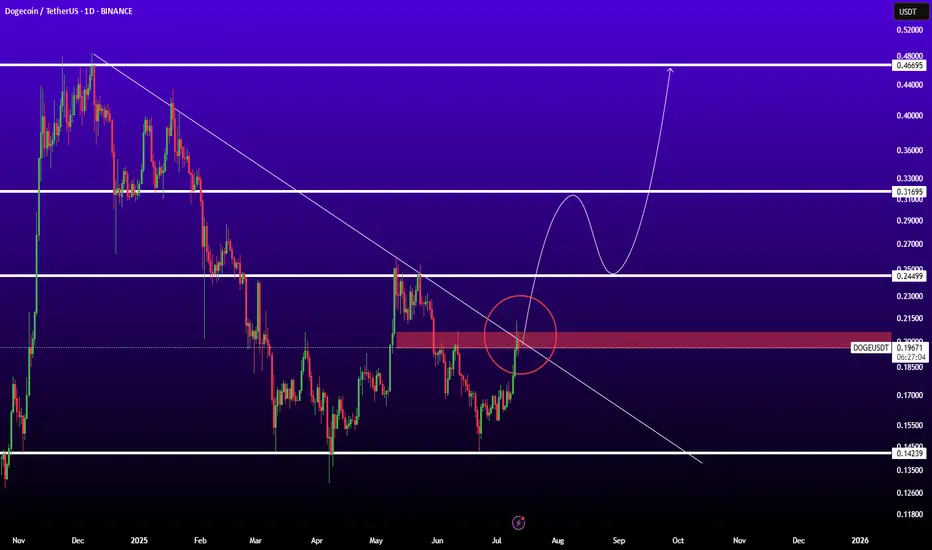
DOGEUSDTBINANCE:DOGEUSDT is in good level for pump because if breaked trendline and resistance 0.200$ ready for sharp movement to next levels.
Resistances: 0.25 - 0.32 - 0.45
Support: 0.15