Gold resumes its rally
From the 4-hour analysis, the upper side focuses on the short-term suppression of 3345-50. Today's lower support focuses on the vicinity of 3309-16. The short-term bullish strong dividing line is near 3295-3301. The overall bullish rhythm of high-altitude and low-multiple continues to remain unchanged. Before the daily level falls below the 3300 mark, any retracement is a long opportunity. Short orders against the trend should be cautious.
Gold operation strategy:
1. Go long on gold when it falls back to 3316-25, stop loss at 3307, target at 3340-45, and continue to hold if it breaks;
2. Go short on gold when it rebounds to 3345-50, stop loss at 3357, target at 3320-3326, and continue to hold if it breaks;
Trend Lines

Gold prices are faking declines but rising, so beware
💡Message Strategy
As trade uncertainty heats up, gold welcomes safe-haven buying
After the Trump administration issued a series of tariff notices against many countries around the world, market risk aversion has intensified. The US President announced on Wednesday that a new 50% tariff on copper imports will be imposed from August 1, and reiterated that "the deadline will not be extended for countries that have received the notice, and any retaliatory measures will be responded to by tax increases."
This move has triggered market concerns about the slowdown in global economic growth, and traditional safe-haven assets such as gold have been sought after. The current gold price has rebounded significantly from the one-and-a-half-week low hit the previous day.
According to market surveys, safe-haven funds are being reconfigured, especially in the context of the unclear Fed policy and the direction of the US dollar, gold has become a non-yielding asset preferred in the short term.
📊Technical aspects
From the 1H chart, the gold price has approached the 100-period simple moving average (SMA), which is currently located around 3,335, forming an initial resistance. If the price effectively breaks through this area, the next resistance level will be in the 3,345-3,350 range. Once it breaks through, it may trigger a short-covering market, pushing the gold price back to the 3,400 integer mark.
If gold breaks above 3,360, it will confirm the short-term bottom and open the door to re-challenging the high point of the year. On the contrary, if the gold price falls below 3,300 again, it may retest the 3,280 support, and further downside space will extend to the July low of 3,247.
For now, the performance of gold bulls is relatively prominent, and it is recommended to do more on the pullback.
💰Strategy Package
Long Position:3300-3310,SL:3285,Target: 3340-3350

MORPHO | Euler Catch-Up TradeAfter Euler had a sensational run, Morpho in the same sector might be in for a catch-up trade.
Two Strategic Entry Points:
• Entry 1: Wait for a retest of the diagonal trendline (descending green line) around $1.50-1.60 area
• Entry 2: Enter after price breaks and retests the horizontal resistance zone around $1.90-2.00
Risk Considerations:
•A break below the diagonal support would invalidate the bullish thesis
• The horizontal resistance has acted as a strong ceiling previously
• Volume confirmation will be crucial for any breakout attempt

How to seize gold trading opportunitiesNews:
On Friday (July 11) in the Asian time zone, US President Trump posted a "tariff change" on social media, announcing that a 35% tariff would be imposed on all Canadian goods from August 1, a 10 percentage point increase from the current rate. This decision was like a thunderbolt, instantly igniting the market's risk aversion sentiment, and the spot gold price soared, reaching a high of $3,344 per ounce during the session. Although Trump extended the tariff agreement to August 1, which once suppressed the gold price, he subsequently stated that it would not be extended after the expiration, and launched further tariff attacks after the expiration, announcing a new 50% tariff on copper imports from the United States and a 50% tariff on goods from Brazil, which increased concerns about tariff risks and pushed the gold price to rebound from the bottom;
Gold trend analysis:
The market is fluctuating repeatedly now, and it is possible to rise or fall, but under the bullish trend, the main force is still rising. Therefore, this week's trading is to fall back and do more at a low price. Whether it is the previous 3285, 3304, or 3317, there are good profits. Although it is temporarily unable to break out of the bullish volume, at least the trend remains unchanged, and there will definitely be a large upward space in the future. Today is Friday, and we still pay attention to the possibility of bullish volume. This Monday has been emphasizing that if it rises during the week, it will look at the 3345 high point. If 3345 breaks, there are still 3365 and 3400 above. Friday will see whether this idea is realized.
From a technical point of view, all cycles are obviously bullish now. The daily line bottomed out on Tuesday, and Wednesday and Thursday were all small broken Yang rising. If it continues, we will first see whether the daily Bollinger middle rail 3345 pressure is broken. After the break, the big Yang closes high. This wave of rise may reach 3400. Therefore, the daily cycle has a lot of room for growth and should not be taken lightly. The H4 cycle needs to see whether today's rise can break 3345, because if it breaks 3345, there is a possibility of the upper rail opening. After the upper rail opens, gold will have a unilateral trend. Therefore, today's bullish target is 3345. If 3345 is not broken, there is still a possibility of a decline. If 3345 breaks, there will be 3365 and 3400 above. Here, it is clearly bullish and optimistic about the break of 3345. After determining the direction, the trading idea on Friday is also clear. It must be mainly long on the decline. The support below is 3320-3310. Don't chase more in the European session. Trade again if there is a decline.
Gold operation strategy: It is recommended to go long if it falls back to around 3315-3325, with the target at 3335-3345; it is recommended to consider shorting if it touches 3345 but does not break, with the target at 3335-3325.

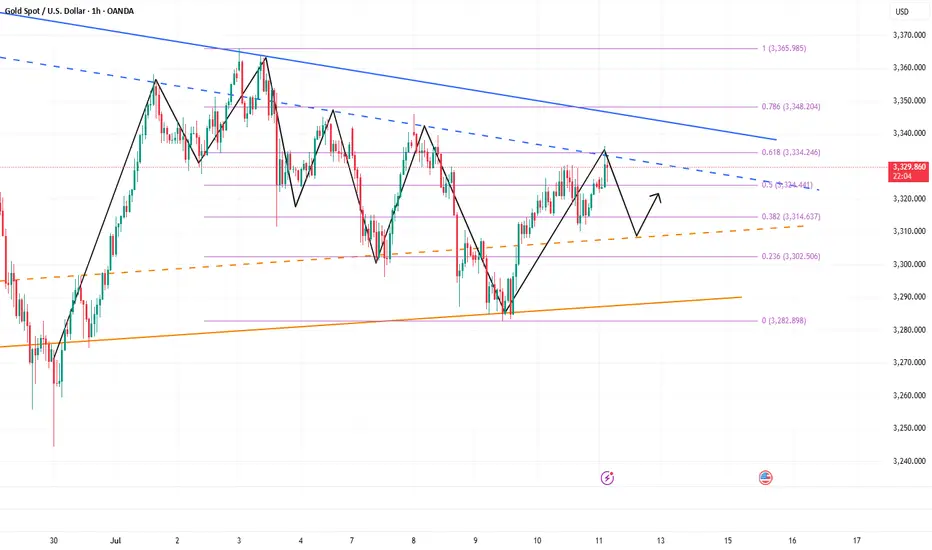
GOLD → Distribution. There is potential for growth to 3450–3500FX:XAUUSD breaks through consolidation resistance and forms a distribution pattern. A breakout of 3345-3358 could lead to another rally amid high economic risks...
Gold is rising for the third day in a row amid growing concerns about new tariffs announced by Trump. He threatened to impose tariffs on Canada and most of its trading partners, as well as the EU. Despite the strengthening of the dollar, demand for gold remains strong due to uncertainty and expectations for US inflation data next week. Investors are cautious ahead of CPI and the Fed's possible response
The correlation between gold and the dollar is declining, with gold rising due to geopolitical reasons amid high economic risks.
If the bulls keep the price above 3300-3345, the market could be extremely positive for 3400-3500.
Resistance levels: 3345, 3358
Support levels: 3330, 3308
Gold has broken through the resistance of the “triangle” consolidation pattern and is forming a distribution phase towards the zone of interest 3345 - 3358, from which a small correction may form before growth. Since 3345 is an intermediate level, the focus is on 3358. I do not rule out the possibility of a long squeeze of the support levels 3330, the triangle support, and 3310 before the growth continues.
Best regards, R. Linda!

Bearish Momentum Builds Below pivot zone USNAS100 Analysis
Price has reversed from its ATH and now shows bearish momentum.
Below 22705, downside targets are 22615 and 22420.
Bullish scenario only valid if price breaks and holds above 22815.
Pivot: 22710
Support: 22615, 22420
Resistance: 22815, 22910

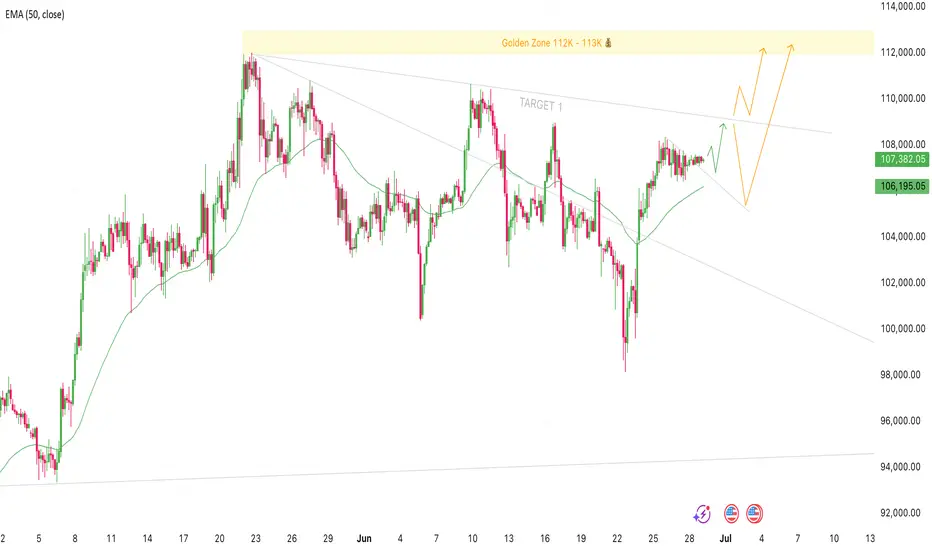
Bitcoin Setup for 109K and New Highs Could Be NextTrade Idea:
Direction: long
Entry: Now 107,350 - 106,800
Stop Loss: 102,000
Target 1: 109,000
Golden Zone: 112,000 - 113,000
Bitcoin has been consolidating for the last four days with no real price increase, but we’ve still managed to break above the short-term descending trend line. This could signal a continuation of the current swing up to the next resistance around 109K, which lines up with the daily trend line.
My bias here is that once we hit that 109K area, we could either see a pullback to around 104 to 106K before pushing higher, or we might break straight through, retest the trendline, and continue quickly to new highs above 112K.
I’ll be watching closely to see how price reacts around 109K, whether it rejects or breaks through. Either way the structure remains bullish, and if we get a rejection I'll be looking to re-enter.
Let's see how this plays out ✌️
Gold fluctuates, consolidation in the 3330-3310 range📰 News information:
1. Waller meeting on interest rate cuts
2. Trump tariff issues
📈 Technical Analysis:
Waller will participate in the meeting in more than two hours and pay attention to whether there is any news of interest rate cut. The key is to operate around the 3330-3310 range. Continue to pay attention to the support of 3310-3305 at night. If gold falls below 3310,-3305 again, the downward trend will continue, and it is expected to touch 3280 again, or even 3250. If it rebounds above 3330, it is likely to continue to rise.
In addition to investment, life also includes poetry, distant places, and Allen. Facing the market is actually facing yourself, correcting your shortcomings, facing your mistakes, and exercising strict self-discipline. I share free trading strategies and analysis ideas every day for reference by brothers. I hope my analysis can help you.
TVC:GOLD FXOPEN:XAUUSD FX:XAUUSD FOREXCOM:XAUUSD PEPPERSTONE:XAUUSD OANDA:XAUUSD

EURUSD: Strong Bullish Confirmation?! 🇪🇺🇺🇸
There is a high chance that EURUSD will move up from the
underlined intraday support.
An ascending triangle formation and a violation of its neckline
indicate a strength of the buyers.
Goal - 1.1705
❤️Please, support my work with like, thank you!❤️
I am part of Trade Nation's Influencer program and receive a monthly fee for using their TradingView charts in my analysis.

Go long when the trend reverses, beware of black swansYesterday's pullback to 3313-3310 confirmed the upward trend of gold. As I expected, it broke through the resistance of 3330 and touched around 3345. Currently, the short-term strong resistance is at 3345. Only by breaking through this resistance can gold maintain its upward trend. If it is blocked near the 3345 line in the short term, there is a possibility of a pullback. If 3345 breaks, there will be 3365 and 3400 above. Once the direction is clear, it will be easier to act. If there is a pullback during the day, it will give us a trading opportunity to enter the long position.
OANDA:XAUUSD

Bitcoin & new rallyBitcoin surpassed its previous all-time high of $112,000 and is now approaching $124,700, the third resistance level for July's pivot.

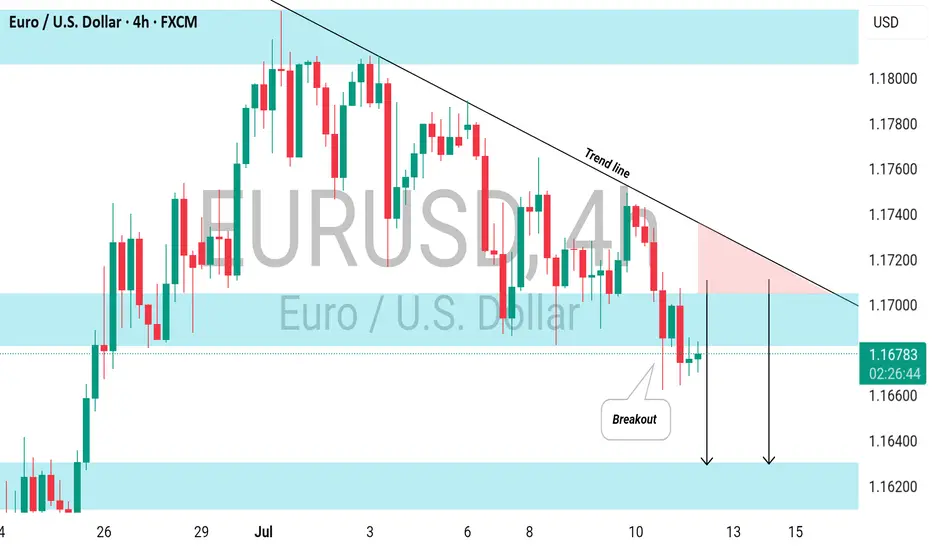
EURUSD: Bearish Continuation Ahead EURUSD is expected to maintain a bearish trend following a confirmed breakout below a significant horizontal support level.
The broken structure, along with a descending trend line, creates a contracting supply zone, indicating a strong likelihood of further downward movement.
The next target is 1.1620 support
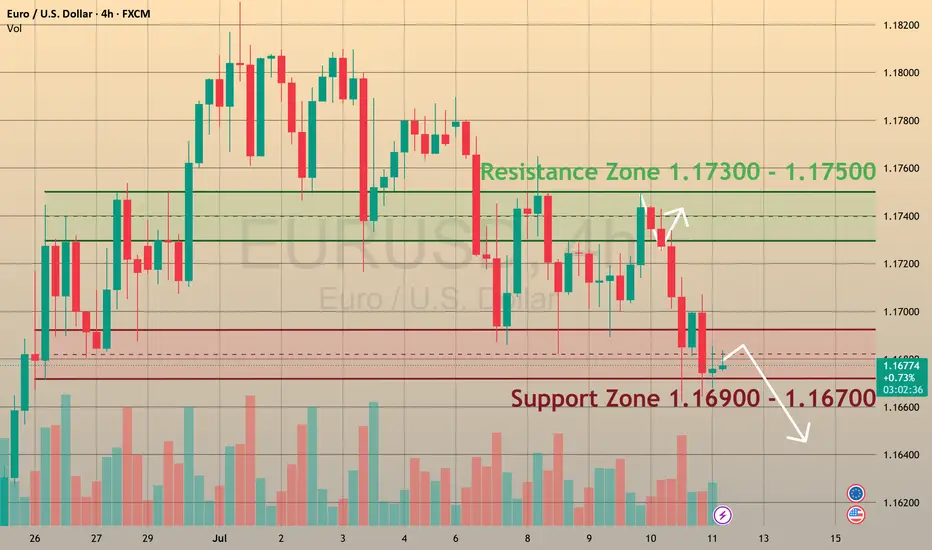
EURUSD is ready to break supportCMCMARKETS:EURUSD
The Euro fell to 1.1670 on Friday, positioning for nearly a 1% weekly loss 📊, as investors recalibrated risk exposure amid escalating trade tensions ⚔️ and shifting monetary policy signals 🏦.
📉 Market Structure:
🔻 EURUSD has traded in a bearish trend since July 1.
🔹 Support levels: 1.1680 and 1.1590.
🔹 Retested the 1.1680 support zone on Friday.
💡 How to Trade This:
✅ If the pair rebounds from support 🔄, consider BUYING with a Take Profit near the next resistance level.
❌ If the support breaks with confirmation 🩻, consider SELLING to target lower support zones.
📰 What’s Driving the Move?
🏦 Monetary Policy:
Chicago Fed President Austan Goolsbee pushed back against calls for aggressive rate cuts 🗣️, reaffirming the Fed’s focus on its dual mandate of maximum employment and price stability ⚖️. His cautious stance adds uncertainty 🤔 to the policy outlook for the second half of the year as markets weigh inflation risks vs. growth slowdown signals.
💼 Economic Data:
The labor market remains solid 💪, but recent jobless claims data show early signs of cooling 🧊, following last week’s strong NFP report.
💵 Dollar Strength:
The dollar advanced sharply against the euro 🚀, driven by risk aversion, relative yield advantages, and investor positioning ahead of upcoming inflation data and the Fed’s next policy signals 📈.
🚨 Watch for:
🔸 A confirmed breakout or rebound at 1.1680 to guide trade entries.
🔸 Upcoming U.S. inflation data 🪙 for direction on Fed policy and USD strength.
🔸 Further developments in trade tensions 🌐, which could drive risk sentiment.
GOLD (XAUUSD): Bullish Trend-Following Movement Ahead! 📈 GOLD shows several bullish signals on the 4H chart.
Initially, the price surpassed and closed above a resistance line of a bullish flag pattern.
Following that, a confirmed Change of Character (CHoCH) took place.
The price appears poised for further growth, with the next resistance level at 3360.

UTK Xmoney: Bullish Reversal in Sight?After a prolonged bearish trend, UTK Xmoney appears to be forming a strong bottom near the $0.03–$0.04 range. The weekly chart suggests that the asset may be entering a new bullish cycle, especially considering the previous historical support and resistance levels.
My projection (green dotted line) envisions a gradual recovery, with UTK breaking through key resistances at $0.13678 and $0.51413, aiming for the $0.73614 region by 2026. This scenario is based on:
Technical Analysis: Multiple rejections of the lower support zone and historical pattern of strong upswings after prolonged accumulation periods.
Market Sentiment: Increasing adoption of Xmoney’s payment solutions, partnerships, and overall crypto market cycles.
Risk Management: If the $0.03940 support fails, downside risk increases significantly.
Trade Idea:
Long-term position from current levels ($0.03–$0.04) targeting $0.73, with partial profit-taking at $0.13 and $0.51. Stop-loss below $0.039.
Disclaimer:
This analysis is for informational purposes only and not financial advice. Always do your own research.

Gold’s Uptrend Is a Mirage,Bears Are Lurking Beneath!Gold has rebounded to around 3336, and seems to have tried to stand above 3335, but it has not stood firm. Therefore, it cannot be considered that the bulls have an advantage just because gold has tried to break through 3335. Recently, I have been reminding everyone that before gold stands above 3335, the bears still have the spare power to dominate the market, so I fully believe that the gold bulls and bears will fight fiercely for control around 3335!
Why do I think it is difficult for gold bulls to have a good performance in the short term? Because since gold fell and touched 3285, it has fallen below many key supports. The market is short-selling. The previous support has become a key resistance under the effect of technical top and bottom conversion, and multiple resistances are concentrated in the 3335-3345-3355 area. Under the suppression of multiple resistances, it is difficult for gold bulls to make any progress in the short term.
So before the resistance is effectively broken, I think any rebound may be an opportunity to short gold, so I will try to find the band top and short gold based on the resistance area, and now I think it is still worth a try to short gold in the 3330-3340 area as originally planned! And look at the target area of 3320-3310
Oxford Industries | OXM | Long at $38.10Oxford Industries NYSE:OXM is an apparel company that designs, sources, markets, and distributes lifestyle brands like Tommy Bahama, Lilly Pulitzer, and Southern Tide. While I am not super bullish on the retail sector given the blaring recession signals, I also don't think this is the end of life as we know it... the anticipated downside is already priced-in for many retail brands.
From a technical analysis perspective, NYSE:OXM has entered my "crash" simple moving average zone. Typically, but not always, this is an area where value investors accumulate shares in anticipation of a future rise in share price. While the price is likely to dip near $28-$30 in the near-term, the last open price gap on the daily chart since the COVID-19 pandemic was closed today. Also, last week, an NYSE:OXM Officer and the CEO bought just over $600,000 in shares near $40 and the stock is currently trading at book value.
Fundamentals:
P/E = 7.4x (apparel sector average = 22.4x)
Forward P/E = 11.4x
Dividend = 7.25%
Debt-to-equity = .2x (healthy)
Regardless of some strong fundamentals, persistent macro volatility, consumer caution, and tariff pressures may delay recovery. Analysts expect flat to declining sales in 2025, with limited organic growth. Like I mentioned above, while there is likely short-term pain here, the fundamentals are there to potentially weather the storm.
Thus, at $38.10, NYSE:OXM is in a personal buy zone with the further decline between $28-$30 likely (where additional share accumulation will occur as long as the fundamentals do not change).
Targets into 2027
$45.00 (+18.0%)
$50.00 (+31.2%)

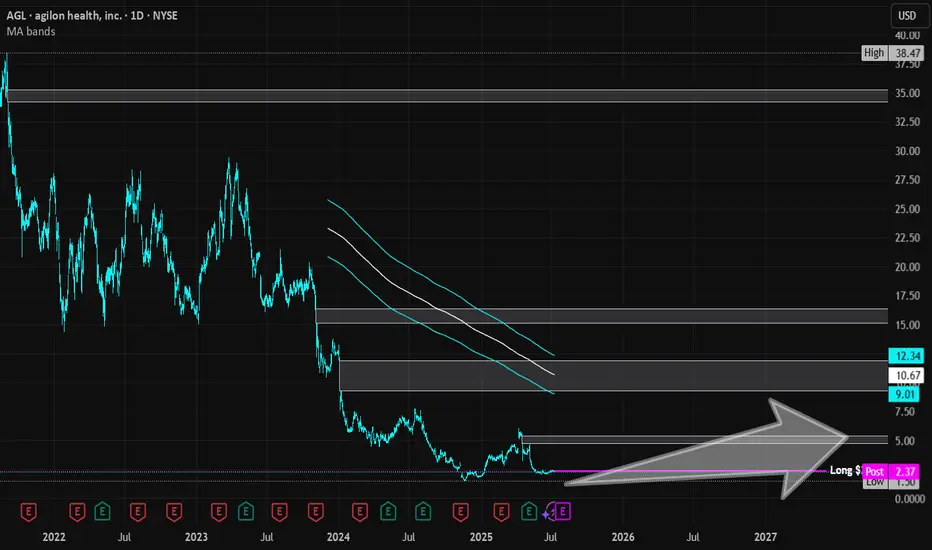
Agilon Health | AGL | Long at $2.36Reentering this trade (original: )
Agilon Health NYSE:AGL
Pros:
Revenue consistently grew from 2019 ($794 million) to 2024 ($6.06 billion). Expected to reach $9.16 billion by 2028.
Current debt-to-equity ratio 0.07 (very low)
Sufficient cash reserves to fund operations and strategic initiatives
Strong membership growth (659,000 in 2024, a 38% year-over-year increase)
Recent insider buying ($2 - $3) and awarding of options
Cons:
Rising medical costs - currently unprofitable and not forecast to become profitable over the next 3 years
Medicare Advantage Membership issues with the new political administration
No dividend
It's a gamble and I think it's a possibility this could drop near $1 in the near-term due to the Medicaid changes/fear... regardless, long-term, personal buy-zone at $2.36.
Targets in 2027
$3.70 (+56.8%)
$5.25 (+122.5%)
ETH - Back at the Level Everyone Forgot.Everyone’s watching ETH pump right now like it’s something new. It’s not. Look closer:
This is a look back in time to the breakdown that started to slide in Jan 2025.
That clean base around $3300 was holding for months in late 2024. It failed in January Q1, dragged us to sub-$2K by March, but now we’re right back under it.
This isn’t a random pump, it’s ETH revisiting the exact area it broke down from.
• White line = previous floor that gave out
• Dotted line = current price climbing back up into that structure
A move above $2960–$3300 flips the entire structure from resistance to reclaimed floor.
Market memory’s short, but price tends to remember everything.

Gold has a big win this dayNews: In the early Asian session on Thursday (July 10), spot gold fluctuated slightly higher, once regaining the 3320 mark, and is currently trading around $3323/ounce. On Wednesday, gold prices rebounded strongly after hitting a two-week low of 3282.61, closing at $3313.38/ounce, showing strong momentum for recovery. Trump extended the tariff agreement to August 1 and began to collect tariffs again. Although it eased market tensions, his remarks will not be extended after the expiration, and he issued tariff threats, which increased global trade uncertainty and pushed up risk aversion. The market is still facing economic and inflation concerns brought about by tariffs, which will also weaken the dollar and support gold prices.
Analysis of gold trend: After the full-day trend of gold on Wednesday, the lowest price was 3282 and the highest price was 3322, with a range of $40, so the bullish strength has come out. However, Li Siyu would like to emphasize here that gold is in a bullish trend for the time being, but it is not an absolute unilateral trend, but a fluctuating trend under the bullish trend. There are opportunities both up and down on Thursday. If it rises, you can look at 3345, and if it falls, you can look at 3285. Therefore, before there is an absolute strong unilateral rise, it is recommended that everyone keep looking at this wave of gold fluctuations. However, today's market is more important. Today is Thursday, and Thursday is often the node of the weekly change time. Today is likely to continue the rebound on Wednesday and continue to rise.
From a technical point of view, the daily line closed positive under the rebound of 3282 and stood firmly above the lower Bollinger track. If it continues to close positive on Thursday, it is necessary to pay attention to the suppression of the middle Bollinger track, that is, the high point of 3345. After breaking through, there will be another wave of rise on Friday, and you can see 3365 and 3400. Therefore, today's gains and losses of 3345 are crucial. The strong rebound in the H4 cycle is quite obvious. When it falls, it is very weak and continuous. When it rises, it is very strong and continuous. It depends on whether the continuous positive trend on Thursday will continue. Now the K-line stands firmly on the middle track of Bollinger. If it continues to rise, the high point of the upper track is around 3340-3345. In principle, the continuation of the long position will test the high point of the upper track. Therefore, it is still possible to go long today. Of course, it is not an absolute long trend now, so don't chase the rise. The support below the small cycle is around 3310-3300. If it falls back to this price, you can continue to go long. Clearly define the target. Today, we will see the gains and losses of 3345.

Gold is in the Bearish DirectionHello Traders
In This Chart GOLD HOURLY Forex Forecast By FOREX PLANET
today Gold analysis 👆
🟢This Chart includes_ (GOLD market update)
🟢What is The Next Opportunity on GOLD Market
🟢how to Enter to the Valid Entry With Assurance Profit
This CHART is For Trader's that Want to Improve Their Technical Analysis Skills and Their Trading By Understanding How To Analyze The Market Using Multiple Timeframes and Understanding The Bigger Picture on the Charts

The GBPCAD is Unstoppable due to Strong Up TrendHello Traders
In This Chart GBPCAD HOURLY Forex Forecast By FOREX PLANET
today GBPCAD analysis 👆
🟢This Chart includes_ (GBPCAD market update)
🟢What is The Next Opportunity on GBPCAD Market
🟢how to Enter to the Valid Entry With Assurance Profit
This CHART is For Trader's that Want to Improve Their Technical Analysis Skills and Their Trading By Understanding How To Analyze The Market Using Multiple Timeframes and Understanding The Bigger Picture on the Chart

Gold is in the bullish direction after correcting the supportHello Traders
In This Chart GOLD HOURLY Forex Forecast By FOREX PLANET
today Gold analysis 👆
🟢This Chart includes_ (GOLD market update)
🟢What is The Next Opportunity on GOLD Market
🟢how to Enter to the Valid Entry With Assurance Profit
This CHART is For Trader's that Want to Improve Their Technical Analysis Skills and Their Trading By Understanding How To Analyze The Market Using Multiple Timeframes and Understanding The Bigger Picture on the Charts
