Gold shows signs of slowing down, are the bears ready?This wave of bullish pull-up is a complete rebound. With the help of the timeliness of fundamentals, the highest rebound only reached around 3330 and then began to fall. At this time, many people probably think that the short-term trend has begun to change. I still stick to my bearish thinking. The important target pressure is definitely around 3330. As long as this position is under pressure and falls back to 3280 again, it will be shaky. At present, the stop loss is based on the break of 3335. If it really breaks, it will be similar to the break of 3280. Even if 3340-3345 is short, it is also a short-term bull correction. If the falling channel is broken, I can't convince myself to continue to be short and stick to it. Once 3335 breaks, I can really confirm the reversal of the short-term trend. Then 3280 will also be the bottom of the medium term. In short, since I am shorting near 3320-3330 in the direction of the band and the short-term negative, I think that the stop loss will be given to 3335. The stop profit target is uncertain. The channel has not been broken. Now the short-term long and short conversions are frequent. It is definitely the best choice in my own trading system. No one will win all the time. It is too fake to win all the time. Make your moves according to your own ideas without regrets. If this wave of strategy verification fails, everyone is welcome to supervise. We dare to take responsibility and review every judgment.
Trend Lines

SPX500 Eyes New ATH – Key Levels in PlaySPX500 – Overview
The index remains under bullish pressure, with potential to record a new all-time high (ATH).
As long as the price holds above 6246, the bullish trend is likely to continue toward 6282.
A confirmed 1H close above 6287 could trigger further upside toward 6310 and 6341.
However, a break below 6223 would signal bearish momentum, opening the path toward 6195 and 6143.
Pivot Line: 6282
Resistance: 6310, 6341
Support: 6246, 6223, 6195

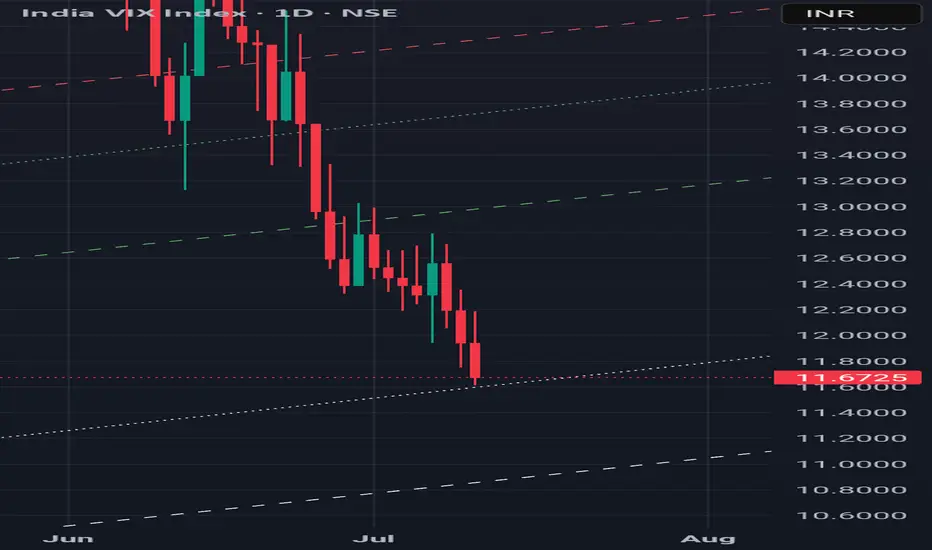
VIX will rise Indian market VIX low has done today now it will not fall more and from now on it will rise and nifty will fall down.
EURUSDSentiment: Bullish Bias
Institutions are holding a strong net long position on the Euro, with +107,537 contracts. This reflects continued bullish sentiment toward EUR, suggesting strength against the USD. With DXY showing net shorts and EUR net longs, EUR/USD may favor upside moves, especially from key daily demand zones. Swing traders should watch for bullish confirmations and structure shifts on 4H.

DOGE/USDT – Breakout Retest Long SetupDOGE has broken out of local consolidation with momentum and is now retesting the breakout zone, offering a clean long entry with defined invalidation.
Setup Thesis:
After a strong impulse move, price pulled back with low aggression, signaling profit-taking rather than reversal. The current candle structure suggests demand is stepping in at prior resistance-turned-support. This is a textbook breakout-retest continuation setup.
Trade Plan:
Entry: ~$0.1810
Stop Loss: Below ~$0.1764 (beneath breakout zone and structure)
Target: ~$0.1940
R/R: Favorable risk profile with strong reward potential
Confirmation Factors:
Impulsive breakout
Controlled pullback with no aggressive selling
Retest occurring at structural pivot
Still aligned with broader uptrend context
Execution Note:
This setup works best with strong follow-through in the next couple of candles. If price stalls or closes below the stop zone, it's invalidated.

AAVE Trend line BOAAVE has been respecting the trend line for few weeks and today it is rejected from the trend line after upmove. It will move either Up/Down from the lines.

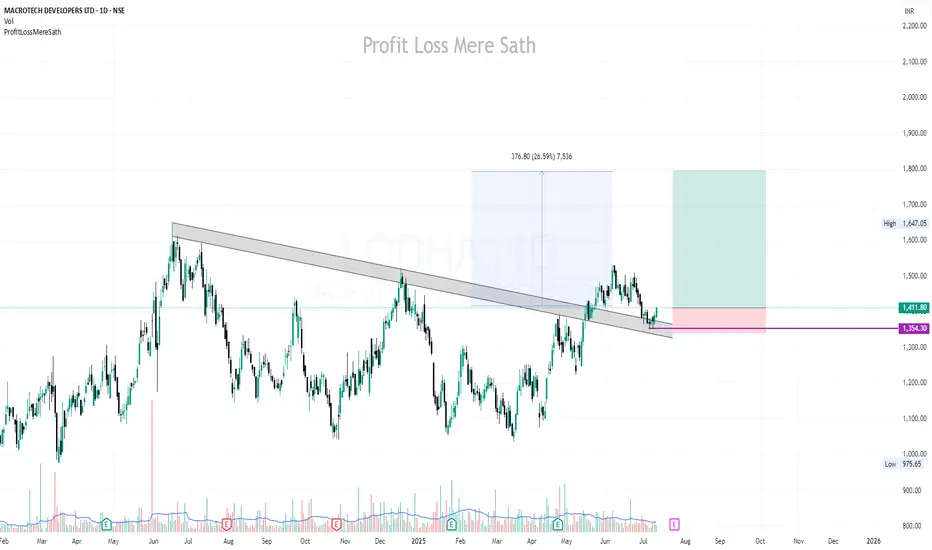
LODHA | Buy @LTP | Small SL below 1550 | Target 1800Disclaimer:
This is not financial advice. Please do your own research or consult with a financial advisor before making any investment decisions. Investments in stocks can be risky and may result in loss of capital.
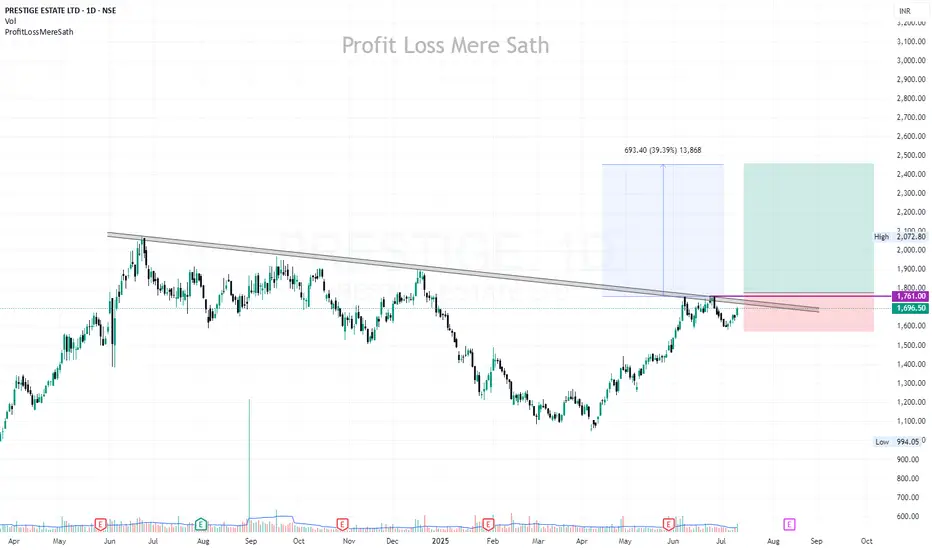
PRESTIGE | Buy above 1761 | SL below 1570 | Target 2460Disclaimer:
This is not financial advice. Please do your own research or consult with a financial advisor before making any investment decisions. Investments in stocks can be risky and may result in loss of capital.
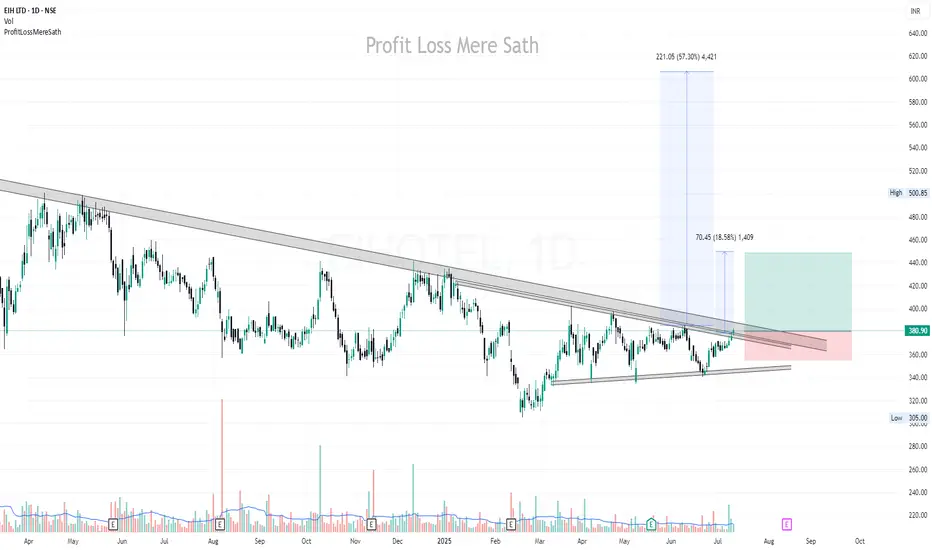
EIHOTEL | Buy @380 | SL below 355 | Targets 448, 490, 607Disclaimer:
This is not financial advice. Please do your own research or consult with a financial advisor before making any investment decisions. Investments in stocks can be risky and may result in loss of capital.
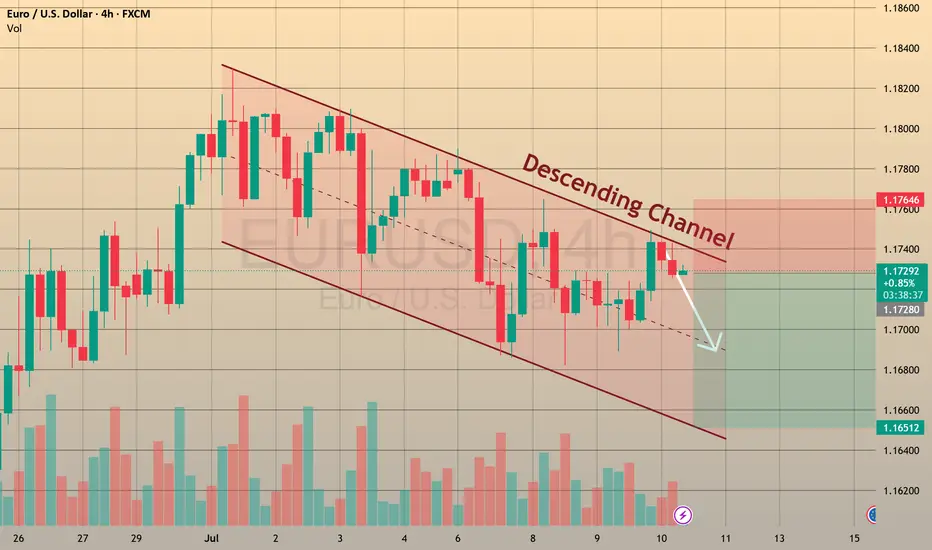
Thursday July 10th – EURUSDEURUSD didn’t give us any trade setups yesterday and is still respecting the short-term bearish trendline. Price has remained below 1.17500, acting as resistance, and hasn’t given confirmation for buys.
We’re still watching the same key zones:
✅ Safe buys: Above 1.17500 if we get a solid break and bullish close.
✅ HRHR buys: Retest of 1.16898 (Wednesday's low) showing rejection or support.
Until either of those levels are tapped, I’m not taking trades on this pair. Current structure still offers no low-risk opportunities. Let it come to us.

USDCAD – July 10 OutlookUSDCAD’s high-risk, high-reward (HRHR) sells from Wednesday are still in play with price currently up 35 pips. Price action remains within the structure as we continue to respect the March trendline, but are now stalling in a tight 4H range.
📍 Key Observations:
1.36647 is acting as strong intraday support
Possible retest of yesterday’s or Wednesday’s high could provide another HRHR sell opportunity
Break below 1.36527 could open the door for a clean 70-pip move toward 1.35827
🔔 Summary: Patience is essential—watching for either another short-term rejection at resistance or a clean structural break to continue the broader bearish bias.

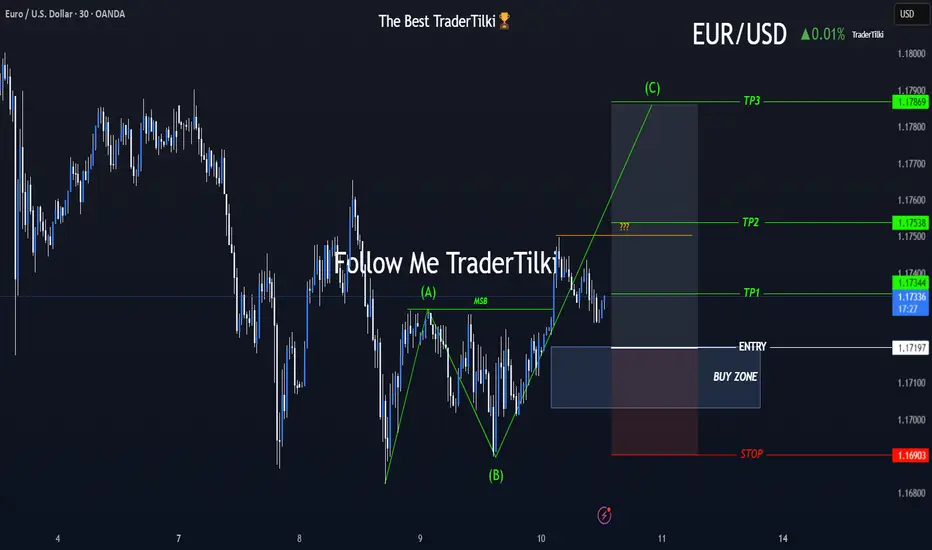
A New Chapter Begins with EURUSD’s ABC Wave Formation!🎯 Hey Guys,
I’ve prepared a fresh EURUSD analysis for you.
The market has shifted direction, and an ABC wave structure has emerged.
I’ve placed a Buy Limit order based on my entry level.
Below, you’ll find my detailed target zones and entry specifics:
🟩 Buy Limit Order: 1.17197
🟥 Stop Loss: 1.16903
📌 Targets:
🔹 TP1: 1.17344
🔹 TP2: 1.17538
🔹 TP3: 1.17869
📊 Risk/Reward Ratio: 2.27
Your likes and support are what keep me motivated to share these analyses consistently.
Huge thanks to everyone who shows love and appreciation! 🙏
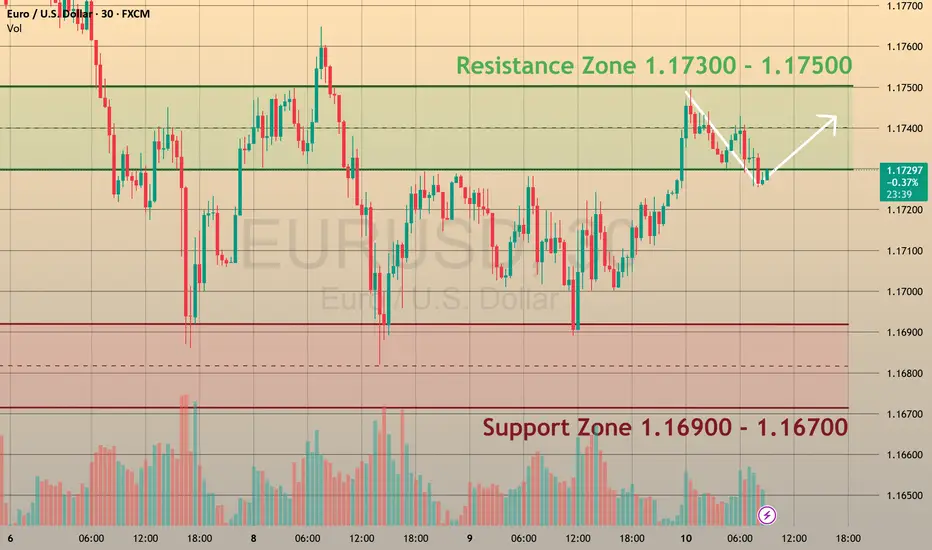
US Jobless Claims: Why They Matter for EURUSD 🇺🇸FOREXCOM:EURUSD
📈 US Jobless Claims: Why They Matter for EURUSD 🇺🇸💼
While Trump’s tariff policies ⚔️ remain in focus, it’s important not to overlook today’s economic calendar 🗓️, with Initial Jobless Claims taking the spotlight.
🧐 What are Jobless Claims?
Initial Jobless Claims 📑 measure the number of people filing for state unemployment insurance for the first time. Released weekly by the US Department of Labor 🏛️, it’s a key indicator of the health of the US labor market 💪.
Why does it matter?
A strong labor market typically supports the US dollar 💵, as it reduces the likelihood of immediate Fed rate cuts 🕰️, while higher claims suggest a weakening economy, which could pressure the dollar lower.
📊 Latest Figures:
🔹 Previous: 233K
🔹 Forecast: 235K
Last week, claims fell from 237K to 233K, highlighting continued labor market resilience. If today’s data beats expectations (lower claims), the USD may strengthen 🛡️, potentially pushing EURUSD below 1.1700. Conversely, higher claims could weaken the USD ⚠️, lifting EURUSD above 1.1800.
💡 Trade Idea:
BUY EURUSD at 1.17300
❌ Stop Loss: 1.17600
✅ Take Profit: 1.16500
While the US labor market remains strong, technical factors and broader fundamentals can confirm a strong EURUSD reversal, keeping bearish opportunities in play.
🚀 Stay tuned for live reactions after the data drops!
💬 Support this post if you find it useful! 🔔
EURUSD Eyes Key Levels Ahead of DataFOREXCOM:EURUSD
EURUSD is trading within the 1.1680 – 1.1810 range 📊, continuing its upward momentum during the Asian and early European sessions 🌏⬆️.
⚡️ Markets are now focusing on potential trade negotiations with India and the EU 🤝, which could shape near-term currency moves and risk sentiment 🌐.
📈 Today at 12:30 p.m. UTC 🕧, the U.S. Jobless Claims report 📑 may trigger volatility across all USD pairs ⚠️. Stronger-than-expected data could delay Fed rate cuts 🕰️🔻 and push EURUSD below 1.1700 🩻, while weaker figures may weigh on the U.S. dollar 💵⬇️ and lift EURUSD above 1.1800 🚀.
👀 We will monitor these levels closely for potential breakout opportunities. Stay tuned for live updates!
Gold Extends Gains Amid Uncertainty FOREXCOM:XAUUSD
XAUUSD is currently moving within the $3,270 – $3,360 range 📈, holding steady under buying pressure over the last few hours ⏳.
🌏 During today’s Asian and early European sessions, gold climbed to around $3,330 🥇, extending gains as investors monitored trade tensions and absorbed the latest FOMC Minutes 🗂️. A weaker U.S. dollar 💵⬇️ continues to support gold, attracting safe-haven flows 🛡️ amid ongoing market uncertainty.
📊 Meanwhile, the Fed’s June meeting minutes 🪙 revealed disagreements among officials 🤔 on the timing and scale of potential rate cuts 🔻. While most anticipate some easing later this year, views range from cuts as early as July to no cuts until year-end. The Fed maintains a cautious, data-driven approach 🧭, citing tariff-related inflation risks, slowing consumer spending, and a strong labour market as key factors for their policy outlook.
👀 We will continue to monitor gold closely for potential breakout or reversal signals within this range. Stay tuned for updates!

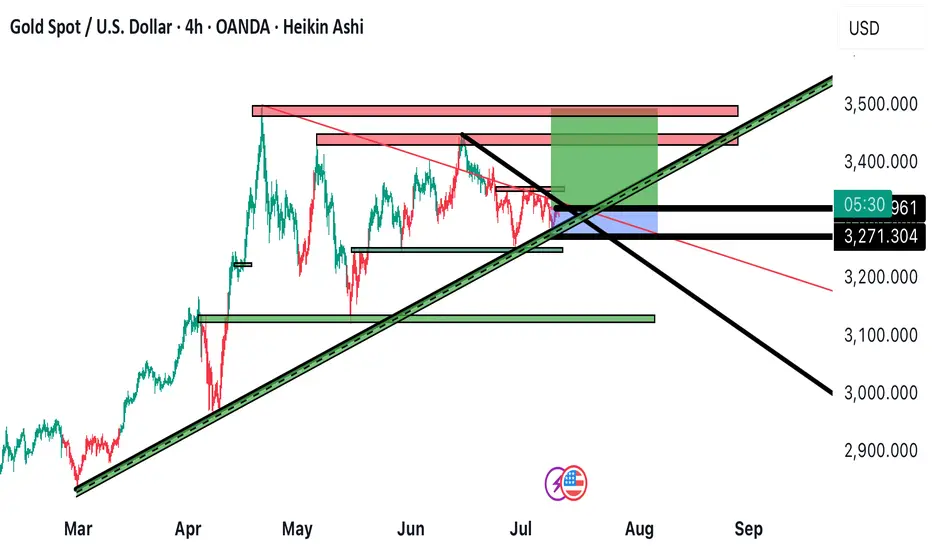
Investment Analysis of a Long Gold/Dollar Trade: Entry and Exit Analysis of the Buying Position on Gold Against the Dollar:
Entry and Exit Points:
- Entry Price: 3325
- Targets:
- TP1: 3350
- TP2: 3370
- TP3: 3400
- Stop Loss (SL): 3270
Technical Analysis:
1. Trend Lines:
- Uptrend Line (Green): Indicates the general upward trend of the market, enhancing the chances of success for the trade.
- Downtrend Line (Black): Represents the resistance that the price may encounter. If this line is broken, there could be additional upward momentum.
2. Support and Resistance:
- Supports (Green): Provide a protective level for the trade, where the price can bounce back.
- Resistances (Red): Represent obstacles that need to be overcome to reach the specified targets.
Trading Strategy:
- Entry: Made at 3325, which is close to the support level, providing a good opportunity for price rebound.
- Stop Loss: Adhering to a stop loss at 3270 is necessary to minimize risks in case of market reversal.
- Targets:
- TP1: A near level that could be easily reached if the upward trend continues.
- TP2 and TP3: Higher levels requiring a breakout of resistances and a strong upward momentum.
Recommendations:
- Monitoring: Keep an eye on price movement around trend lines and resistances.
- Financial Management: Stick to the stop loss and target plan to achieve the best possible returns while minimizing risks.
The trade appears positive under current conditions and relies on the continuation of the upward trend and the breaking of specified resistances.
GOLD (XAUUSD): Important Decision Ahead
As I predicted, Gold went up from a trend line yesterday.
The price is now testing another trend line - a falling resistance
of a bullish flag pattern.
The next reliable bullish signal that you can look for is its
bullish breakout and a daily candle close above that.
A bullish move is going to follow then.
❤️Please, support my work with like, thank you!❤️
I am part of Trade Nation's Influencer program and receive a monthly fee for using their TradingView charts in my analysis.

XRPUSDT BINANCE:XRPUSDT Price broke above the downtrend line but faced resistance at 2.2770 dollars and started correcting. Key supports are at 2.1900 and 2.0800 dollars. If it bounces, resistances to watch are 2.2770, 2.3600, and 2.4620 dollars. Price is currently between key levels.
Key Levels:
Support: 2.1900 – 2.0800
Resistance: 2.2770 – 2.3600 – 2.4620
⚠️Contorl Risk management for trades.

XRPUSDT → Resistance ahead. Correction before growthBINANCE:XRPUSDT is rising after breaking through consolidation resistance. Bitcoin's rally supported the overall market momentum, but a new resistance zone lies ahead...
Bitcoin is testing its ATH and updating it, but is facing pressure and forming a false breakout. A correction in the flagship coin could trigger a correction in XRP, but if Bitcoin continues to storm the 112K area without a pullback, followed by a breakout, the market could find support and continue to rise.
After XRP broke through resistance, the coin entered a distribution phase and is testing an important resistance zone of 2.4488 - 2.4772. The inability to continue growth, a false breakout, and price consolidation in the selling zone could trigger a correction.
Resistance levels: 2.4488, 2.4772, 2.6524
Support levels: 2.3587, 2.3375, 2.2455
Despite breaking through resistance, XRP is still in a local downtrend. Pressure on the market is still present. The formation of a false breakout will indicate that growth is limited for now. However, if the price consolidates above 2.4772 and begins to break out of the local structure, we can expect growth to continue.
Best regards, R. Linda!

Gold continues to short
Life is like a thread. As long as today continues and as long as there is hope for tomorrow, we will always be at the starting point and on the road to running. Don't be afraid of the long road, don't complain about the lack of scenery on the roadside, don't despair at any time, just keep running, the bumps under your feet are the cornerstones of our life, and perhaps the turning point is just around the next corner!
Gold, on the eve of the US market yesterday, the shorts repeatedly touched the lower support of 3282, but ultimately lacked the momentum to make a final push, which led to a reverse reversal in the US market and a continuous rebound effect. As of the morning of the day, the highest reached near 3326, and the daily line also closed at the bald small positive line of the lower lead. The current upper pressure is maintained at the previous 3330 line. This position will also be related to the continuity of the long and short positions in the later period, and the highest in the morning will also be maintained near this position. For the European market, this position is even more important. Once it continues to break through, the US market will likely continue to rise, and it can also be used as the position of the long and short watershed in the short term, and the recent trend continuity is extremely high. , most of them are maintained in the range of shock operation, and the support below will be maintained at 3310, which is also the key defensive point of the European session. Although the daily line is currently closed at a small positive line, it is still obviously insufficient in power, and the multi-hour line is also maintained in the downward channel without a breakthrough. In the short term, it is still in a bearish situation overall. If there is no breakthrough for a long time, it may continue to fall in the later period. If gold rebounds near the morning high, it can continue to short. If the European session breaks through strongly, it needs to adjust its direction before the US session. If gold rebounds near 3325-26, it can be shorted. The target is around 3310-00, and the loss is 3335!
Gold rebounds near 3325-26 during the day, and the target is around 3310-00, and the loss is 3335.

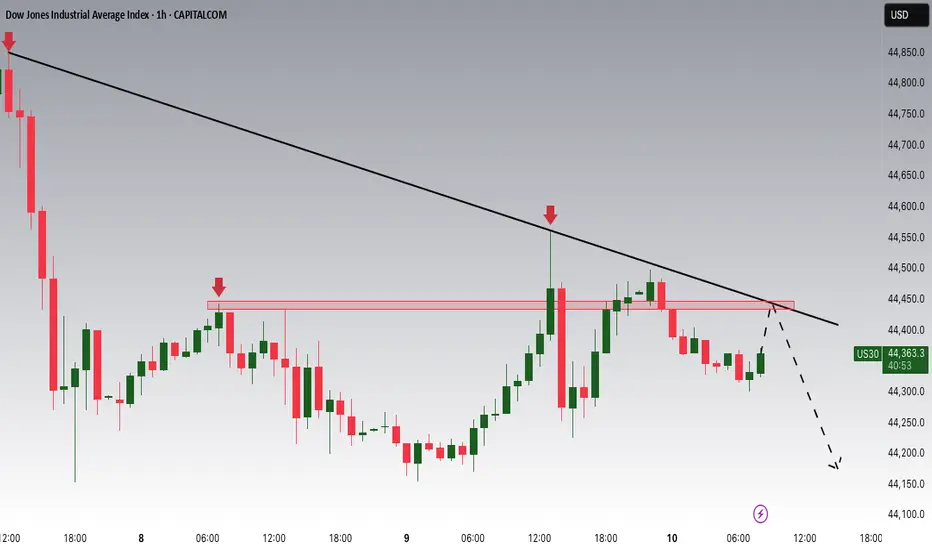
Dow Jones Potential DownsidesHey Traders, in today's trading session we are monitoring US30 for a selling opportunity around 44,450 zone. Dow Jones is trading in a downtrend and currently is in a correction phase in which it is approaching the trend at 44,450 support and resistance area.
Trade safe, Joe.

AUDUSD: Bullish Accumulation?!Quick update for ⚠️AUDUSD:
The price formed a classic bullish pattern on a 4-hour chart known as the ascending triangle, indicating bullish accumulation and a likely upward movement.
To confirm this, we will adhere to the previously discussed plan, waiting for a breakout above 0.6560 and a 4-hour candle close above that level, which could lead to a potential rise to 0.6586.
Conversely, a bearish breakout below the triangle's trend line would signal a strong downward movement.
