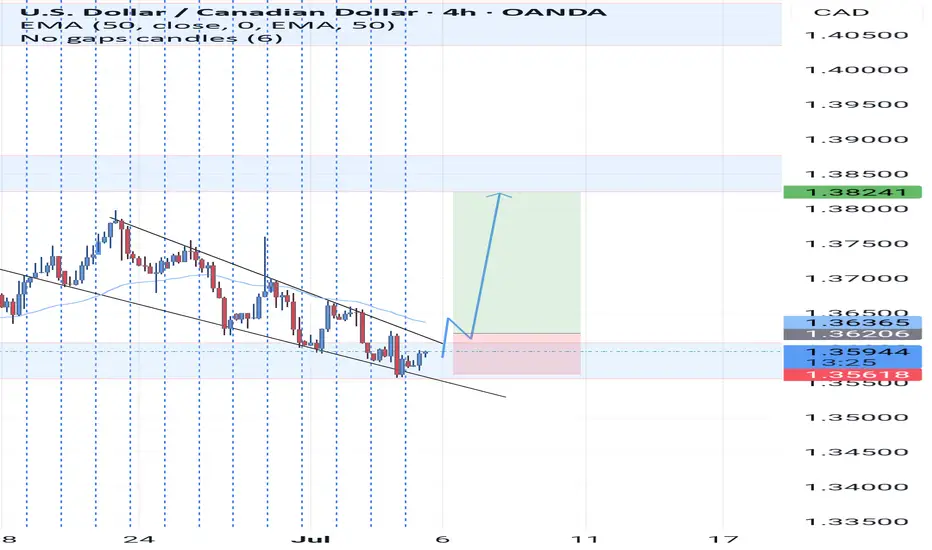
Usdcad Usdcad as we can see is on a uptrend we hv 1d 1w on a uptrend and we are expecting a break and a retest on the 4hrs den we buy but this trade is a high probability trade
Trend Lines
BTCUSDBTCUSD | Quiet Market Play – Conditional | Trade Based On Bearish Candle Closure
After a sharp upward move, price is now losing momentum and consolidating.
Currently entering a short position after breaking the resistance
Trade includes full risk management, marked on chart. 🔴📉

H | Pushing for New HighsHumanity Protocol demonstrates exceptional bullish momentum. The bullish trajectory suggests this AI-related token could benefit from renewed sector interest.
Key Technical Signals:
Price trading well above the ascending trendline, indicating sustained bullish momentum
Clean breakout above horizontal resistance with strong volume confirmation
Trading Opportunity:
Entry: Current levels or on a slight pullback
Target: $0.136 (2x trading range extension with 40%+ upside potential)
Stop Loss: Below $0.075 to protect against trendline breakdown

Trading Recommendations and Analysis for USDJPYThe technical picture on Monday may shape future developments in the medium term. The week began a gap up, followed by the formation of a long upper shadow. The daily close occurred exactly at the support level of 146.11 thereby closing the gap.
Today's trading also opened exactly at the same level, and the candle is already black in the early hours of trading. This defines Monday's movement as false, thus creating a strong bearish signal, with a potential breakdown of the 143.45 support and a subsequent decline toward the MACD line, which coincides with the target level of 141.70. The Marlin oscillator has turned downward. its return to negative territory will add additional pressure on the price.
In the H4 timeframe, the price has consolidated below the 146.11 level, making it easier to settle below the MACD line eventually.
A break below 145.48 -the June 11 high-will serve as confirmation. The Marlin oscillator appears to be fixed in bearish territory and has joined the new downward movement.

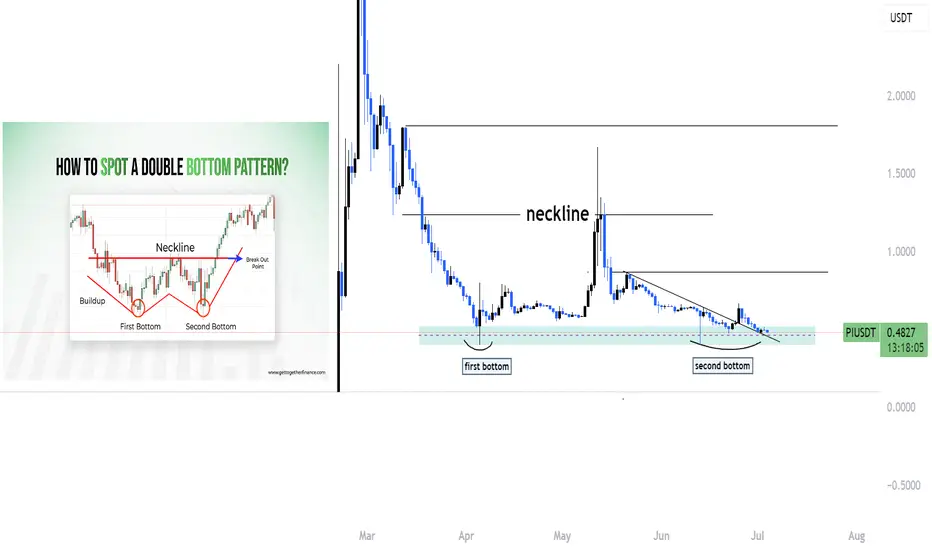
Piusdt making double bottom ??Hello traders, I hope you're all doing well!
Currently, we're seeing an interesting setup on PI that could lead to a potential bullish move. Let's break it down:
🔹 Double Bottom Formation
PI appears to be forming a double bottom on the higher time frame — a classic bullish reversal pattern. This indicates that the market has tested a key support level twice and failed to break lower, which often suggests that selling pressure is weakening.
🔹 Trendline Breakout
In addition to the double bottom, we’ve also broken out of a descending trendline that has been acting as dynamic resistance for some time. A clean breakout with volume often signals a shift in market structure from bearish to bullish.
🔹 Strong Support Zone & Liquidity
We are still holding above a strong support zone, where previous demand has stepped in. This area has likely accumulated a lot of liquidity, with stop-losses from retail traders sitting just below. If price holds this level, it may trap sellers and trigger a short squeeze, pushing the price higher.
🔹 Possible Upside Move
As long as we remain above this support and confirmation continues, there is a high probability of an upward continuation. This could be the start of a bullish leg, especially if we see a break of recent highs with strength.
📈 Conclusion
This confluence of technical signals — double bottom, trendline breakout, and liquidity resting below support — gives us a strong reason to watch this setup closely.
👉 Like and follow if you’re seeing the same structure or planning to trade this move. Let’s ride it together!
USNAS100 Key Level: 22,740 – Will the Trend Continue or Reverse?USNAS100 Update – Bullish Momentum Holds Above 22,740
USNAS100 has continued to push higher, following through as expected from yesterday’s analysis.
The index maintains bullish momentum as long as it trades above the key pivot at 22,740.
However, a 1H close below 22,730 could trigger a bearish correction toward 22,615.
A sustained break below that level may shift the trend to bearish.
Key Levels:
• Resistance: 22,870 / 23,000
• Support: 22,615 / 22,410

SPX500 Holds Above 6,225 – Bullish Trend Intact for NowSPX500 Update – Bullish Pressure Holds Above Pivot
SPX500 continues to show bullish momentum, as highlighted in our previous analysis. The price remains supported by strong buying volume above the key pivot zone at 6,225.
As long as the price stays above this level, a retest toward 6,225 remains possible before another leg higher.
However, a confirmed break below 6,225 would signal potential bearish momentum and shift the short-term structure.
Key Levels:
• Pivot Line: 6,246
• Resistance: 6,265 / 6,287 / 6,325
• Support: 6,225 / 6,191 / 6,143

BTC Bulls Target $111,653, Is This the Next Explosive BreakoutThe BTCUSDT 4-hour chart is showing a clearly bullish structure. After consolidating below the $108,664–$107,800 resistance for several weeks, Bitcoin finally broke above this area with a strong impulsive move, confirming the zone as a new support. This breakout coincides with improving market sentiment, especially after Metaplanet’s $108 million purchase of BTC and a surge in ETF inflows, which have been helping Bitcoin reclaim levels above $109,000. The price is currently consolidating just above the breakout area, indicating that buyers are defending this zone aggressively.
Resistance Level 1, around $110,254, is the first significant barrier and aligns with the area that rejected price several times in late May. If this level is broken, the next target sits at Resistance Level 2 near $111,653, which was the major swing high established in early May. Holding above the current support is critical, as a decisive 4-hour close below $107,440 would invalidate this bullish scenario and likely trigger a deeper retracement.
The recent price behavior suggests a potential ascending triangle breakout retest, a classic continuation pattern where buyers step in on each dip. Momentum remains strong, and the risk/reward profile favors long setups as long as the higher-low structure is preserved.
Trade Setup (Bullish Idea)
Entry Zone: $108,700–$109,000 (on a confirmed retest of support)
Stop Loss: $107,440 (beneath the invalidation zone)
Take Profit Targets
o TP1: $110,254
o TP2: $111,653
The setup offers an estimated 2.4–2.7 risk/reward ratio, depending on precise entry and execution. As always, it’s recommended to wait for confirmation candles or wicks rejecting the support zone before entering.
If the breakout holds and volume expands on the push through TP1, Bitcoin could quickly revisit the $112,000 area in line with broader market optimism and institutional buying. Just be aware of the invalidation level, as any breakdown below $107,440 could trigger a fast move back to prior range lows.

Maintain range fluctuations during the day?Gold has maintained a volatile pattern recently. As the US market is closed today for Independence Day, the market volatility is expected to be limited, but the volatile market will continue, but the volatility range may change. Yesterday's gold price fell mainly due to the news, and this decline usually does not last too long. From a technical point of view, gold prices are supported near 3310-3300, which is the key support level today. It is worth noting that on Wednesday, gold prices were under pressure in the 3340-3350 area, and on Thursday, prices formed support in this range, indicating that the area is forming a top-bottom conversion. Therefore, 3340-3350 has become an important pressure level today. It is expected to fluctuate in the 3300-3340/3350 range during the day. The impact of news on gold prices is usually short-term. When the fundamentals and technical directions are consistent, price fluctuations will be more obvious. When the two are inconsistent, price fluctuations will weaken, but will not change the technical trend. The rebound pattern established at the beginning of the week is still valid. After a short-term shock, gold prices are expected to re-stand above 3345 and continue to maintain the rebound trend.

U.S. stocks are closed, how to operate gold volatility📰 News information:
1. Geopolitical situation
2. Tariff implementation and interest rate cut bill
📈 Technical Analysis:
Gold has maintained a volatile pattern recently, lacking a sustained unilateral trend. The unclear short-term direction of DXY has limited the volatility of gold. The market has repeatedly shown a mixture of high-rise decline and downward recovery. It is unable to effectively break through the previous high and lacks the momentum to break downward. The short-term pressure during the day is concentrated on the 3340-3345 line, and the upper middle track is at 3350. If it fails to effectively break above 3350, then gold may fall further. On the contrary, if it can stand above the middle track 33350, then gold may rise further. The short-term support below is near the 3323 line. If it fluctuates during the day, maintain a high-altitude low-multiple cycle.
🎯 Trading Points:
SELL 3340-3350
TP 3330-3320-3310
BUY 3320-3310
TP 3340-3350
In addition to investment, life also includes poetry, distant places, and Allen. Facing the market is actually facing yourself, correcting your shortcomings, confronting your mistakes, and strictly disciplining yourself. I hope my analysis can help you🌐.
FXOPEN:XAUUSD PEPPERSTONE:XAUUSD FOREXCOM:XAUUSD FX:XAUUSD OANDA:XAUUSD TVC:GOLD

Gold Breakout and Potential RetraceHey Traders, in today's trading session we are monitoring XAUUSD for a selling opportunity around 3,350 zone, Gold was trading in an uptrend and successfully managed to break it out. Currently is in a correction phase in which it is approaching the retrace area at 3,350 support and resistance zone.
Trade safe, Joe.

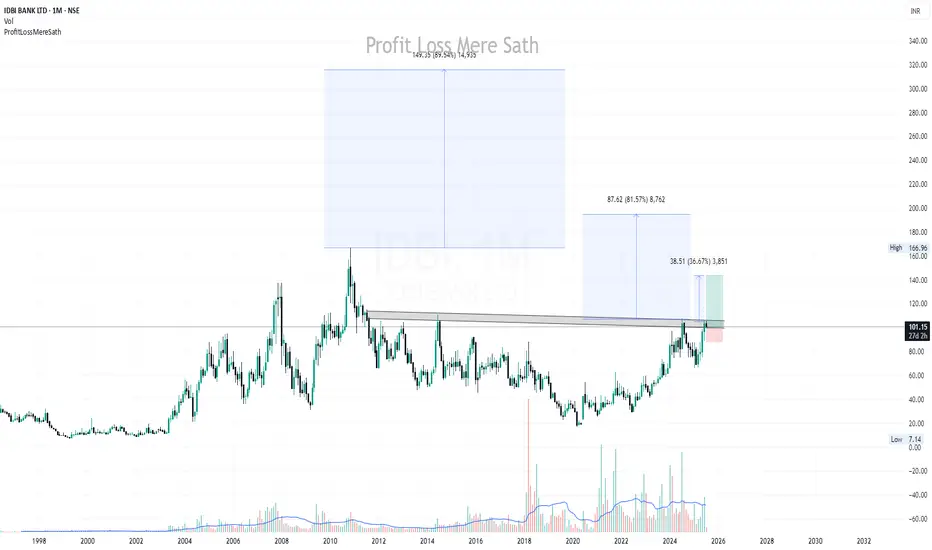
IDBI BANK LTD - for Long-Term🚀 Breakout Alert!
IDBI Bank has finally broken out of a multi-year resistance zone that was acting as a strong supply area since 2010. The breakout is supported by significant volume, indicating strong institutional participation.
🟩 Structure Highlights:
Price has broken above the long-term horizontal resistance trendline (marked in grey).
Monthly candle shows solid strength despite some profit booking from ₹105 levels.
Volume spike suggests buyer confidence.
📈 Potential Upside Targets:
Target 1: ₹140 (≈36.67%)
Target 2: ₹185 (≈81.57%)
Target 3: ₹250+ (≈149.35%) in the longer term, replicating past breakout moves.
📉 Support Zone: ₹88–95 (former resistance turned support). Any retest around this zone can offer good risk-reward entry.
📌 Conclusion:
This breakout marks the end of a decade-long consolidation. As long as the price holds above ₹88 on a monthly closing basis, the uptrend looks intact. Ideal for positional swing traders and long-term investors watching for multi-bagger potential.
MarketBreakdown | USDJPY, USDCAD, BITCOIN, SILVER
Here are the updates & outlook for multiple instruments in my watch list.
1️⃣ #USDJPY daily time frame 🇺🇸🇯🇵
The market nicely respected a rising trend line
and bounced from that, forming a high momentum bullish candle.
I think that the pair will continue rising and reach 145.8 level soon.
2️⃣ #USDCAD daily time frame 🇺🇸🇨🇦
The price is currently approaching an important confluence
zone based on a falling trend line and a horizontal support.
I will expect a pullback from that.
3️⃣ #BITCOIN #BTCUSD daily time frame
The price successfully violated a resistance line of a bullish
flag pattern and closed above that.
It is a critical bullish signal. I believe that the price will test
a current high then and will violate that with a high probability.
4️⃣ #SILVER #XAGUSD daily time frame 🪙
The market broke a resistance line of a bullish flag.
Uptrend is going to continue, and the price is going to reach 37,14 level soon.
Do you agree with my market breakdown?
❤️Please, support my work with like, thank you!❤️
I am part of Trade Nation's Influencer program and receive a monthly fee for using their TradingView charts in my analysis.

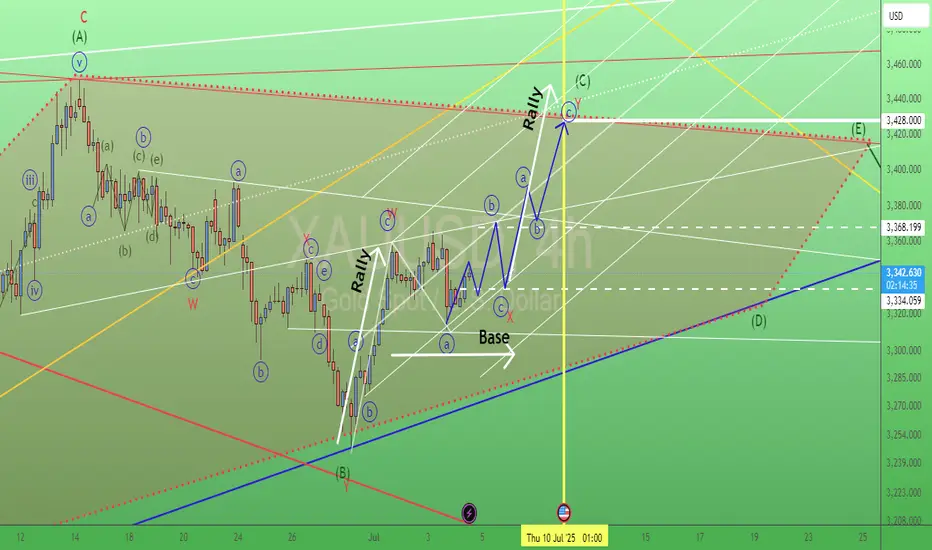
Gold. Swing trade setup. 4/July/25XAUUSD,. based on how the "speed" of chart "touching" those trendline (white). Gold probably having a ( abc (blue circled) running flat waves) "base" before "rallying" toward 3428 +/-...
Is the hat back on?Bullish scenerio for BINANCE:WIFUSDT
Recently we can see:
1. Bouncing off GP (0.5)
2. Retested local TL
3. Retested local support (S/R)
4. Broke 50 RSI
Reaching 1.37 resistance would print a cup and handle pattern…

SHIBUSDT🕯 The key resistance level, identified as the best resistance for a break and pump, stands at 0.0000135, with a potential price increase to 0.00001567 if breached, serving as the next target (Pullback level). On the support side, the main level is observed at 0.0000115, and should the price fall below this, it may decline further to the lower Major Level of 0.0000100.
🔽 Resistances:
Main resistance level: 0.0000135 (potential break for pump)
Next target (Pullback level): 0.00001567
🔼 Supports:
Main support level: 0.0000115
Lower level (Major Level): 0.0000100
⚠️Contorl Risk management for trades.

AVAXUSDTWe are bear-trend but wait for break trendline and pollback to 18.50$.
BINANCE:AVAXUSDT
Support: 16.90
Resistance: 18.50 - 21.30 - 25.50
⚠️Control money management.

GOLD → Consolidation after a trend break...FX:XAUUSD , after breaking out of a downtrend, is consolidating, which may continue for some time due to Thursday's news and low liquidity on Friday.
Gold stabilized after a correction, but volatility risks remain. After falling from a weekly high of $3,366, gold prices found demand again in Asia on Friday. Strong US employment data cooled expectations of an imminent Fed rate cut, which supported the dollar and limited gold's gains. Additional pressure is coming from the hawkish shift in Fed expectations, but US budget risks and weak liquidity due to the holidays could increase price volatility in the coming days.
Technically, the focus is on the boundaries of the current consolidation at 3311 and 3357. In addition, within the range there is an important level of 3325, which divides the market into bearish and bullish zones...
Resistance levels: 3350, 3357, 3393
Support levels: 3325, 3311
It is important to understand the situation: due to the holiday in the US, liquidity is lower, making it easier to move the price. The rest of the world, interested in gold, can easily push the price up. The trigger will be the zone 3350 - 3350. There is a chance that the market will try to break through the resistance without a pullback and continue to rise to 3393.
However, the most likely scenario is that after yesterday's volatility, gold will remain within 3325 - 3357 before rising next week
Best regards, R. Linda!

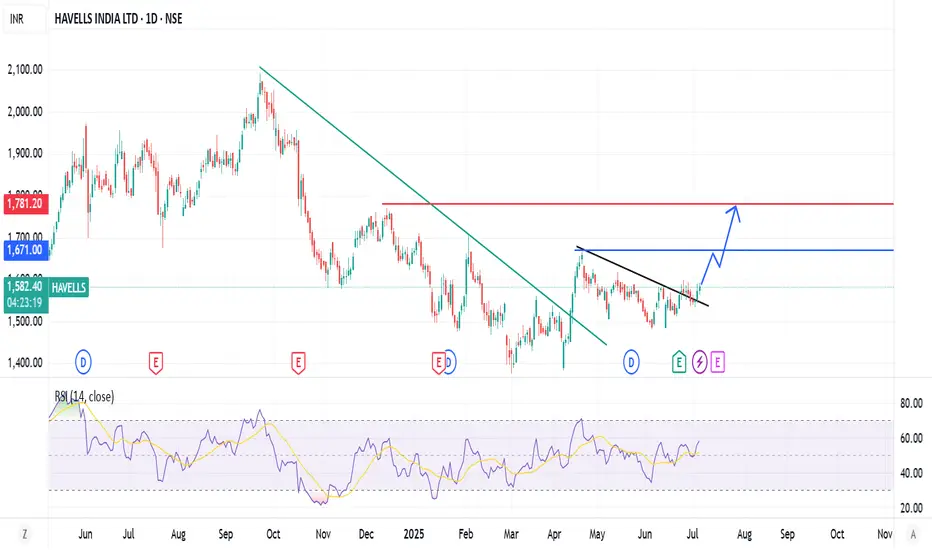
havells shows bullish pattern havells in good formation looks good on chart , down pattern broke and ready for uptrend
GBPCAD → Retest the area of interest before growthFX:GBPCAD is closing the imbalance area as part of a countertrend correction and consolidating below the 0.5 Fibonacci level. What's next, growth or decline?
The global trend is upward, and the situation is classic: the market needs energy and liquidity to continue growing.
Locally, we see that as part of a countertrend correction, the market is closing the imbalance area, but at the same time forming consolidation below 0.5 Fibonacci, still leaving the zone of interest and order block below 1.84600 untouched.
Technically, there is a fairly high probability of continued growth, provided that the price ends its consolidation with a breakout of the 1.85690 resistance and consolidates above 0.5 Fibonacci.
Resistance levels: 1.85690, 1.8657
Support levels: 1.84986, 1.846, 1.8417
However, as an additional and, in my opinion, the most important scenario, I still consider a complete closure of the fvg and a retest of the 0.7-0.79 zone, within which the order block is located. A false breakdown of the zone of interest and the capture of liquidity could attract additional interest, which would trigger growth.
Best regards, R. Linda!

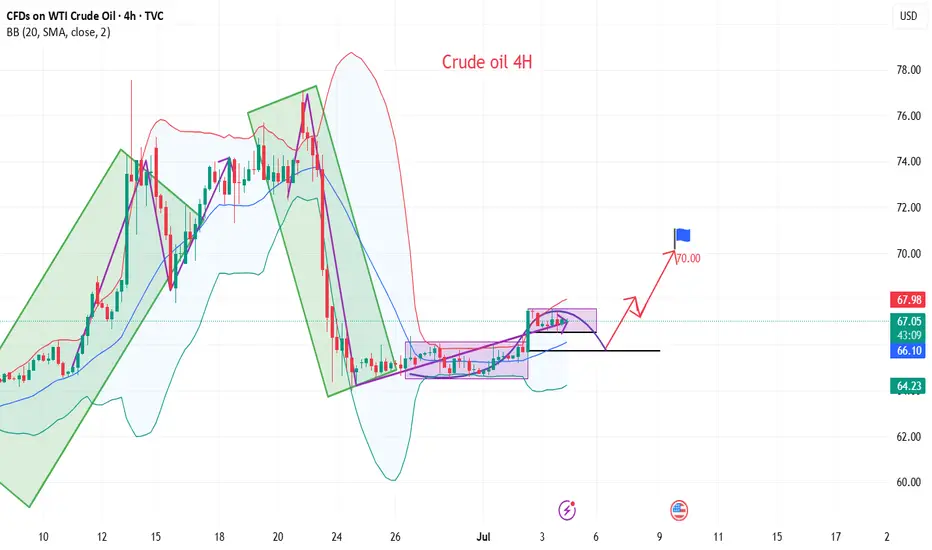
Crude oil moves up alternately during the day
💡Message Strategy
WTI crude oil prices snapped a three-day winning streak and were trading around $66.00 a barrel in early European trading Thursday. Crude oil prices fell as rising U.S. crude inventories heightened concerns about weak demand in the United States, the world's largest oil consumer.
📊Technical aspects
From the daily chart level, crude oil fluctuates upward in the medium term and tests around 78. The K-line closes with a large real negative line, which has not yet destroyed the moving average system and is still supported. The medium-term objective upward trend remains unchanged.
However, from the perspective of momentum, the MACD indicator crosses downward above the zero axis, indicating that the bullish momentum is weakening. It is expected that the medium-term trend of crude oil will fall into a high-level oscillation pattern.
The short-term trend of crude oil (4H) fluctuated and consolidated for two trading days. The oil price repeatedly crossed the moving average system, and the objective trend direction fluctuated. From the perspective of the primary and secondary rhythms, the current rhythm is a secondary oscillation rhythm. According to the law of primary and secondary alternation, the subjective trend still maintains an upward direction. In terms of momentum, there are signs of weakening upward momentum, and it is expected that the crude oil trend will continue to be mainly upward.
💰Strategy Package
Long Position:65.50-66.00,SL:64.50,Target:69.00-70.00
Cookieusdt trading opportunityCOOKIEUSDT has broken down from its rising channel and is now heading toward a potential reversal zone. If price finds support and reacts positively from this area, a move toward the important supply zone is expected. A confirmed breakout above this supply zone would open the path toward the projected final target, as outlined on the chart.

Setups don't get a lot better than this for me - long at 107.83I'll start with BJ itself. Historically, it is top 50 in my universe of over 2000 stocks in terms of per day returns on trades, at .257% (6x the market avg per day). Its record is perfect at 189-0 with an average return of 1.8% in 7 days. The new filter I recently added, however, bumps that per day held return up to .363% (around 90% annualized).
On top of that, it currently sits RIGHT ON a double bottom support (almost triple bottom) that is reinforced by the previous high, and KISSED, but did not break, its 1 year regression channel before rebounding intraday. It is a stock respecting its technical support here.
That said, there are no guarantees in trading, and I've had plenty of similar stocks tank on me in similar situations, but trading is about playing the odds. And while I may face a bad beat, good traders play the odds and they are decidedly in my favor here.
The exit target is not fixed, but I will not be using FPC close unless the return is outlandish or protracted. I think you've all seen enough of my trades to know what I'm expecting, though - a profit above the average daily return of the market. Just a side note, FPC CAN be used. It isn't broken, and fairly frequently outperforms what I'm doing now on a per day held basis. I'm just looking for a little bit fatter win. The risk there, though, is a longer holding period. Sometimes a lot longer. Nothing in the market comes for free, and that's the tradeoff.
As always - this is intended as "edutainment" and my perspective on what I am or would be doing, not a recommendation for you to buy or sell. Act accordingly and invest at your own risk. DYOR and only make investments that make good financial sense for you in your current situation.
