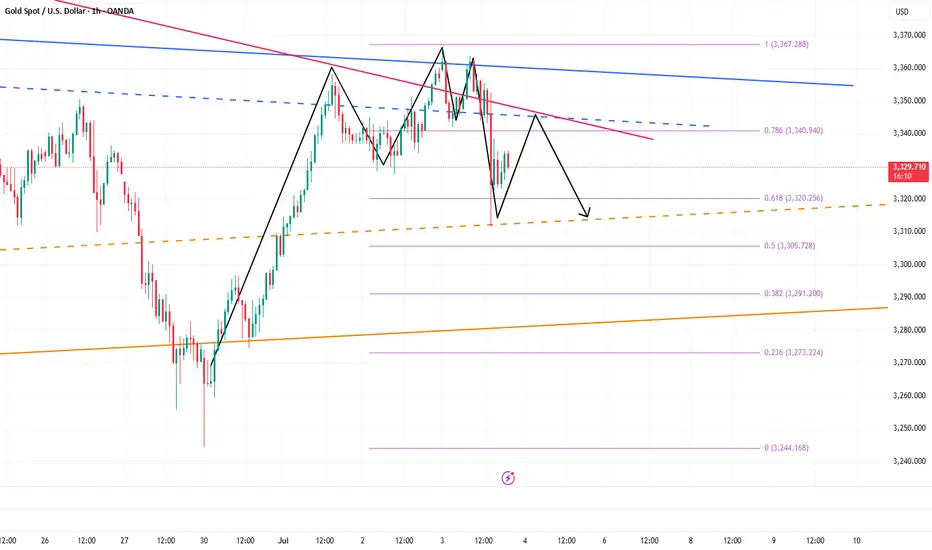
Firmly bearish below 3350 once again verifies the perfect idea!Gold price rose rapidly at the opening, reaching a high of 3342 before falling back. This kind of rapid pull needs special attention, because from the perspective of short-term trading, this is the trend pattern that needs the most vigilance. Looking back at the trend last Thursday, there was also a situation where the high could not be continued. Historical data shows that this kind of pull-up often lacks sustained momentum, and the subsequent upward space is limited. Combined with the recent trend, although the price rebounded on Monday and Tuesday, it basically maintained a volatile pattern in the following trading days, but the fluctuation range changed. Therefore, the market expects the trend to be repeated in stages, and the information of long and short interweaving makes it difficult for the market trend to continue. Today, the short position digested the second time at the opening and currently stepped back to the lowest 3305 line. In terms of operation, we first pay attention to the situation of 3303-3293. If the support below is broken today, then the market will reverse to the short position. Otherwise, we will continue to rebound from the bottom and look for opportunities to do more.
From the current gold trend analysis, the support line of 3303-3293 is concerned below, the short-term resistance above is concerned about 3325-3330, and the suppression line of 3345-50 is focused on. The overall main tone of high-altitude low-multiple cycle participation remains unchanged. In the mid-line position, keep watching and do less, follow orders cautiously, and wait for the opportunity to enter the market after the key points are in place.
Gold operation strategy:
1. Go long near 3293-3303 for gold, and the target is 3315-3320.
2. Go short near 3320-3330 for gold, and the target is 3310-3300.
Trend Lines

USDCHF: Bullish Outlook ExplainedLast week, the 📈USDCHF price reached a significant ascending trend line on the 4-hour chart.
Despite the market consolidating within a horizontal range for a while, the contact with the trend line propelled the pair upward.
The market subsequently broke and closed above the range's resistance.
I anticipate that the pair will continue to rise, reaching at least 0.7997.

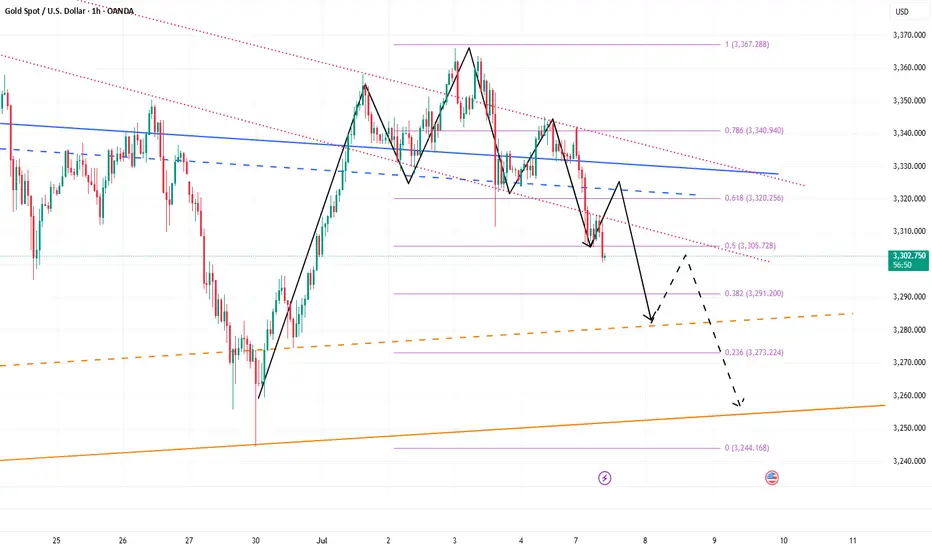
Gold shorts may continue to 3280 or even 3255Gold started to fall from around 3342 in the Asian session, and currently hit a low of around 3305. This is completely consistent with my prediction: "Before gold stabilizes at 3340, it is still in a short trend. Gold shorts may counterattack at any time and look at the target area in turn: 3315-3305." Currently, gold has reached the target area as expected.
There is no doubt that gold is still in an obvious short arrangement at present, and gold shorts may have just begun. For the next short-term trading, we still focus on shorting gold, so what we are most concerned about now is where gold can rebound and where is the most suitable short entry? ! From the current structure of gold, gold is under pressure from the short-term head and shoulders technical structure. This resistance structure compresses the rebound limit in the short term to the 3335-3340 area; and the short-term resistance area is located in the 3320-3330 area; once gold is under pressure and falls again, I think it is very likely that gold will fall to the 3295-3285 area again, and may even extend to the 3365-3355 area.
Therefore, I think shorting gold is still the first choice for short-term trading; you can consider shorting gold in the 3320-3340 area, looking at the target area of 3290-3280-3270
CRUDE OIL (WTI): Move Up Ahead!
Last week, I already shared a bullish setup on WTI Crude Oil
on a daily time frame.
I see a strong intraday bullish confirmation today.
After a test of an underlined blue support area,
the price went up strongly and violated a resistance line
of a bullish flag pattern on a 4H time frame.
The market is going to rise more.
Goal - 68.2
❤️Please, support my work with like, thank you!❤️
I am part of Trade Nation's Influencer program and receive a monthly fee for using their TradingView charts in my analysis.

AUDUSD Potential UpsidesHey Traders, in today's trading session we are monitoring AUDUSD for a buying opportunity around 0.64600 zone, AUDUSD is trading in an uptrend and currently is in a correction phase in which it is approaching the trend at 0.64600 support and resistance area.
Trade safe, Joe.

BNB Surge Incoming? Why Traders Are Watching $674On the 4H timeframe, BNBUSDT is showing a clear bullish structure with a consistent sequence of higher highs and higher lows since the low formed around June 23. Price action has gradually climbed, forming a well-respected ascending support base. This bullish momentum is further supported by the trend indicator (likely a custom moving average or Supertrend) that has shifted from red to blue and remained supportive of upside movement since late June. The recent consolidation just above the 651–652 support zone suggests that bulls are absorbing selling pressure before potentially pushing higher 📈.
What stands out is how price has broken above previous resistance near 659 and is now hovering near it, turning it into support. This is a textbook break-and-retest pattern, which adds to the bullish case. Buyers seem to be stepping in with confidence around this level.
Key levels are well-marked:
• Support Zone / SL Region: 651.18 – This area has been tested multiple times, making it a strong support and a good level to define risk.
• Resistance 1 / TP1: 674.03 – This is the next target zone, aligned with prior swing highs.
• Resistance 2 / TP2: 687.89 – A more ambitious target in line with broader continuation if momentum holds.
🔐 The current price at 662.07 shows signs of consolidation right above the support-turn-resistance level of 659.03. If the bulls defend this level successfully, continuation toward higher targets is likely.
Trade Setup Summary 🧾
• Entry: Around 662.07 (current market level, post breakout consolidation).
• Stop Loss: Just below the support zone at 651.18, giving enough breathing room while keeping risk controlled.
• Take Profit 1 (TP1): 674.03, a logical level of prior resistance.
• Take Profit 2 (TP2): 687.89, extended resistance zone from previous price action.
• Risk/Reward Ratio: Roughly 1:2.25, offering favorable reward compared to risk.
✅ Why This Trade Setup Makes Sense:
• Break-and-retest confirmation around 659 adds reliability 🔄
• Trend indicator is supportive of bullish momentum 📈
• Risk is clearly defined just below a major support zone 🛡️
• Room for upside toward TP2 offers good potential for reward 💰
Unless price breaks down below 651 with heavy volume, the technical structure remains bullish. If it dips to the support zone again, it might offer a second chance entry opportunity before heading to targets.

GBP/JPY - Channel BreakoutThe GBP/JPY pair on the M30 timeframe presents a Potential Selling Opportunity due to a recent Formation of a Breakout Pattern. This suggests a shift in momentum towards the downside and a higher likelihood of further advances in the coming hours.
Possible Short Trade:
Entry: Consider Entering A Short Position around Trendline Of The Pattern.
Entry: 197.347
Stop Loss: 197.662
Take Profit: 196.332

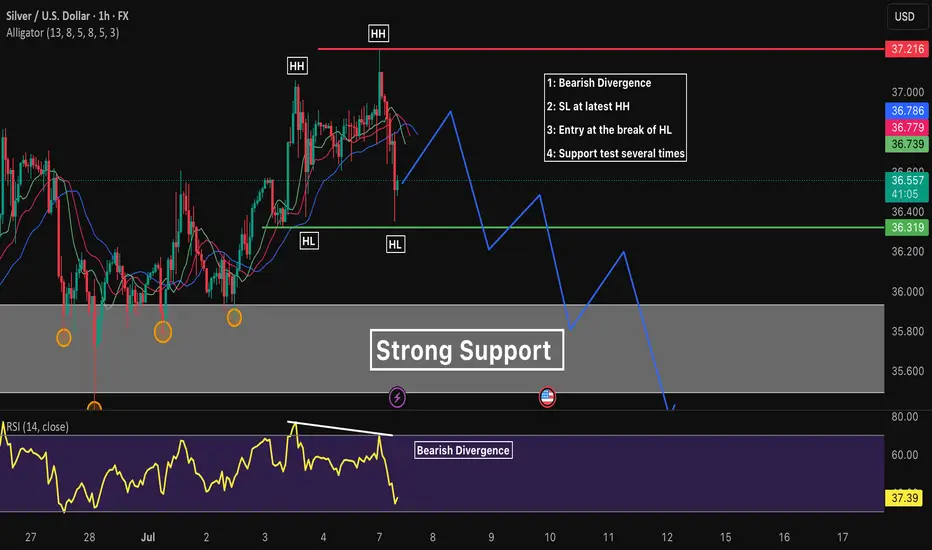
Cheap jewellery (Silver XAG/USD)Setup
Silver is sitting just under multi-decade highs having broken above $34 resistance last month. The long term cup and handle pattern is still in place.
Signal
The price has been consolidating in what could be a bull flag pattern between 35 and 37. A breakout could trigger the next leg of the uptrend, whereas a drop below the bottom of the flag would imply a retest of 34.

Bullish Maple Syrup (USD/CAD)Setup
USD/CAD has broken below its long term uptrend line and is making lower lows while below the 30 week SMA, indicating a downtrend.
Signal
The daily chart shows a steep downtrend with RSI having twice been oversold at the May and June lows. However, on the most recent re-test of the lows RSI has held up. A double bottom pattern confirmed by a break back over 50 RSI could signal a more sustained bounce.

AVN can become volcanic anytime...AVN can become volcanic anytime...
Currently, it is in a rising channel, being accumulated slowly in a rising channel.

TRENDLINE BREAKOUT [LONG]In this analysis we're focusing on 4H timeframe. As we know that price move impulse toward upside and break trendline, now I'm waiting for retracement. Once price reach my zone and give any type of bullish confirmation than we'll execute our trade. This is a higher time frame analysis and key levels. Let's analyze more deeply into smaller time frame and potential outcomes.
Always use stoploss for your trade.
Always use proper money management and proper risk to reward ratio.
#XAUUSD 4H Technical Analysis Expected Move.
POLKADOT on last supportI think $3 is the very strong support for DOT, and the blue zone will hold, and i believe $18 resistance is very reachable for the next few months after $10 resistance got broken.

Trading Recommendations for BTC/USDBitcoin and Ethereum are demonstrating stable growth amid new forecasts regarding the number of interest rate cuts expected from the Federal Reserve this year. Another dovish stance from the Fed Chair and criticism from Trump over Powell's inaction triggered buying on the U.S. market, which also impacted the cryptocurrency market.
Investor enthusiasm is fueled by expectations of more accessible financial resources, which typically drive capital into riskier assets like cryptocurrencies. Bitcoin, as the flagship of the crypto market, traditionally reacts first to changes in macroeconomic conditions. However, one should not forget the inherent volatility of the crypto market. Even positive macro signals do not guarantee sustainable growth-especially as Bitcoin has been hovering near its historical highs, where buyer interest has been waning recently. It's essential to c consider technical factors, market sentiment, and regulatory risks, all of which can significantly influence price dynamics.
Meanwhile, alongside Strategy, Japanese investment company Metaplanet purchases Bitcoin for its balance sheet. Data shows the company acquired an additional 1,234 BTC for approximately $132.7 million just one day after announcing a $515 million capital raise to fund its Bitcoin treasury strategy. The Tokyo-listed firm stated that this latest purchase at around $107,557 per Bitcoin raised its total holdings to 12,345 BTC. The company holds about $1.3 billion worth of Bitcoin based on current market prices. This makes Metaplanet the seventh-largest publicly listed corporate holder of Bitcoin, surpassing Tesla, which holds 11,509 BTC.
As for intraday strategy in the cryptocurrency market, I will continue to act based on any major pullbacks in Bitcoin and Ethereum, expecting the medium-term bullish market to persist
For short-term trading, the strategy and conditions are described below.
Buy Scenario
Scenario #1: I will buy Bitcoin today if it reaches the entry point around $106,227 aiming for a rise to $ 107,042. Near $107,042 I plan to exit the long position and sell on pullback. Before buying on a pullback, ensure the 50-day moving average is below the current price and the Awesome Oscillator is above zero.
Scenario #2: If the market does not react to a breakout, Bitcoin ca also be bought from the lower boundary at $105,039 with targets at $106,221 and $106,748.
Sell Scenario
Scenario #1: I will sell Bitcoin today if it reaches the entry point around $107,695 aiming for a drop to $106,008. Near $106,008, I plan to exit the short position and buy on a bunce. Before selling on a breakout, ensure the 50-day moving average is above the current price and the Awesome Oscillator is below zero.
Scenario #2: Bitcoin can also be sold from the upper boundary at $106,753 if there is no market reaction to a breakout, targtion the $104,651 and $103,888 levels.

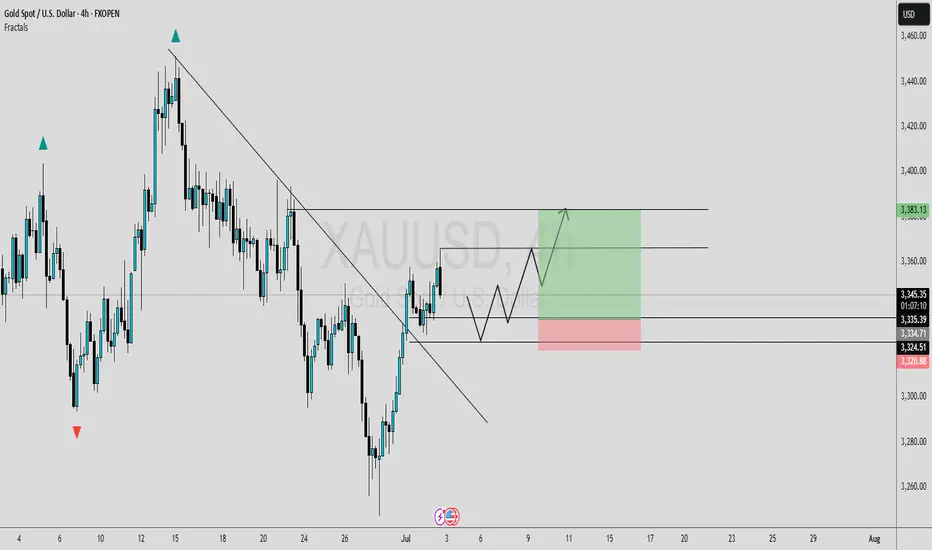
Continue to short gold, bears will exert force againAffected by the NFP market, gold fell precipitously, almost giving back 50% of the gains in the previous wave, and the short-selling performance was particularly strong; technically, gold successfully built a double-top structural resistance in the 3365-3363 area in the short term, which played a technical suppression role in the short term. As gold fell, the current short-term resistance moved down to the 3340-3350 area;
On the other hand, although gold began to rebound after falling to around 3312, it clearly showed the characteristics of weak rebound, and it did not even stand above 3340 once, and the long forces were insufficient; and technically, a single lower shadow line was not enough to support the continued rebound of gold, so gold still had the need to retrace the support below from a technical perspective; and once gold fell again, it was very likely to test the 3305-3295 area again.
So I think we can take advantage of the rebound of gold to short gold again. We can still short gold with the 3340-3350 area as resistance and look at the target area: 3315-3305-3295.
Bitcoin - Will Bitcoin record a new ATH?!Bitcoin is above the EMA50 and EMA200 on the four-hour timeframe and is in its medium-term ascending channel. Maintaining the specified support area will lead to the continuation of Bitcoin’s upward path and recording a new ATH. If it is corrected, we can look for Bitcoin buying positions from the specified demand zones.
It should be noted that there is a possibility of heavy fluctuations and shadows due to the movement of whales in the market and compliance with capital management in the cryptocurrency market will be more important. If the downward trend continues, we can buy within the demand area.
In recent days, Bitcoin has been stabilizing in a price range of around $107,000, with the market simultaneously witnessing a combination of short-term volatility and massive accumulation by institutional investors. A close examination of Bitcoin’s fundamental parameters shows that the market has entered a different phase than in the past; one that is no longer driven solely by momentary excitement, and that structured capital flows and on-chain data have formed its main axis. At the forefront of this trend are Bitcoin spot investment funds (Bitcoin ETFs), which reached their highest level of capital inflows in June. Total net inflows of these funds reached more than $4.5 billion last month, and on some days even approached more than $1 billion. Funds such as BlackRock’s IBIT and Fidelity’s FBTC now have billions of dollars in assets under management, a clear sign of increasing institutional participation in the Bitcoin market. These institutional investors are accumulating Bitcoin not with a short-term view, but with a long-term view and through legal means, which has reduced selling pressure and increased market stability.
On the other hand, the data from Anchin clearly shows that the market is in a steady accumulation trend. The amount of old Bitcoins held for more than 8 years experienced a significant growth of 5% in the second quarter of 2025. This statistic shows that long-term investors are not only reluctant to sell, but are still accumulating their assets. Also, the MVRV ratio, which indicates the relative profit or loss of the market, has decreased from 2.29 to 2.20, indicating mild and controlled profit taking by some investors, rather than widespread selling pressure or general panic. This rational behavior is a sign of market maturity and investors’ intelligence in managing short-term profits.
On-chain activity data also shows a similar trend. The average daily active addresses have reached around 1.02 million, indicating a decrease in market inflammation while maintaining overall dynamism. Other indicators such as Liveliness and Whale Accumulation also confirm that the amount of old transaction traffic has decreased and whales are mainly accumulating, not supplying. This trend is very valuable, especially in a market that has been far from explosive growth. From a macro perspective, the Bitcoin market is clearly in a consolidation and accumulation phase, but this consolidation is based on much stronger foundations than in previous periods. Institutional capital inflows via ETFs have reached over $50 billion, providing a strong foundation for continued growth. Also, some very old wallets that have been inactive for nearly 14 years have recently woken up and moved around $2 billion worth of Bitcoin. Although this could be a sign of potential supply, the market has not yet seen a significant negative reaction to it in the current market conditions and the market remains cautious.
Analysts believe that Bitcoin is in the third phase of its bullish cycle after the halving, which could bring gains of more than 120%. Some forecasts suggest a price range of $200,000-250,000 by the end of this year; however, the realization of such levels is subject to stable macroeconomic data, ETF performance and the absence of severe geopolitical shocks.
Finally, it can be said that the Bitcoin market has now reached a maturity where even periods of consolidation tend to strengthen its fundamentals rather than weaken the market. High-powered institutional investors are entering, whales continue to accumulate instead of selling, and long-term investors also see a bright outlook for the coming months. In this phase, price levels of $125,000 to $140,000 are likely by the end of the summer if the current trend continues, while in the event of severe economic or political pressures, key support for Bitcoin will be in the $95,000 to $100,000 range. Overall, Bitcoin is moving slowly but steadily towards higher targets, with stronger support than at any time in its history.

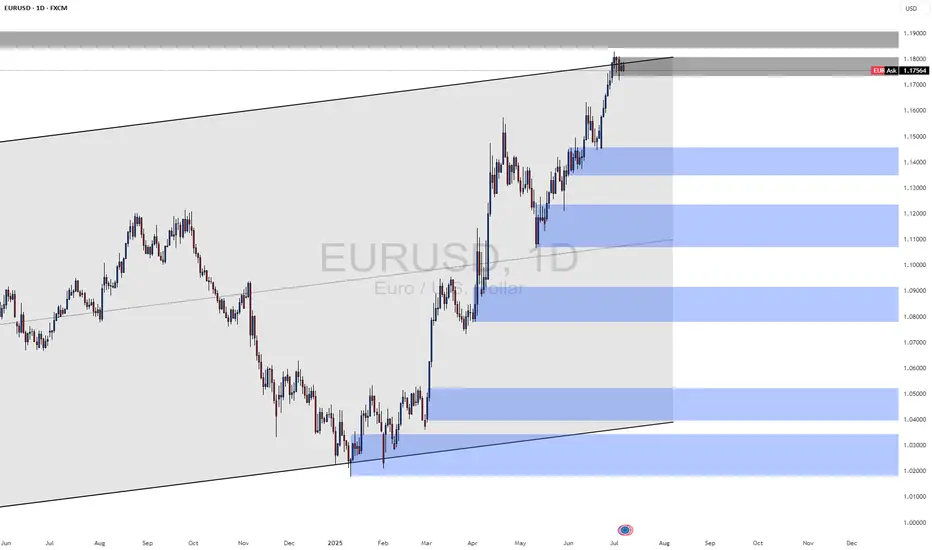
EUR/USD Pair Analysis📉 EUR/USD Pair Analysis – Monday, July 7, 2025
1️⃣ A clear ascending price channel on the daily chart defines the overall trend of the pair.
2️⃣ The price is currently touching the upper boundary of the channel, indicating a potential downward correction from the designated areas (in gray).
3️⃣ Strong demand areas have emerged at lower levels, which may support a subsequent upside move.
📌 Summary and Recommendation:
🔻 In the short term:
An opportunity to quickly sell the pair using scalping from the current areas, targeting nearby points.
🔺 In the medium to long term:
We prefer to wait for a decline to the lower boundary of the price channel, as we plan to buy from there, in line with the general uptrend.
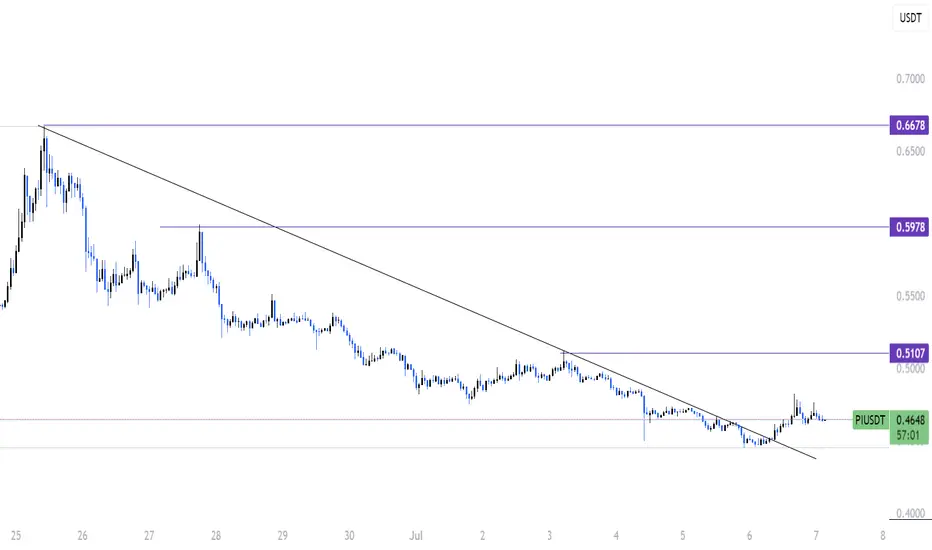
PI breakout from wedge and Trendline !!🚨 PI Breakout Update 🚨
Hey traders, hope you're all doing great!
Looks like PI just broke out of a strong trendline, and things are getting interesting.
We’ve seen solid support holding for a while, and now bulls are starting to wake up.
This move could be the start of something big if momentum continues.
Still early, but signs are pointing towards a possible bullish leg up.
Watch for a clean retest of the trendline — that could be your confirmation.
Volume is building nicely, and price action is starting to shift.
If you're tracking PI like I am, this is one to keep an eye on.
🔔 Follow for more updates and let's catch this move together!
EURAUDH4 resistance broken and also have a support trendline. Waiting for a retest to take buys to the next H4 resistance zone around 1.83500. Watch the fundamentals too.

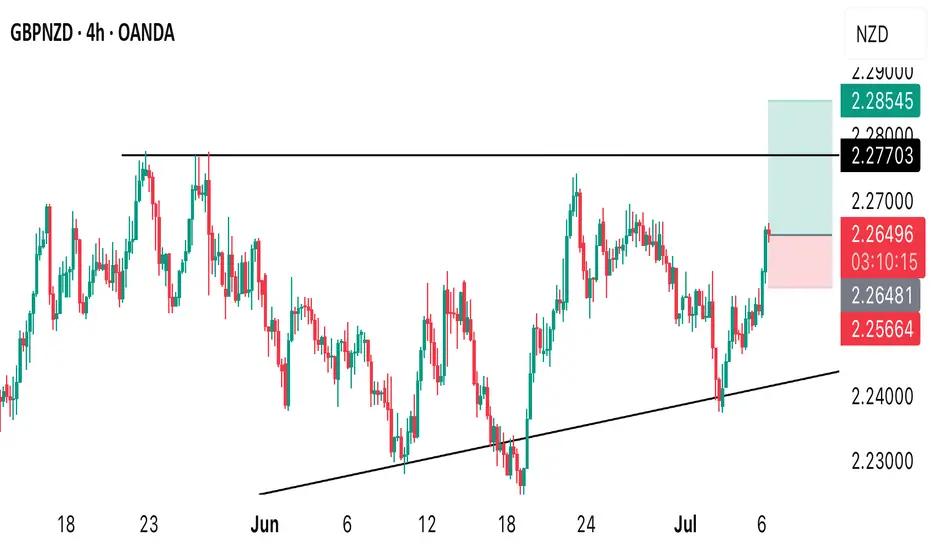
A buy opportunity you don’t wanna miss on GBPNZD!!!NZD price recently dropped in value as we saw an aggressive sell off. We considered buy GBP against NZD. We anticipate further drop in NZD thereby buying GBPNZD. A buy opportunity is envisaged from the current market price.
DXY TrendlinesUnless it brakes the downtrend with a weekly candle close it should bounce back up in long run. should be closely monitored since it will give us a lot of information about current market direction. i expect bouncing back up but we will see.

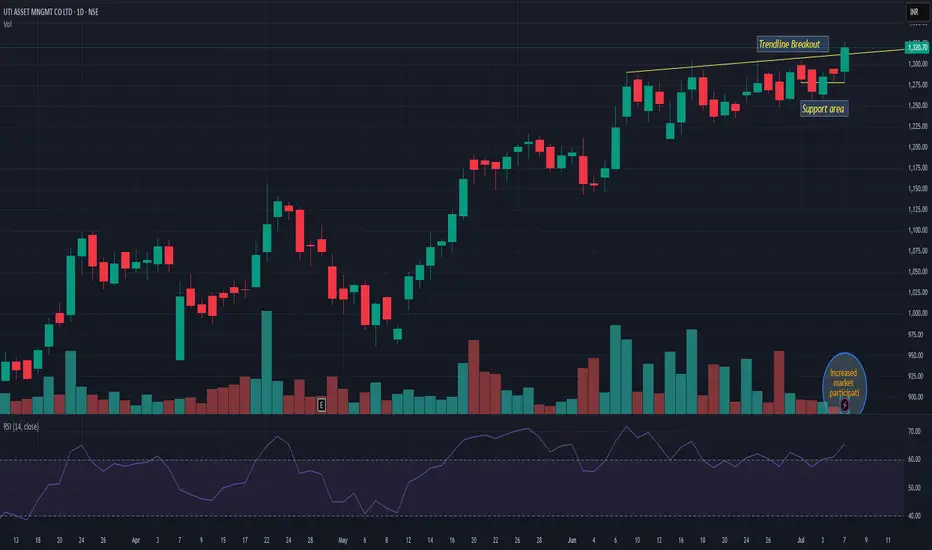
UTIAMCUTIAMC giving trend-line breakout with increased volume. It is trending just 5=7% away from ATH. 1250 seems strong support and on upper side it may trade above 12-15%. Keep it on radar
EURUSD InsightHello to all our subscribers,
Please feel free to share your personal opinions in the comments. Don't forget to like and subscribe!
Key Points
- President Trump stated, “A letter will be sent on Monday, and it could be 12 countries, possibly even 15.” He added, “I think we’ll finalize negotiations with most countries by July 9 — either a letter or a deal.”
- U.S. Treasury Secretary Scott Besent said that “President Trump will send a letter stating that if negotiations with trade partners do not make real progress, tariff levels will revert to those announced on April 2, starting August 1.”
- The legislative process for the “One Big Beautiful Bill,” centered on making Trump’s tax cuts permanent, was completed on July 4. The U.S. Treasury is expected to significantly increase the issuance of Treasury securities soon.
Key Economic Events This Week
+ July 8: Reserve Bank of Australia (RBA) Interest Rate Decision
+ July 9: Release of FOMC Meeting Minutes
+ July 10: Germany June Consumer Price Index (CPI)
+ July 11: United Kingdom May GDP
EURUSD Chart Analysis
The pair recently broke above the 1.18000 level and appears to be approaching key resistance near the highs. There still seems to be some room for further upside. If the upward move continues, the 1.19000 level is the most likely target for the next peak. However, if the trend reverses downward, a pullback to the 1.15000 level remains a possibility.
