USD/JPY - Channel BreakoutThe USD/JPY pair on the M30 timeframe presents a Potential Selling Opportunity due to a recent Formation of a Breakout Pattern. This suggests a shift in momentum towards the downside and a higher likelihood of further advances in the coming hours.
Possible Short Trade:
Entry: Consider Entering A Short Position around Trendline Of The Pattern.
Entry (Sell Limit): 144.435
Stop Loss: 144.669
Take Profit: 143.768
This is Sell Limit entry and wait for pullback to enter the trade
Trend Lines

Ethereum | ETH | Long at $2,598.77Currently within my historical simple moving average area and consolidating. I suspect a move up is imminent, but 100% speculation. Crypto "bros" know more than I do.
Targets into 2028:
$4,000 (+53.9%)
$5,500 (+111.6%)

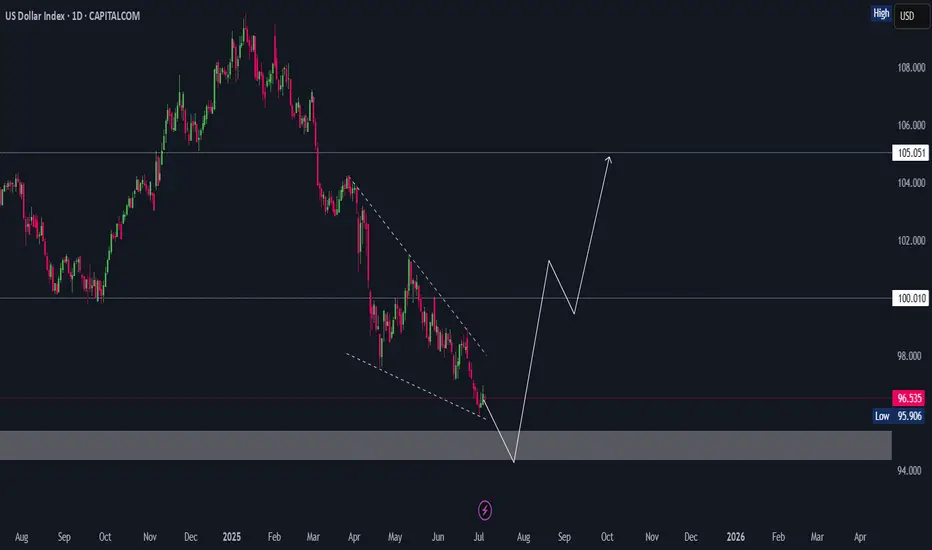
DXY Bullish IdeaDXY has been printing Lows since past weeks and is currently testing a good long term support. A good bounce is expected in dollar.
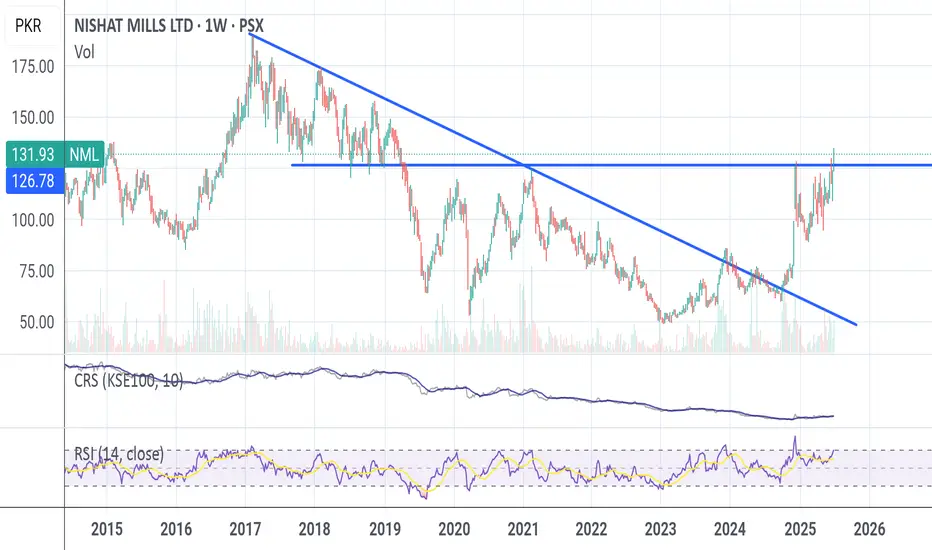
NMLStarting to move high from key polarity zone. Just like other textile companies, this one also looks good.
Gold continues to fluctuate, where will it go next week?Fundamental analysis:
With the Trump administration's massive tax cut and spending bill officially implemented, the U.S. Treasury may start a "supply flood" of short-term Treasury bonds to make up for the trillions of dollars in fiscal deficits in the future. The market has begun to respond to future supply pressures. Concerns about the oversupply of short-term Treasury bonds have been directly reflected in prices - the yield on 1-month short-term Treasury bonds has risen significantly since Monday this week. A closer look at non-agricultural new jobs exceeded expectations, but nearly half came from government departments, which is likely to reverse in July. Slowing wage growth, declining total working hours, stagnant wage income growth, and worrying consumer spending are all signs of support for gold.
Gold bottomed out and rose from the low of 3245 this week, and then soared all the way to 3365. Finally, the weekly line closed with a positive line with an upper shadow. From the overall trend, after the data is digested, next week will still be treated with a volatile mindset. The large range will focus on the 3280-3393 area. If it does not break, it will still be mainly a sweeping operation. On the daily line, it also closed with a positive line with a long upper shadow, and closed firmly above 3323. It repeatedly tested the pressure of 3345 and did not break and fell back. The structure still maintained an oscillation rhythm within a small range. From the 4-hour cycle, the Bollinger Bands closed significantly. If it opens normally next week, pay attention to the 3325-3315 and 3311 areas when it falls back to support, and pay attention to the 3357 and 3365 positions when it hits the high pressure. It is recommended to maintain the strategy of selling high and buying low in operation and respond to the trend.For more specific operational details and strategy updates, please pay attention to the notifications at the bottom 🌐 and follow them in time.

$ETH 4H Update: Target 1 hit! Ethereum has reached the $2,600 . CRYPTOCAP:ETH 4H Update:
Target 1 hit! Ethereum has reached the $2,600 level after a clean breakout from the falling wedge. Holding above support confirms bullish momentum — next key target is $2,800 as long as price stays above $2,400


HelenP I. Gold can correct to trend line and then bounce upHi folks today I'm prepared for you Gold analytics. If we look at the chart, we can see that gold has formed a broadening wedge pattern with several touches of the trend line, which acts as a dynamic support. After a strong drop, the price found support near the 3295 level and rebounded, forming a local upward movement. However, bulls have not yet shown a strong impulse, and the price is still trading below the resistance zone between 3390 and 3400 points. Currently, the price is hovering just above the trend line, and appears to be testing this support again. I expect a short decline, possibly to the area around 3295 - 3285 points - that’s the key support zone. If this area holds and we see a bounce, it will confirm that buyers are still active and ready to push the price up again. In this case, we could see gold continue moving inside the wedge pattern and aim for the upper resistance. My goal is set at the 3390 level, right near the wedge's upper border and strong resistance. This target matches the local highs from previous attempts, and if bulls gain momentum, they may try to break through this zone. But for now, I remain cautiously bullish and expect gold to bounce off the trend line and move upward toward the resistance. If you like my analytics you may support me with your like/comment.❤️
Disclaimer: As part of ThinkMarkets’ Influencer Program, I am sponsored to share and publish their charts in my analysis.

Gold opening market strategy analysis
💡Message Strategy
In the case of all negative non-agricultural data, gold did not fall below the support of 3300, which shows that gold bulls are still the main trend. The current daily pattern of gold is three positives, one negative and one positive. The trend of the opening next Monday is also very important. Once it continues to rise and rebound to break through the suppression, the bulls will open the door to regain the 3400 mark.
At present, the short-term pressure is still maintained at 3345-50, which is also the first point for the bulls to break through. Once the breakthrough is successful, the next target will be around 3365-3370.
📊Technical aspects
From the 4-hour analysis, the support at 3330 is concerned, and the support at 3320 is concerned. The short-term resistance at 3345-50 is concerned, and the suppression at 3365-70 is concerned. The overall low-multiple cycle participation is maintained. In the middle position, watch more and do less, and be cautious in chasing orders, and wait patiently for key points to participate. Pay attention to the specific operation strategy in time.
💰Strategy Package
Long Position:3320-3330,SL:3305,Target: 3370

Wait for all currencies to fall further and sell your tokens.There is currently no news of growth in Ethereum and altcoins, and every time it goes up, there is an opportunity to exit and it is a trap. Ethereum and altcoins are only for sale. Soon Cardano will be 0.08, Ethereum 600,
Dogecoin 0.003,
Shiba 0.0000001,
and the rest will fall, and they will only release tokens and swallow your dollars in the name of Alt Season.
#TON Update #1 – July 6, 2025⚪️ #TON Update #1 – July 6, 2025
Toncoin has partnered with the UAE to provide a 10-year golden visa for LSE:TON stakers.
The recent surge in Toncoin is primarily driven by this news. This sharp rise should be viewed with caution, as it’s not the result of a steady, healthy trend. While it may appear to have initiated a new impulsive move, the underlying structure is not solid. Therefore, I strongly advise against making any purchases until a proper correction takes place.

PNUT/USDT – Bullish Rebound from Channel Support | Long SetupPNUT/USDT is currently respecting the ascending parallel channel on the 4H timeframe. Price bounced off the lower boundary of the channel, showing signs of a potential bullish continuation. A long position is entered near support, with a target toward the upper range of the channel and a tight stop loss just below the structure.
🔹 Entry: ~0.2218
🔹 Stop Loss: ~0.2140 (below channel support)
🔹 Take Profit: ~0.2521 (upper channel resistance)
🔹 Risk-to-Reward: ~4.2R
The trade aligns with the trend structure and offers a favorable R:R setup. Break of the channel may invalidate the setup.

SOLANA → Pre-breakdown consolidation may lead to distributionBINANCE:SOLUSDT is declining and testing the support of the trading range as Bitcoin pauses after strong growth and enters a correction phase...
SOL looks a bit weaker than Bitcoin technically, but SOLANA has some positive fundamentals, though that might not be enough.
After forming a false breakout of key daily resistance, Bitcoin is moving into a correction phase. An update of local lows on the chart could trigger a drop across the entire cryptocurrency market.
In SOL, the focus is on the two nearest levels of 148.75 and 145.64. A breakdown of support could trigger the distribution of accumulated energy within the specified range as part of a downward momentum.
Resistance levels: 148.75, 151.2, 153.88
Support levels: 145.64, 138.59
The ideal scenario would be a false breakout of 148.75 (liquidity capture) and a retest of 145.64, followed by a break of support. Consolidation below 145.65 could trigger a drop to the zone of interest at 138.59.
Best regards, R. Linda!

BITCOIN ANALYSIS - What's Next for for BTC?🎯 KEY LEVELS DECODED
🛡️ FORTRESS SUPPORT: $102,800 - $103,200
_____________________________
NEUTRAL STRATEGY:
Buy Zone: $102,800 - $102,600
Sell Zone: $110,000 - $112,000
Stop Loss: $100,500 (range breakdown)
Target: Opposite end of range
Position Size: 3-5% of portfolio
_____________________________
🎢 SCENARIO : (Probability: 35%)
If BTC consolidates between $102K-$108K :
Range-bound trading for 2-3 weeks
Accumulation phase before next major move
Key levels: Buy $102K, Sell $110K
_________________________
🛡️ RISK MANAGEMENT 🚨 DISCLAIMER 🛡️ DYOR

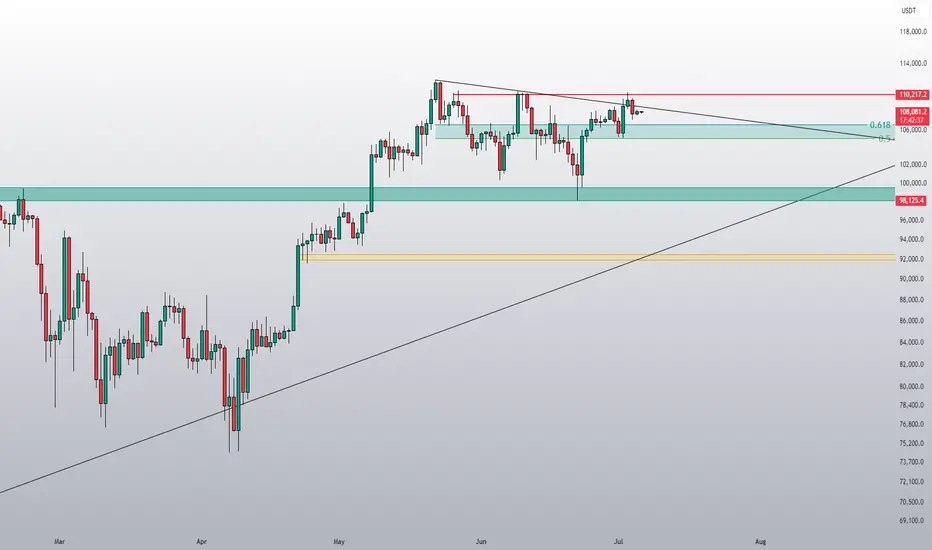
The calm before the stormBTC has been rejected at resistance for now, which was to be expected. More importantly, the price is currently trading above the golden pocket of the overall correction. This suggests the correction might be over and that we could eventually break to new ATHs.
XRP Breakdown Ahead? Don’t Get Caught LongYello, Paradisers! Are you about to fall into a classic trap on XRP? The signs are stacking up, and if you're not careful, this move could catch a lot of traders on the wrong side of the market.
💎XRPUSDT is showing clear signs of weakness. A bearish CHoCH (Change of Character) has formed, and an inverse Cup & Handle pattern is currently playing out. On top of that, price action has decisively broken below the key support trendline. These signals together significantly increase the probability of a deeper bearish move in the coming days.
💎From the current price level, XRP is offering a 1:1 risk-to-reward setup. While this may attract more aggressive or short-term traders, the safer and more strategic approach is to wait for a proper pullback before entering. That would allow for a more favorable risk-to-reward and confirmation of the trend direction, reducing the likelihood of being caught in short-term noise.
💎It’s also crucial to watch the invalidation level. If XRP manages to break back above that zone and close a candle above it, this would invalidate the current bearish idea entirely. In such a case, it's better to stay patient and wait for clearer price action before making any decisions.
🎖Strive for consistency, not quick profits. Treat the market as a businessman, not as a gambler.
MyCryptoParadise
iFeel the success🌴

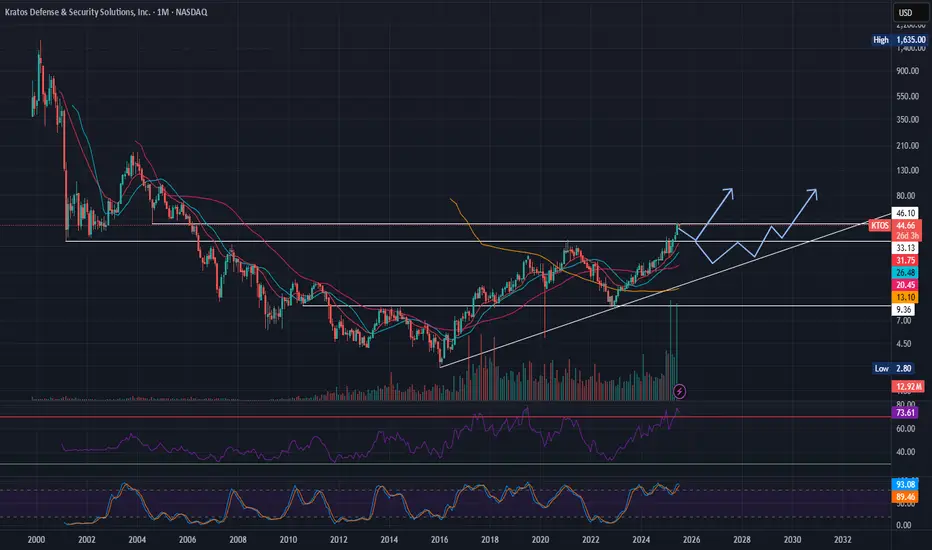
KTOS - Up is not an if, but whenBig resistance at $46 (today) and $33 (we broke through this May 2025).
Now need to see if either:
(a) $33 will be support -- we drop down 25-30% to re-test and bounce off this before going higher
OR
(b) $46 resistance gets broken and becomes new support, to what is effectively all-time-highs (ignoring pre-2006 levels)
Why is Up most likely?
> We established higher lows in 2015, 2020, 2023 (3 points makes a trend, not a line)
> Revenue is increasing >10%/year. Not great, but not bad. Point is, it's going up!
What's the downside on KTOS?
> $10/share is proper support if $33 breaks --> High Risk/Reward
My plan for investing:
> Wait for $35/share (25% decline from today). See if we back-test and can confirm support. Could enter a small position here with a limit order.
> If we break out >$50 from here, I'd be convinced I've missed the run up from $10 in December 2022. Don't need to touch it until something changes
Why I don't like KTOS as much as AVAV
> KTOS revenue growth rate is slower
> KTOS profit margins are lower
> KTOS has higher US and higher US Government exposure (AVAV more diversified)
> KTOS has $280M debt and $260M cash on $1.15B annual revenue and $0-50M annual cash flow;
AVAV has $65M debt and $40M cash on $820M revenue* and $15-100M annual cash flow
*Pre-acquisitions
I need to see proven ability to either (ideally both): grow revenue faster, achieve higher margins or cash flow from operations. AVAV has done this in the last year.
ARPA - long position1D timeframe
Bullish divergence
Entry around the 618 fib
Targets rely on a breakout of 2 x downtrends
Entry: 0.0196
TP1: 0.0288 (+47%)
TP2: 0.0375 (+91%)
TP3: 0.0480 (+138%)
SL: 0.0173 (-13%)
R:R - 10:1

HelenP. I Bitcoin may correct to support level and continue growHi folks today I'm prepared for you Bitcoin analytics. If we look at the chart, the price has formed a clean upward channel after bouncing from the strong support zone at 103500 - 103000 points. This movement marked the beginning of a new bullish phase. Price continued to rise step by step, confirming the structure with higher highs and higher lows. After reaching above 110000 points, it made a minor pullback but still trades above Support 1 - 108800 points. This zone, 108800 - 108200 points, aligns well with the midline of the channel and may serve as a strong area for buyers to re-enter. The price is currently trading around 110382 points and is still respecting the channel structure. As long as BTCUSD stays above the support zone and inside the ascending channel, I expect a potential continuation toward the upper boundary. My current goal is 114000 points - near the resistance line of this bullish channel. Given the strong trendline support, clean reaction at each correction, and buyer activity on lows, I remain bullish and anticipate further growth. If you like my analytics you may support me with your like/comment ❤️
Disclaimer: As part of ThinkMarkets’ Influencer Program, I am sponsored to share and publish their charts in my analysis.

GBPJPY Breakout and Potential RetraceHey Traders, in the coming week we are monitoring GBPJPY for a buying opportunity around 196.600 zone, GBPJPY was trading in a downtrend and successfully managed to break it out. Currently is in a correction phase in which it is approaching the retrace area at 196.600 support and resistance zone.
Trade safe, Joe.

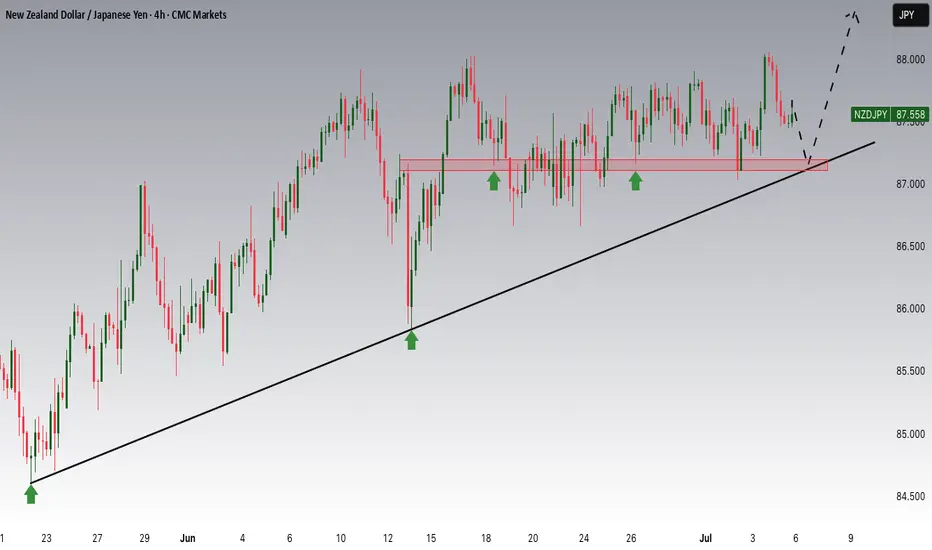
NZDJPY Potential UpsidesHey Traders, in the coming week we are monitoring NZDJPY for a buying opportunity around 87.200 zone, NZDJPY is trading in an uptrend and currently is in a correction phase in which it is approaching the trend at 87.200 support and resistance area.
Trade safe, Joe.
Eth revealed If you want to know the simplest way to trade in ETH for the next few years.
This is how Eth is moving.
We will discuss this further in January 2027.

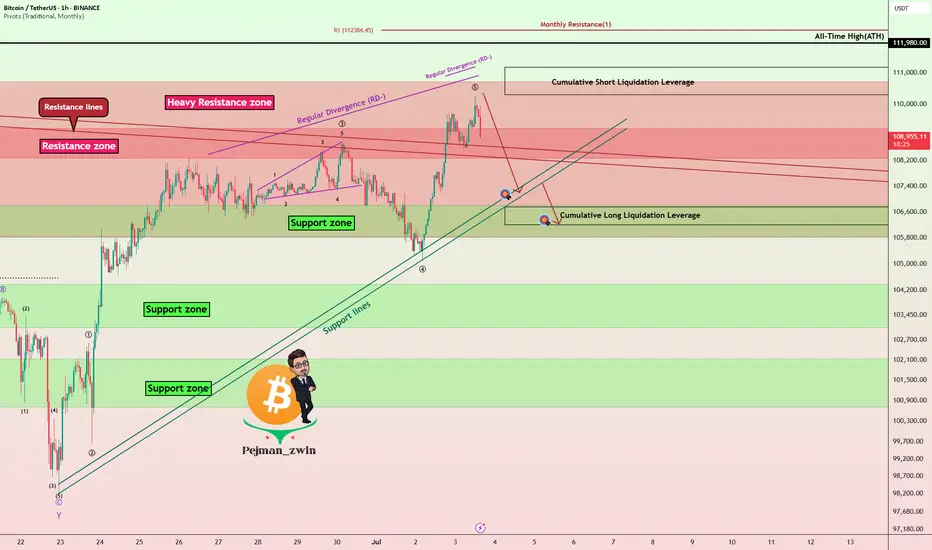
Bitcoin Roadmap => Short-termBitcoin ( BINANCE:BTCUSDT ) is moving above a Heavy Resistance zone($110,720-$105,820) , Cumulative Short Liquidation Leverage($110,300-$111,177) and is approaching All-Time High(ATH) .
Do you think Bitcoin will create a new All-Time High(ATH) in this rally?
In terms of Elliott Wave theory , Bitcoin's rise over the last two days appears to have been in the form of wave 5 .
Also, we can see the Regular Divergence(RD-) between Consecutive Peaks.
I expect Bitcoin to start declining in the coming hours. Targets are marked on the chart.
Cumulative Long Liquidation Leverage: $106,750-$106,202
Note: Stop Loss(SL)= $111,223
Please respect each other's ideas and express them politely if you agree or disagree.
Bitcoin Analyze (BTCUSDT), 1-hour time frame.
Be sure to follow the updated ideas.
Do not forget to put a Stop loss for your positions (For every position you want to open).
Please follow your strategy and updates; this is just my Idea, and I will gladly see your ideas in this post.
Please do not forget the ✅' like '✅ button 🙏😊 & Share it with your friends; thanks, and Trade safe.