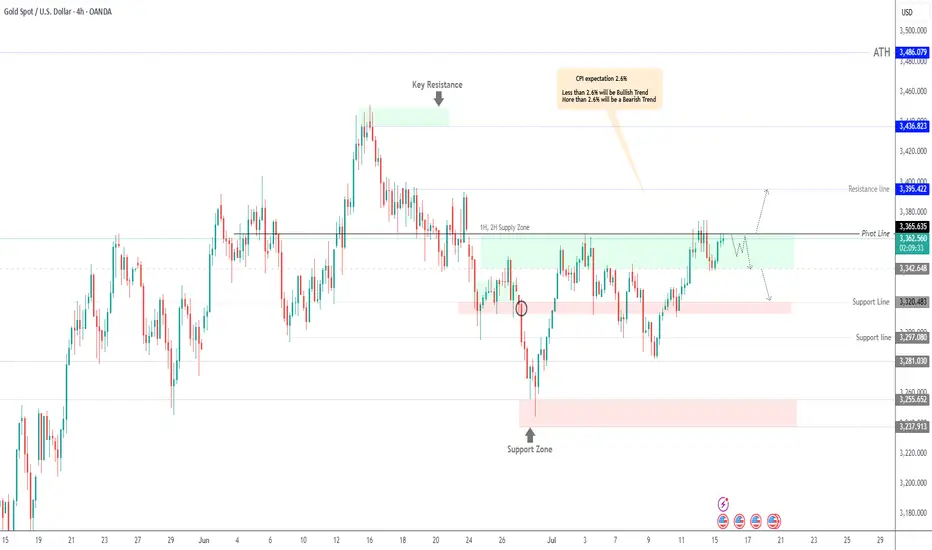
GOLD Under Pressure – CPI to Drive the Next MoveGOLD Outlook – Bearish Below 3365, CPI in Focus
Gold is showing bearish momentum while trading below 3365, with a likely move toward 3342.
However, if the price closes a 1H or 4H candle above 3365, it may shift to a bullish trend targeting 3395.
CPI data will be the key factor in determining the next move.
The market expects a print of 2.6%, which would signal no Fed rate cuts this year due to rising tariff pressures.
That said, we expect a 2.7% release, which would likely support a bearish trend for gold.
But if the release is less than 2.6% that will support the bullish trend.
Pivot Line: 3365
Support: 3342 – 3320
Resistance: 3375 – 3395
Trend Lines
The short-selling idea remains unchanged, defend 3355📰 News information:
1. Powell responds to White House issues
2. Will other countries impose reciprocal sanctions on tariffs?
📈 Technical Analysis:
Gold closed with a long lower shadow on the daily line yesterday and closed with a doji on the hourly line. In the short term, gold may continue to rise and is expected to touch the 3355 line. If gold cannot break through and stabilize above 3355, then gold may fall back. We can still consider shorting, and the target can be 3330. If the trend is as expected, it may form the embryonic form of a head and shoulders bottom. On the contrary, if the gold price breaks through 3355, stop loss on short positions and pay attention to the high resistance of 3375-3385.
🎯 Trading Points:
SELL 3340-3355
TP 3330-3320
In addition to investment, life also includes poetry, distant places, and Allen. Facing the market is actually facing yourself, correcting your shortcomings, facing your mistakes, and exercising strict self-discipline. I share free trading strategies and analysis ideas every day for reference by brothers. I hope my analysis can help you.
TVC:GOLD PEPPERSTONE:XAUUSD FOREXCOM:XAUUSD FX:XAUUSD OANDA:XAUUSD FXOPEN:XAUUSD

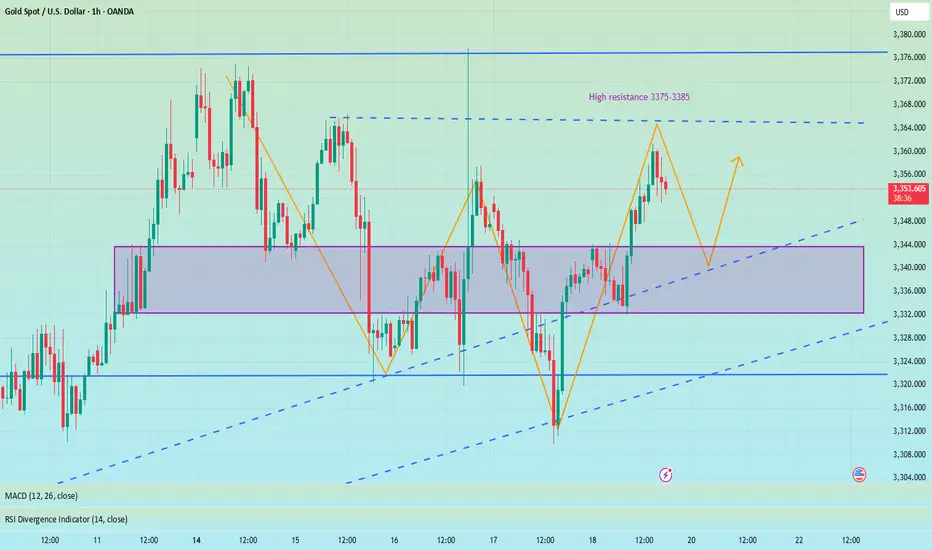
Long and short fluctuations, the market is waiting for a break📰 News information:
1. Powell responds to White House issues
2. Will other countries impose reciprocal sanctions on tariffs?
📈 Technical Analysis:
Although the MACD indicator of the gold hourly line formed a golden cross, the market reached a high of around 3361, and the RSI indicator was close to the overbought area, so we need to be cautious about corrections. From the 4H chart, the MACD second golden cross is on the zero axis. Currently, we are paying attention to the moving average SMA5 near 3343, and the SMA60 support line 3332. If the 4H upward trend falls back, we need to go long. At present, gold is still running above, and there is no good participation point in the short term, but on the whole, we should pay attention to the support of 3345-3332 below, and we can consider going long if it retreats and stabilizes. We continue to pay attention to the resistance pressure of 3375-3385 above, and we can try to go short if it does not break.
🎯 Trading Points:
SELL 3375-3385
TP 3365-3355
BUY 3345-3332
TP 3365-3375-3385
In addition to investment, life also includes poetry, distant places, and Allen. Facing the market is actually facing yourself, correcting your shortcomings, facing your mistakes, and exercising strict self-discipline. I share free trading strategies and analysis ideas every day for reference by brothers. I hope my analysis can help you.
FXOPEN:XAUUSD OANDA:XAUUSD FX:XAUUSD FOREXCOM:XAUUSD PEPPERSTONE:XAUUSD TVC:GOLD
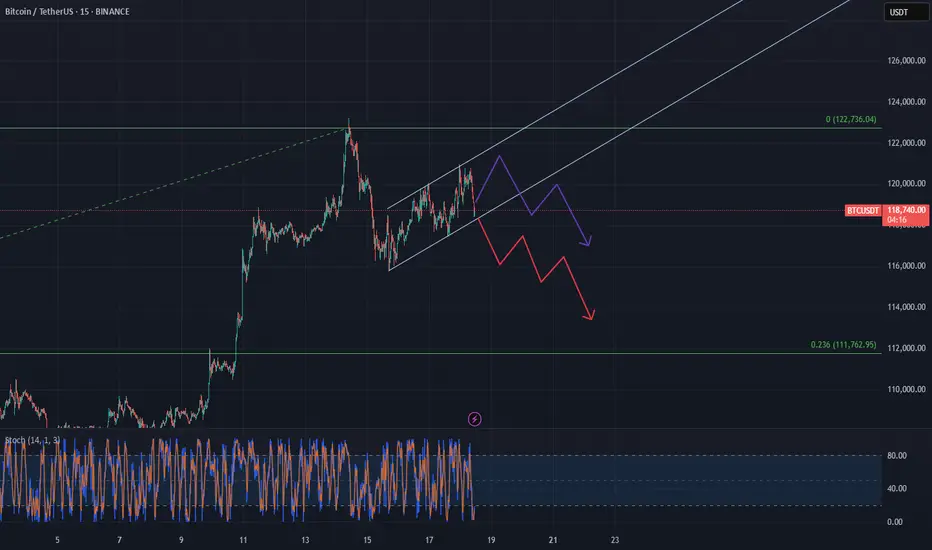
BTC consolidating a short term bearish channelBTC is moving inside a short-term bearish channel right now, even though the bigger trend is still upward. It looks like it's just consolidating for the time being, bouncing between the top and bottom of the channel.
But if it breaks below that lower trendline, we could see a pretty sharp move down—possibly all the way to around $112K , which lines up with the Fibonacci retracement from the last rally. That zone could act as a support.
It might hang out in this range a little longer, but once it breaks down, it’s probably heading toward that level.
SHIBUSDT🕯 The key resistance level, identified as the best resistance for a break and pump, stands at 0.0000135, with a potential price increase to 0.00001567 if breached, serving as the next target (Pullback level). On the support side, the main level is observed at 0.0000115, and should the price fall below this, it may decline further to the lower Major Level of 0.0000100.
🔽 Resistances:
Main resistance level: 0.0000135 (potential break for pump)
Next target (Pullback level): 0.00001567
🔼 Supports:
Main support level: 0.0000115
Lower level (Major Level): 0.0000100
⚠️Contorl Risk management for trades.

BRENT CRUDE OIL FORMED A BEARISH WEDGE. ANOTHER POSSIBLE DECLINEBRENT CRUDE OIL FORMED A BEARISH WEDGE. ANOTHER POSSIBLE DECLINE?📉
USOIL has been trading bullish within the last couple of days, supported by prospects of tighter supply and an improved demand outlook. US crude inventories dropped last week, which indicates firm demand despite the rising output.
Still, technically, oil looks bearish. It has formed a bearish wedge and is currently testing the former trendline from below. The most probable scenario is that wee see the bearish impulse towards 6,500.00 with further decline. Another option is that the rise will continue towards 6,900.00 level.

EURJPY ANALYSISAfter seeing that the previous daily candle could not trade below the moving averages and had a retracement to the upside it will be a good idea to wait and see how the pair trades before executing in a specific direction

USNAS100 | Consolidation 23010 - 22900, Bearish or Not Yet...USNAS100: Cautious Consolidation as Powell Uncertainty Lingers
Following political noise around Fed Chair Powell — with Trump admitting he floated the idea of replacing him — tech markets have entered a cautious consolidation. While no immediate action was taken, the underlying uncertainty continues to weigh on sentiment, especially in rate-sensitive sectors like tech.
Technically: Consolidation Before the Break
The price is currently consolidating between 22900 and 23010.
A confirmed 1H close below 22900 would signal the start of a bearish trend, targeting 22700 and 22615.
Conversely, a close above 23010 would open the path toward a new all-time high (ATH) at 23170.
Key Levels:
Support: 22700, 22615
Resistance: 23010, 23170

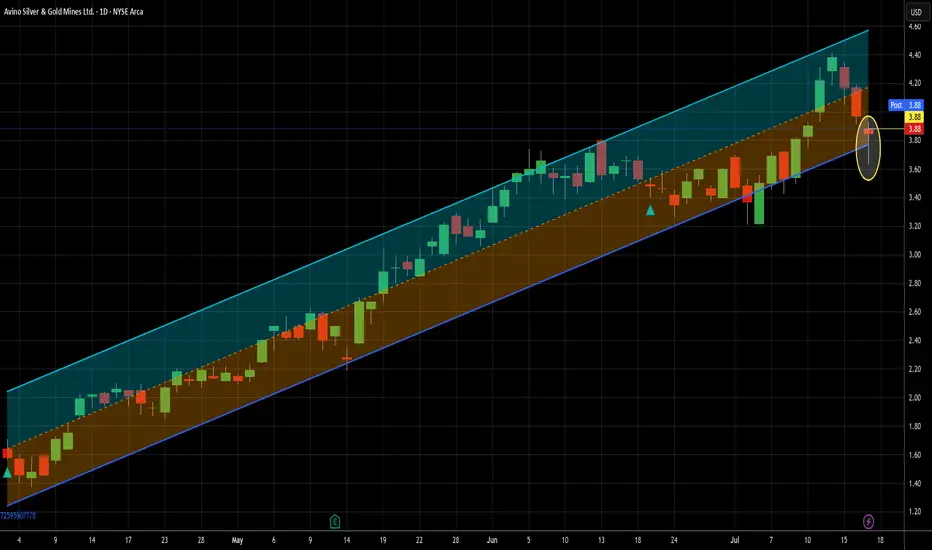
I'm just going to keep putting the hammer down - Long at 3.88I've done two other ideas for ASM in the last 3-1/2 months, so I'm not gonna rehash all those details here. If you are new to me or to my ideas for this ticker, just look at those. In them, I make a fairly compelling argument for short term trading this name. I'll sum it up quickly here - it's been extremely profitable. I'm expecting no different this time.
Since my last idea on June 20th, there has been only one buy signal on this name until this week, but that one paid 9.5% in two trading days. Today's signal is actually the 3rd in a row (not uncommon for this ticker) and full disclosure, I traded the other two so I'm in this already. That said, today's signal is extra spicy, thanks to that pretty little hammer of a candlestick that printed today. For those unfamiliar, it is often a sign of a bullish reversal. It requires confirmation, but given the perfect record my signals have provided to this point on ASM, I can justify not waiting for that confirmation as it can cause missed trades if the stock jumps 4 or 5% the next day, as it is fond of doing. But if someone were to jump in on this trade but wanted to wait for confirmation, I believe that the move here would last more than one day, should it happen.
I also have been increasing my exposure to inflation-related trades lately and why not get that from something that bumps like this does?
The solid uptrend that goes back well farther than this chart shows sweetens the deal even more. Given that my first recent signal clicked at the 4.17 level two days ago, I'm expecting a move to and beyond that level in the relatively near term, though that's obviously not a guarantee. I will likely get out of this leg of the trade before it gets there, unless it does it in one move, which isn't out of the question at all. That's only about 7.5% above the current price and this stock moves that much in a day semi-frequently. Twice in the last 7 trading days, in fact.
So that's my case. If the market stays semi-strong, this will likely stay weak until the market cools off some. This is my second add to my real life position, so I'm certainly not shy about adding more if my signals warrant it.
As always - this is intended as "edutainment" and my perspective on what I am or would be doing, not a recommendation for you to buy or sell. Act accordingly and invest at your own risk. DYOR and only make investments that make good financial sense for you in your current situation.
BONKUSDT: The Meme Coin Ready to Bounce! 📊 Key Stats (Live Update)
- Current Price: $0.000022
- Volume: $1.33M (Accumulation phase)
📈 Critical Levels
- Strong Support: $0.0000192
- Immediate Resistance: $0.000027
- Breakout Target: $0.00004 (+85% upside)
🔥 Why BONK Could Moon
1. Extreme Discount: 92% below ATH ($0.00003275)
2. Meme Coin Rally: WIF +12% today showing sector strength
3. Technical Setup: Bullish divergence forming
🎯 Trading Plan (Updated)
- Ideal Entry: $0.000019-$0.000020 zone 🚀
- Scalp Targets:
→ $0.000025 (+13.2%)
→ $0.000027 (+22.2%)
- Swing Targets:
→ $0.000028 (+40%)
→ $0.000035 (+75%)
- Risk Management:
→ Stop Loss: $0.000018
→ Position Size: 1-3% of portfolio
⚠️ Crucial Notes
1. High volatility expected - set alerts
2. Watch BTC dominance for market direction
3. Smaller exchanges may have price discrepancies
📌 Unique Opportunity
At current levels, BONK offers one of the highest risk/reward ratios in meme coins with:
- 80%+ upside potential to ATH
- Limited downside to strong support
🔍 Live Metrics to Watch
1. 4H RSI: 52 (neutral)
2. Volume Spike: $2M+ needed for breakout
3. Exchange inflows/outflows
---
NOT FINANCE ADVICE | DYOR always 💡 Visual Enhancements
Ready for the BONK resurgence? Would you like me to adjust the entry strategy for more conservative traders? 🐶

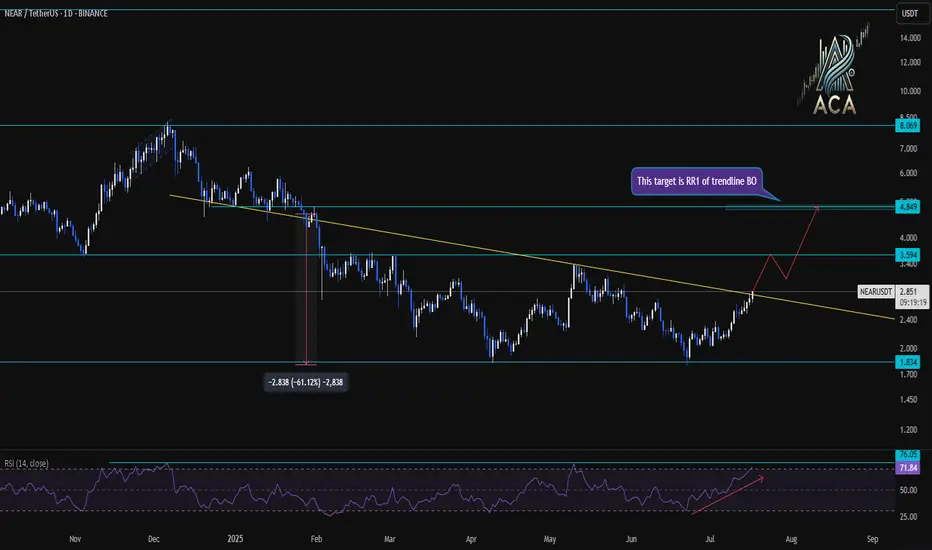
NEARUSDT Daily Chart Analysis|Strong Breakout & RSI ConfirmationNEARUSDT Daily Chart Analysis | Strong Breakout & RSI Confirmation
🔍 Let’s break down the latest NEAR/USDT daily chart, spotlighting critical resistance, target levels, and momentum signals.
⏳ Daily Overview
NEAR has confirmed a bullish breakout above its long-term descending trendline. This move comes with a surge in price and a strong daily candle—clear evidence of renewed bullish momentum.
📊 Momentum & RSI
RSI has surged to 76 (overbought zone), higher than the typical overbought level of 70. This spike reflects strong buying pressure, but also signals the possibility of near-term pullback or consolidation.
RSI-Momentum Convergence: The RSI uptrend is in lockstep with price action, confirming that bullish momentum is genuine and backed by increasing strength—not a divergence.
🔑 Key Levels
- First Resistance: $3.59—watch this closely as the next hurdle for bulls.
- Breakout Target: $4.85, which corresponds to the measured move (RR1) from the trendline breakout and aligns with the next horizontal resistance.
- Extension Target: $8.01 if momentum persists and price sustains above $4.85 in the coming weeks.
📌 Highlights
- Clear trendline breakout validated by strong RSI convergence.
- RSI has entered the overbought zone (76), backing momentum—watch for either breakout follow-through or brief cooling.
- Key levels: $3.59 (first resistance), $4.85 (breakout target).
🚨 Conclusion
Momentum is with the bulls after the breakout. Eyes on $3.59 as the near-term test; a clean move above opens up $4.85 and potentially $8.01 if momentum continues.
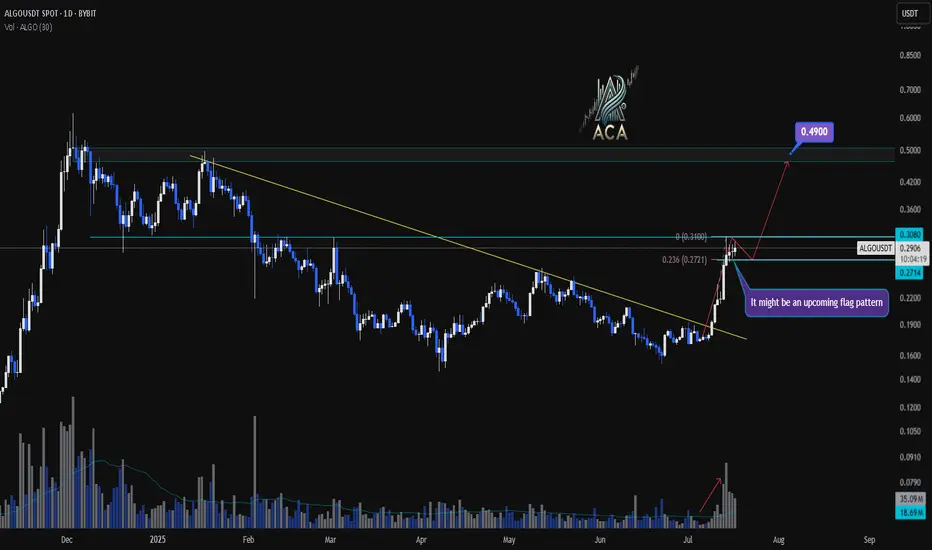
ALGOUSDT Daily Chart Analysis | Continuational patternsALGOUSDT Daily Chart Analysis | Momentum Picks Up on Higher Timeframe
🔍 Let’s break down the latest ALGO/USDT daily chart, highlighting a shift in market structure and key bullish signals.
⏳ Daily Overview
A decisive breakout above the long-standing descending trendline has flipped the narrative for ALGOUSDT. Increased volume during the breakout points to robust bullish momentum, suggesting buyers are regaining control at this multi-month inflection point.
🔔 Flag Pattern & Chart Structure
- Bullish flag pattern is emerging after the recent breakout, as price consolidates in a tight range—a classic continuation formation.
- Former trendline resistance is now acting as support, confirming a notable shift on the higher timeframe.
📐 Fibonacci & Target Levels
- The 0.236 Fibonacci retracement at $0.2771 is providing immediate support, with price consolidating above this anchor level.
- Upside targets:
- First resistance at $0.3080, which aligns with horizontal supply and previous pivot highs.
- If the flag pattern resolves upward, the next Fibonacci extension points to $0.4900, marking a significant confluence and potential for further gains.
📊 Key Highlights
- Strong daily candle and surging volume confirm momentum shift.
- Watch the developing flag pattern for breakout confirmation.
- Major trendline break on the daily signals structural reversal.
- $0.3080 is the immediate target; $0.4900 is the extended objective from the flag/Fibonacci alignment.
🚨 Conclusion
ALGOUSDT is setting up a compelling bullish scenario—keep a close eye on price behavior at the flag and $0.3080 level. A breakout may trigger the next impulsive move toward $0.4900.
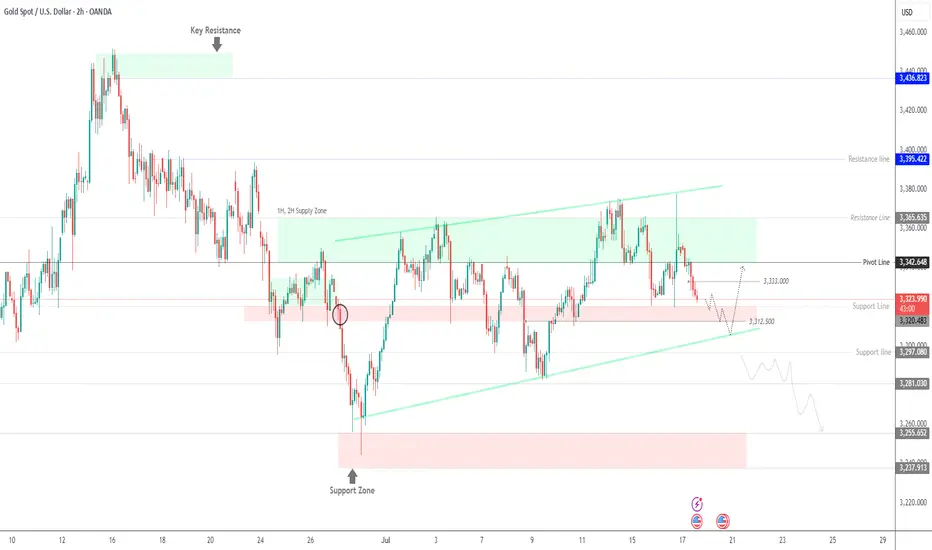
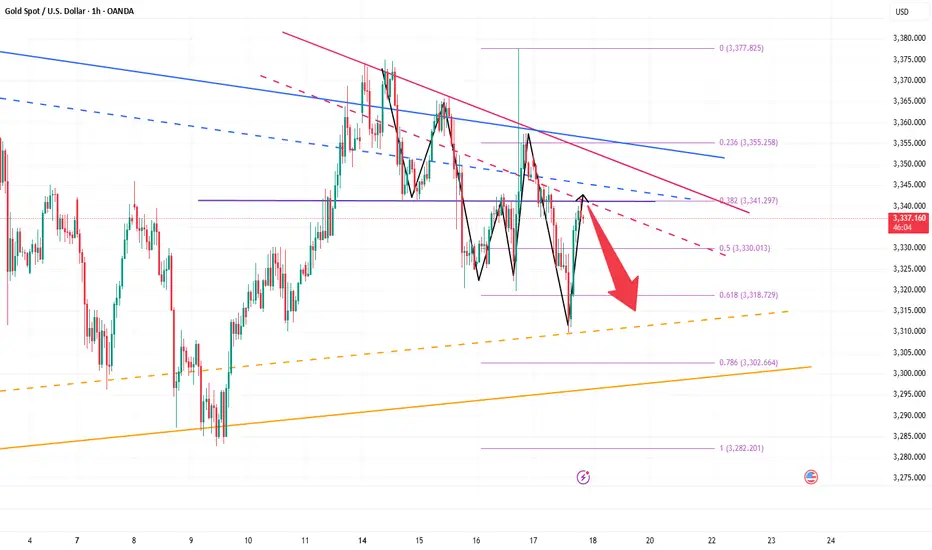
GOLD | Testing Key Support at 3320 — Breakdown or Rebound Ahead?GOLD: Futures Dip as Dollar Strengthens, Eyes on 3320 Support
Gold futures declined as the U.S. dollar gained strength following President Trump’s denial of plans to fire Fed Chair Jerome Powell. While concerns over central bank independence persist, gold remains up over 26% YTD, supported by strong central bank demand and ongoing macro uncertainty.
Technical Outlook:
The price is now approaching the 3320–3312 zone.
A break below 3312 would trigger a bearish move from 3315 toward 3297 and 3281.
However, if the price stabilizes above 3320 on a 4H close, a bullish rebound may follow toward 3333 and 3342.
Key Levels:
Support: 3312, 3297, 3281
Resistance: 3333, 3342, 3363
US30 | Bearish Pressure Builds Below 44,170 — Breakout or BounceUS30: Eyes on Earnings and News
US stocks edged higher pre-market after Trump denied plans to fire Fed Chair Powell, easing market concerns. With corporate earnings in focus, sentiment remains cautiously optimistic.
Technical View:
The price holds bullish momentum above 44170, targeting 44280 and 44500.
A 1H close below 44170 may lead to a drop toward 44075, and breaking below that would open the path to 43960 and 43630.
A 1H close above 44280 strengthens the bullish case toward 44500.
Key Levels:
Resistance: 44280, 44410, 44500
Support: 44075, 43960, 43630
previous idea:

SPX500: Calm Returns, But Bearish Pressure Lingers Below 6283SPX500 OVERVIEW
Markets Calm After Powell Drama
Markets steadied Thursday following Wall Street's volatile reaction to uncertainty over Fed Chair Powell’s future. While President Trump denied plans to fire Powell, he admitted discussing the idea with lawmakers and hinted he'd prefer a resignation. For now, earnings and data are back in focus.
Technical View:
SPX500 is consolidating between 6283 and 6223.
A 1H close above 6283 may trigger a bullish move toward 6341.
Remaining below 6283 keeps bearish momentum intact toward 6223, and a break below that could start a deeper downtrend.
Key Levels:
Support: 6243, 6223, 6195
Resistance: 6305, 6341

Bottom-out rebound, 3338 short orders enteredYesterday, the gold market was affected by Trump's remarks about firing Federal Reserve Chairman Powell. After briefly falling below 3320, the price quickly rose by nearly 60 points, reaching a high of 3377. Trump later clarified that the news was false, triggering a gold sell-off, and the market rose and fell. As of Thursday's European session, gold prices fell back to around 3320. After a rapid rise and fall in the US market on Wednesday, the downward trend continued on Thursday, with the US market hitting a low of 3310 before rebounding. Judging from the 4-hour chart, the Bollinger Bands failed to open downward, indicating that the current market lacks continuity and the overall market remains in a volatile pattern. In a volatile market, it is recommended to pay attention to key support and resistance levels for high-selling and low-buying operations. The upper resistance range is currently at 3343-3351, and the important watershed support level below is at 3310.
OANDA:XAUUSD

EURUSD - BEARISH TREND CONTINUESEURUSD - BEARISH TREND CONTINUES📉
On Tuesday, despite the bullish divergence (highlighted as green on RSI), the price broke through the trendline, formed since the beginning of May. Yesterday this trendline got retested on Bloomberg's rumor that Powell may resign. Currently the price is going through the support level of 1.16000.
I see the major way is to go towards 1.15000 support level with a further rebound and possible target of 1.16000. Another option is to go straight towards 1.14000. Will see.

Gold’s Last Stand? Major Retest at 3310–3300 Under the influence of negative news, gold today fell below the recent low of 3320 and continued to fall to around 3310. The current gold structure looks particularly obvious, the center of gravity of gold gradually moves downward, and the short trend is extremely obvious; however, as gold repeatedly probes the 3320-3310 area, we can clearly see the resistance of gold to falling, and multiple structural supports are concentrated in the 3320-3300 area. So as long as gold does not fall below this area, gold bulls still have the potential to rebound.
However, for now, after experiencing discontinuous sharp rises and falls, gold needs to undergo a short-term technical repair, so it may be difficult for a unilateral trend to appear in the short term. So I have reason to believe that gold will focus on rectification and repair next. The important resistance area we have to pay attention to above is in the 3340-3350 area; and the important support below is in the 3310-3300 area.
Currently, gold is fluctuating in a narrow range around 3340, and the short-term rebound momentum is sufficient, but I still believe that gold will fall back again and test the support of 3320-3300 area after consuming the bullish energy. So for short-term trading, first of all, I advocate shorting gold in the 3340-3350 area, and expect gold to retreat to the 3320-3300 area during the consolidation process.
EURUSD Bullish Continuation OutlookFX:EURUSD has been trading in a bullish trend. Currently price is retesting the previous resistance level, as well as 0.618 fib. Hidden bullish divergence can be observed on the chart, in addition to regular bullish divergence on lower timeframes (1 & 4 hour).
I am expecting bullish continuation from here to complete the price projections!

Gold pullback bulls are a winning streak strategy
💡Message Strategy
Gold prices experienced a roller coaster ride on Wednesday, mainly due to a Bloomberg report that Trump was considering firing Federal Reserve Chairman Powell (Trump wants to cut interest rates as soon as possible and the Fed is cautious). This quickly ignited the market's risk aversion sentiment, pushing gold prices up quickly by $50. However, after the rise, gold soon encountered resistance and gave up nearly $40 in gains, as Trump quickly denied the plan and the market's risk aversion sentiment cooled.
Gold prices fluctuated and fell on Thursday as Trump denied plans to fire Powell. Due to the rise in US CPI data released earlier, investors' expectations for the Fed's interest rate cuts cooled, which began to affect the market again. Looking ahead, investors still need to pay attention to the impact of Trump's tariff remarks and the Fed's monetary policy outlook on gold prices.
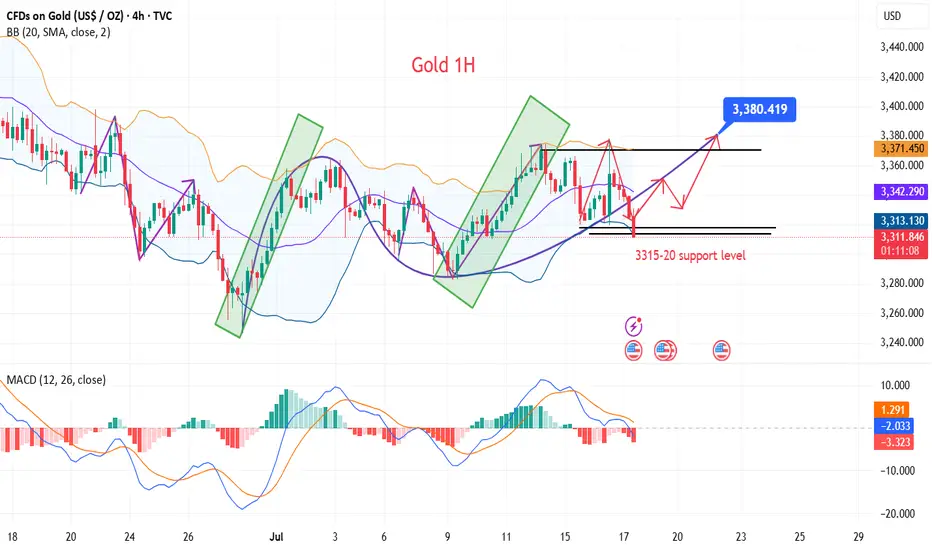
📊Technical aspects
After hitting a three-week high, gold prices fell back and continued to fluctuate in a wide range.
Gold is still in a bullish pattern. The support below focuses on Tuesday's low of $3,320, which is near the position where gold prices stabilized and rose in the Asian and European sessions on Wednesday, and near the position where gold prices fell and stabilized and rose in the US session on Wednesday. This is also the core position of our trading this week.
Gold's upper pressure focuses on the downward breakthrough of gold prices in the Asian and European sessions at $3,345, which is also the low point where gold prices quickly fell after rising on Wednesday. Secondly, focus on the intraday high of $3,375. The 5-day moving average slowed down after a slight golden cross, the MACD indicator slightly crossed upward, and the KDJ and RSI indicators formed a dead cross. The short-term technical aspect suggests that gold prices have a short-term upward trend.
💰Strategy Package
Long Position:3300-3315,SL:3280,Target: 3360-3370
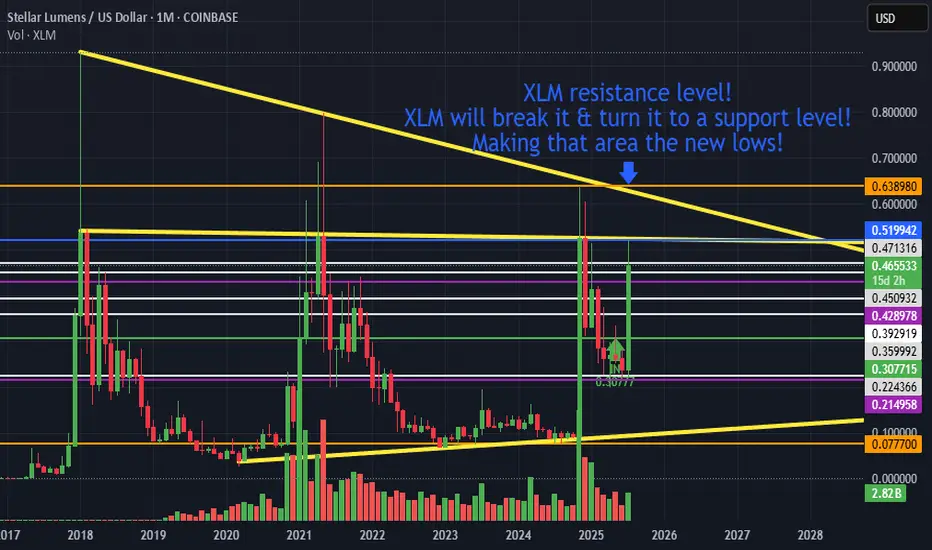
XLM new lows!XLM resistance level!
XLM will break it & turn it to a support level!
Making that area the new lows!
XRP’s Descending Trendline Showdown: Is a Breakout Toward $4From a purely technical‐analysis standpoint (not financial advice), here are a few observations and ideas you can take into xrp/usdt
1. Descending Trendline Resistance
- Price has been making lower highs, forming that yellow descending trendline. A sustained break and close above it (on higher‐than‐average volume) would be a strong bullish signal.
- If price rejects at the trendline again, that often implies more consolidation or another leg downward, so watch how price reacts if/when it retests that line.
2. Moving Average Context
- It looks like the market is hovering near or just below a key moving average (blue line). If the price can reclaim that moving average and stay above it, it typically signals renewed bullish momentum. Conversely, continued closes below it can cap upside.
3. Key Support Zones
- The pink/gray box in the chart (roughly the 2.0–2.1 area) seems to be an important support region; buyers have stepped in there before.
- Below that, the 1.77–1.80 area looks like a major support “floor” (dotted line). If price were to break below that, it could trigger a deeper pullback.
4. Potential Upside Targets
- The horizontal level around 3.40 is the next big resistance if price can break out above the descending trendline.
- If bulls really take over and push through that 3.40 zone, a run toward 3.90–4.00 (as shown by the arrow) becomes more plausible.
5. Watch Volume and Momentum**
- Pay attention to volume on any breakout. A low‐volume push above the trendline can be a fakeout, whereas a strong volume surge confirms conviction.
- Oscillators (RSI, MACD, etc.) can help you gauge whether momentum is building or fading as price approaches resistance.
Overall, a breakout above the descending trendline plus a reclaim of the moving average would favor upside toward the mid‐3s or higher. Failure to break out, however, might lead to another test of that 2.0–2.1 support or even the 1.77 floor. Keep risk management in mind either way.

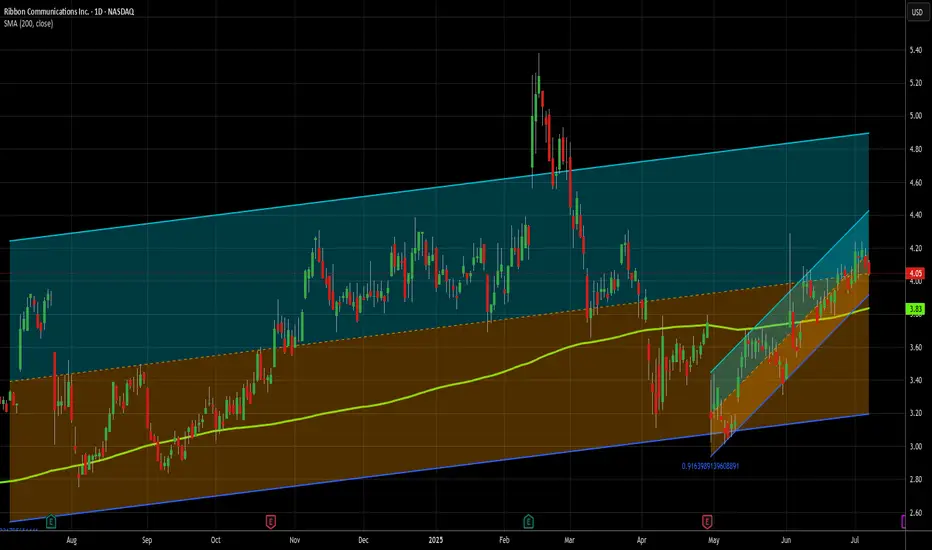
Small cap is the flavor of the day - Long at 4.05I decided to do a small cap stock today. I don't use too many of these as ideas, though I do trade them on my own. I don't usually publish about them because they are inherently more risky than large cap, established stocks. And to be fair, RBBN has a spotty history from a chart perspective.
Go ahead and zoom on out all the way. See that? That's what danger looks like. This stock has lost 80% of its value in the last 10 years, and 50% in the last 4. However, in its defense, it is profitable on a reported earnings basis over the last 12 months, and has held its own for several years now, and that's why I'm not AS nervous as I might otherwise be publishing this.
Additionally, it's solidly above its 200MA and in both a 1 year and 2 month uptrend, so its recent strength is good. I haven't dug down all the way back to its debut, but I suspect I'd have at the very least had a challenge making money on this one over its entire existence. But I am not trading its entire existence today. 75% of the trades in this stock in the last year would have closed in under 2 weeks, so the short term picture is what I'm mostly looking at here, and over the last month or so this has been a very solid stock. Could that change tomorrow? Yup. But I don't have that crystal ball. All I can do is rely on the system that has of late produced excellent results here.
In the last 12 months, there have been 27 buy signals here. 25 closed profitably and 2 are still open and down 18% and 9%, respectively. INCLUDING the losers, however, the median daily return on those trades has been .48% (>10x the market avg) and the average daily return is 1.02% (> 23x the avg daily market return).
Trading is about balancing risks and rewards. This stock is riskier than most, but the rewards are a lot better, too. I don't put all my money into any one trade - that's a TERRIBLE idea. The vast majority of my open trades are relatively safe, large cap stocks. But risky has its place in a portfolio. I made 15% in 2 days recently on QUBT (I posted that trade here) and made almost 18% on NUTX in the last 2 days - just closed that trade today. As a % of my portfolio of trades, ones like that can be small positions, but make a meaningful impact. That's my hope for RBBN here.
Of the 25 winning trades in the last year, over half produced a gain of 4% or more. And the average holding periods of the winners was only 8 days, with 15 of the 25 closing in a week or less. That rapid return also reduces the risk in a stock like this one. Wnen you only stick around for a few days most of the time, it's harder (not impossible) to get caught holding the bag during a drop.
My close will be signal based, and not a particular price target, but the trades I referred to above on RBBN give a good outline. However, the 2 losers have been open since February, so be forewarned that IF you follow me on this one, you might need to buckle your chinstrap. It could get bumpy.
As always - this is intended as "edutainment" and my perspective on what I am or would be doing and why, not a recommendation for you to buy or sell. Act accordingly and invest at your own risk. DYOR and only make investments that make good financial sense for you in your current situation.