Analysis and layout of the latest gold trends during the day📰 Impact of news:
1. PCE and Consumer Index
📈 Market analysis:
Judging from the 4H chart, the Bollinger Bands are closing and the MACD is showing a trend of forming a death cross, indicating that the short-selling momentum is still relatively strong in the short term. However, as the overall upward structure has not been destroyed, there is still a possibility of a rebound and repair in the future. During the day, we need to pay special attention to the support strength of the MA5 and MA10 moving averages. It is recommended to adopt the idea of shorting at high levels and going long at low levels. The key support below is the 3305-3295 area, and the upper resistance is the 3340-3350 range. However, judging from the chart, in the short term, there may be a rebound near 3313. At present, it has indeed rebounded to around 3319 as expected. If it falls weakly to this week's low of 3295, you can buy if it does not break. On the whole, if it rebounds to 3335-3345, you can consider shorting, and if the support below 3305-3295 is not broken, go long. Today is Friday, and as it is near the end of the month, market liquidity is strong. Please be cautious in your operations today and be sure to set stop losses strictly.
🏅 Trading strategies:
SELL 3335-3345-3350
TP 3320-3315-3300
BUY 3305-3295
TP 3310-3320-3330
If you agree with this view, or have a better idea, please leave a message in the comment area. I look forward to hearing different voices.
Trend Lines

Gold shorting opportunity not to be missedGold hit the key resistance of 3350 and then fell under pressure, reaching a low of 3309, and was temporarily supported by the low point on Wednesday. The intraday showed a pattern of rapid decline after a volatile rise, highlighting the long-short tug-of-war pattern. The hourly line fell again after a pullback to 3328, indicating that there is still room for short-term retracement. The current operation needs to focus on key points: short orders can be entered again near the pullback of 3328-3335. If the market continues to decline, focus on the support range of 3300-3290, and long orders can be arranged if it stabilizes. The overall idea of oscillation is maintained. Before effectively breaking through 3350 or losing 3290, high-altitude and low-long are still the main strategy.
Gold recommendation: short near 3328-3335, target 3315-3305

Bulls and bears are anxious? Rebound continues to empty📰 Impact of news:
1. Initial unemployment claims data
📈 Market analysis:
Gold is in a sideways consolidation near 3320 in the short term. The market has no clear direction for the time being, and the long and short positions are in a tug-of-war. The hourly line rebounded to 3328 and then fell back again, suggesting that there is still room for short-term retracement. The current operation needs to focus on key points: if it rebounds to the 3320-3330 resistance area, you can consider entering short positions again. If the market continues to decline, focus on the 3300-3290 support range. If it stabilizes, long orders can be arranged. The overall idea is to maintain a volatile market. Before effectively breaking through 3350 or falling below 3290, high-altitude and low-multiple is still the main strategy.
🏅 Trading strategies:
SELL 3320-3330
TP 3310-3300-3290
BUY 3310-3300
TP 3320-3330-3340
If you agree with this view, or have a better idea, please leave a message in the comment area. I look forward to hearing different voices.
OANDA:XAUUSD FX:XAUUSD FOREXCOM:XAUUSD FXOPEN:XAUUSD TVC:GOLD

The idea of oscillating crude oil
💡Message Strategy
Asia's crude oil imports hit a record high in recent years
In the first half of 2025, Asia's crude oil imports showed a significant increase. The average daily import volume in Asia reached 27.36 million barrels, an increase of 620,000 barrels from 26.74 million barrels in the same period last year, an increase of about 2.3%. The highlight of this growth was concentrated in June, when Asia's crude oil arrivals soared to 28.65 million barrels/day, setting a record high since January 2023, far exceeding 27.3 million barrels/day in May and 26.42 million barrels/day in June last year.
Import boom driven by price
What drove the surge in Asian crude oil imports in June? The answer has a lot to do with price. China and India are known to be extremely sensitive to crude oil price fluctuations, usually increasing imports when prices are low and choosing to shrink when prices are high. Crude oil arriving in June is usually scheduled six to eight weeks in advance of delivery, which means that these cargoes were purchased when oil prices were low in April and May.
Geopolitics and market uncertainty
The sharp fluctuations in oil prices in June are inseparable from the fueling of geopolitics. Israel's military action against Iran and the subsequent intervention of the United States once pushed crude oil prices to a five-month high. After Trump announced the ceasefire agreement, the market risk premium quickly subsided, but geopolitical uncertainty is still an important variable affecting oil prices. In the future, any new geopolitical events may push up oil prices again, which will further pressure Asia's import demand.
📊Technical aspects
The short-term trend of crude oil (1H) continues to fluctuate in a narrow range, with a small fluctuation. The oil price repeatedly crosses the moving average system, and the short-term objective trend direction fluctuates. The momentum is stalemate between long and short positions, and it is expected that the trend of crude oil will maintain a fluctuating consolidation pattern during the day.
However, crude oil is never that simple. It is greatly affected by international trends. At present, crude oil is still waiting for direction. So how can we obtain greater future returns in a volatile market?
The answer is simple. At this time, what we need to do is to use a small stop loss to leverage large returns within the pressure and support range.
💰Strategy Package
Short Position:67.00-67.20,SL:67.80,Target: 64.50-63.50/60.00
Long Position:64.00-64.20,SL:63.50,Target: 65.50-66.50/70.00

Gold Potential UpsidesHey Traders, in today's trading session we are monitoring XAUUSD for a buying opportunity around 3,300 zone, Gold is trading in an uptrend and currently is in a correction phase in which it is approaching the trend at 3,300 support and resistance area.
Trade safe, Joe.

GBPUSD Potential UpsidesHey Traders, in today's trading session we are monitoring GBPUSD for a buying opportunity around 1.37000 zone, GBPUSD is trading in an uptrend and currently is in a correction phase in which it is approaching the trend at 1.37000 support and resistance area.
Trade safe, Joe.

USDCAD Wave Analysis – 26 June 2025
- USDCAD reversed from the resistance zone
- Likely to fall to support level 1.3545
USDCAD currency pair recently reversed down from the resistance zone between the resistance level 1.3770 (former support from the start of May), upper daily Bollinger Band and the 50% Fibonacci correction of the downward impulse from last October.
This resistance zone was further strengthened by the resistance trendline from the start of February.
USDCAD currency pair can be expected to fall to the next support level 1.3545, which reversed the price in the middle of June.

DELL: Bullish Channel Breakout Targeting Prior HighsOverview:
Dell Technologies ( NYSE:DELL ) has exhibited significant price action over the past year. After a strong uptrend culminating in a multi-month high around the Target 145 zone in late 2024, the stock underwent a substantial correction. However, since its April lows, NYSE:DELL has initiated a robust recovery within a well-defined ascending channel, demonstrating clear bullish momentum.
Key Price Action & Patterns:
Prior Uptrend & All-Time High Test (August - December 2024): The initial phase of the chart shows NYSE:DELL in a strong ascending channel, culminating in a peak within the Target 145 zone. This zone represents a significant historical resistance level, being the prior peak before the subsequent decline.
Corrective Phase & Bearish Channel (December 2024 - April): Following the rejection at the 145 zone, NYSE:DELL entered a steep downtrend, breaking below key support levels and declining into April.
Bullish Reversal & Ascending Channel (April - Present): From its April lows, NYSE:DELL has embarked on a powerful recovery, forming a clear ascending channel. This pattern is characterized by a series of higher highs and higher lows, indicating sustained buying pressure.
Critical Levels & Current Status:
105 (Lower Teal Zone): This level has acted as a crucial support point within the current ascending channel, marking a significant higher low in the ongoing recovery phase. It represents a strong demand zone.
115 (White Line): This horizontal line served as an intermediate resistance level in late May/early June before being decisively breached. It now technically functions as immediate support, offering a potential retest level on any pullback within the current uptrend.
125 (Current Teal Zone): This is a highly significant pivot zone. It previously acted as major support in late 2024 before the breakdown and later as resistance during the early stages of the recovery. The recent price action shows a decisive breakout above this 125-resistance zone, signifying strong bullish conviction.
Target 145 (Upper Teal Zone): As the prior multi-month high, this zone remains the primary overhead resistance and potential upside target following the breakout from the 125 level. The dotted line projection illustrates a common post-breakout scenario, where price might retest the breakout level (125, now as support) before potentially moving towards the 145 targets.
Technical Outlook:
The recent breakout above the 125 resistance is a strong technical development, confirming the strength of the current uptrend within the ascending channel. This move suggests that buyers are in control and are aiming for higher price levels. The immediate focus shifts to the validation of the 125 level as new support, followed by a potential advance towards the Target 145 zone. Continued price action within the ascending channel and above 115 would reinforce the bullish bias.
Disclaimer:
The information provided in this chart is for educational and informational purposes only and should not be considered as investment advice. Trading and investing involve substantial risk and are not suitable for every investor. You should carefully consider your financial situation and consult with a financial advisor before making any investment decisions. The creator of this chart does not guarantee any specific outcome or profit and is not responsible for any losses incurred as a result of using this information. Past performance is not indicative of future results. Use this information at your own risk. This chart has been created for my own improvement in Trading and Investment Analysis. Please do your own analysis before any investments.

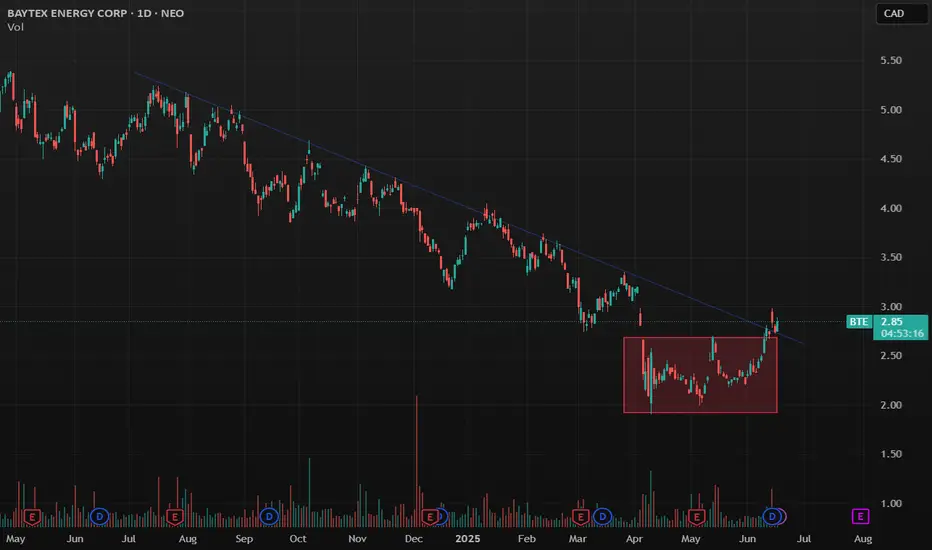
Baytex Energy is breaking out from trendline resistanceBaytex Energy just broke out from trendline resistance (July 12, 2025) from resistance that started back in July of last year.
It was a huge volume spike. The price is trading just above my resistance line today.
Earnings forecast for the next quarter is down and that's probably why it has reached a low recently assuming investors are forward looking.
Earnings forecasts are higher after the next report. So, I think it may have bottomed out already.
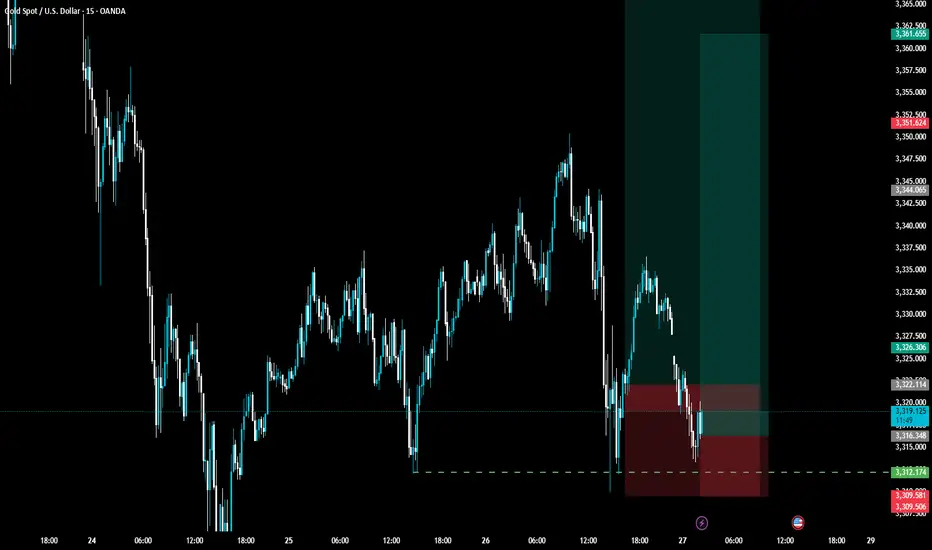
Possible movement on the near future, if it close under 3332If the prices closes under 3332 and we have enough volume in the markets we will hunt the liquidity in the 3320-3315 area, before a possible move to the upside.

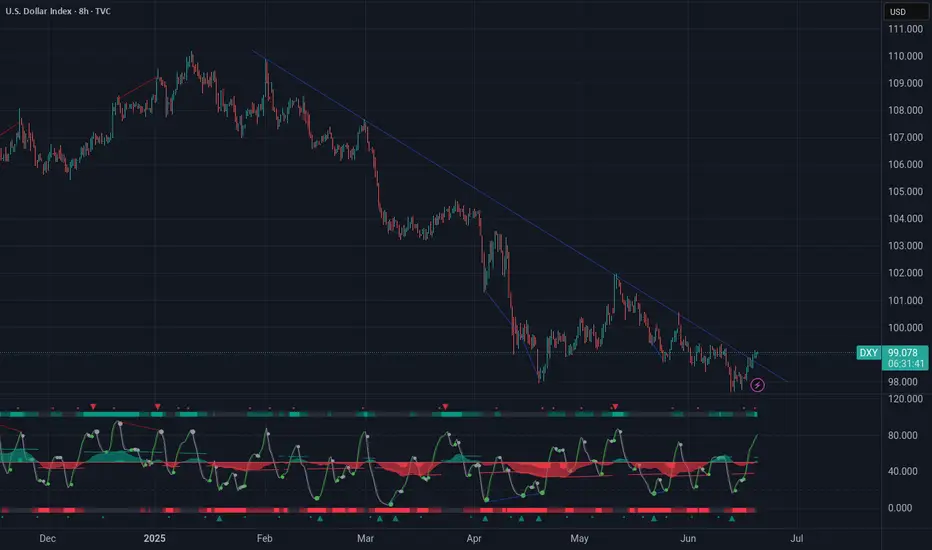
US Dollar is breaking out to the upsideIt looks like the US dollar is breaking out to the upside from a trendline resistance that started back on Feb 2025.
The breakout coincides with the passing of the Genius Act.
USDT.D is primed to fallI'd say USDT.D going to fall to at least 2.85%. That's the golden pocket of the previous uptrend.

AMZN: Bullish Momentum Meets Critical Resistance - What's NextOverview:
After a significant downtrend from its early February highs (a move initiated after breaking down from the "Flip Zone" around 232−238), Amazon ( NASDAQ:AMZN ) found a strong bottom in late April. Since then, the stock has been in a well-defined uptrend, characterized by a consistent series of higher lows and higher highs.
Current Market Structure:
The price action is clearly respecting an ascending "Trendline Support" (the shaded teal channel), indicating underlying bullish strength. Each pullback has found buyers around this trendline or the identified support levels.
Key Levels to Watch:
Key Resistance 220 (Red Zone):
This is the most immediate and critical hurdle for AMZN.
The price has tested this level multiple times in recent weeks (late May and mid-June) and faced strong rejections, indicating significant selling pressure or profit-taking at this psychological and technical barrier.
A decisive break and sustained close above $220 would be a highly bullish signal, suggesting a continuation of the uptrend.
Intermediate Support 205 (Lower Teal Zone):
This level has proven to be reliable support during recent pullbacks (early June and late June).
It acts as a key pivot point; as long as price holds above $205, the bullish structure remains intact.
Flip Zone (232-238 - Upper Teal Zone):
This zone is crucial from a historical perspective. It acted as strong support in early February before the major breakdown. After breaking, it effectively "flipped" to resistance (as seen with the red circle showing a rejection).
If AMZN successfully breaks above the "Key Resistance 220," this "Flip Zone" will likely be the next major target for buyers and a potential area for sellers to emerge.
Disclaimer:
The information provided in this chart is for educational and informational purposes only and should not be considered as investment advice. Trading and investing involve substantial risk and are not suitable for every investor. You should carefully consider your financial situation and consult with a financial advisor before making any investment decisions. The creator of this chart does not guarantee any specific outcome or profit and is not responsible for any losses incurred as a result of using this information. Past performance is not indicative of future results. Use this information at your own risk. This chart has been created for my own improvement in Trading and Investment Analysis. Please do your own analysis before any investments.

XAUUSD/GOLDThe bullish trend has opened. After the retracement is confirmed, continue to buy and wait for the market to rise and fill the gap.

SPA - Next Alt to MOON ??SPA is an altcoin that could make great increases in the near future.
Even though it's currently still trading under the moving averages in the Daily, once it turns there is good upside potential for this alt.
On the bright side, we observe higher lows for SPA:
One should also consider that this may be as good as it gets in terms of a low after the big dip, because a 47% correction is quite something:
IF that diagonal trendline of higher lows doesn't hold, I'd look at these zones next even if just for a wick:
And from here, we can really start to see BIG increases, IF you have the patience:
________________________
COINBASE:SPAUSD

Seize the rebound opportunity and prepare to short goldGold continued to rebound as expected and has now extended to above 3340. In the short term, it tends to fluctuate and rise. In the previous trading idea overnight, I emphasized that everyone should not take the risk of shorting gold near 3330. Now it seems that this reminder is completely necessary. Although gold continues to rebound, the overall performance of the bulls is still not strong, and the upper side is still under pressure in the 3350-3360-3370 area. So I still advocate that you can consider shorting gold in the 3350-3360 area after the rebound.
The Premium privilege of my account will end in 10 hours. Friends in the channel have already made a lot of money by following my trading strategy. Friends who have not joined yet can join and receive the latest trading strategies and trading signals as soon as possible to escort your trading!

Gold fluctuates at high levels, intraday trading points📰 Impact of news:
1. Initial unemployment claims data
📈 Market analysis:
Gold has begun to show signs of bottoming out in the short term in the past two days. Since the daily line bottomed out and pulled up, the daily line closed positive yesterday, and the bulls began to counterattack, and the 1H low was rising. If it doesn't fall further in the short term, it will most likely bottom out and rebound. The upper pressure is at the Bollinger middle track of 3355, which is also the high point of Tuesday's decline. If gold breaks and stabilizes at this price, it will have a larger upward space, and the upper side will look at 3385. In the 4H chart, MACD temporarily forms a golden cross, which is a bullish signal; but the BOLL track pressure is still there, and gold bears still have momentum in the short term. Therefore, on the whole, in the short term, gold should pay attention to the 3350-3360 resistance above. If it encounters resistance under pressure here, it can consider shorting. Pay attention to the 3330-3320 support area below.
🏅 Trading strategies:
SELL 3350-3360
TP 3340-3330-3320
BUY 3330-3320
TP 3340-3350
If you agree with this view, or have a better idea, please leave a message in the comment area. I look forward to hearing different voices.
TVC:GOLD FXOPEN:XAUUSD FOREXCOM:XAUUSD FX:XAUUSD OANDA:XAUUSD

GBP/USD Surges to Three-Year Highs- PCE on tapSterling held slope resistance for more than three-weeks with a defense of support this week attempting to mark an outside-weekly reversal candle. The advance is testing resistance today at the 2022 swing high near 1.3749 and the focus is on the weekly close with respect to this pivot zone.
Initial weekly support now rests with the June opening-range highs near 1.3633 and is backed by the 78.6 % retracement of the 2021 decline at 1.3414. Broader bullish invalidation now raised to the April high-week close (HWC) at 1.3270- losses below this threshold would suggest a more significant high is in place / a larger reversal is underway towards the 2023 HWC at 1.3092.
A breach / weekly close above 1.3749 is needed to keep the immediate advance viable with subsequent resistance objectives eyed at the 61.8% extension of the 2022 advance at 1.4003 and the 2021 HWC at 1.4158- both levels of interest for possible topside exhaustion / price inflection IF reached.
Bottom line: A breakout of the monthly opening-range takes GBP/USD into initial resistance at the 2022 swing highs with weekly momentum pressing into overbought territory today. From at trading standpoint, a good zone to reduce portions of long-exposure / raise protective stops- losses would need to be limited to 1.3632 IF price is heading higher on this stretch with a close above 1.3749 needed to mark uptrend resumption.
-MB

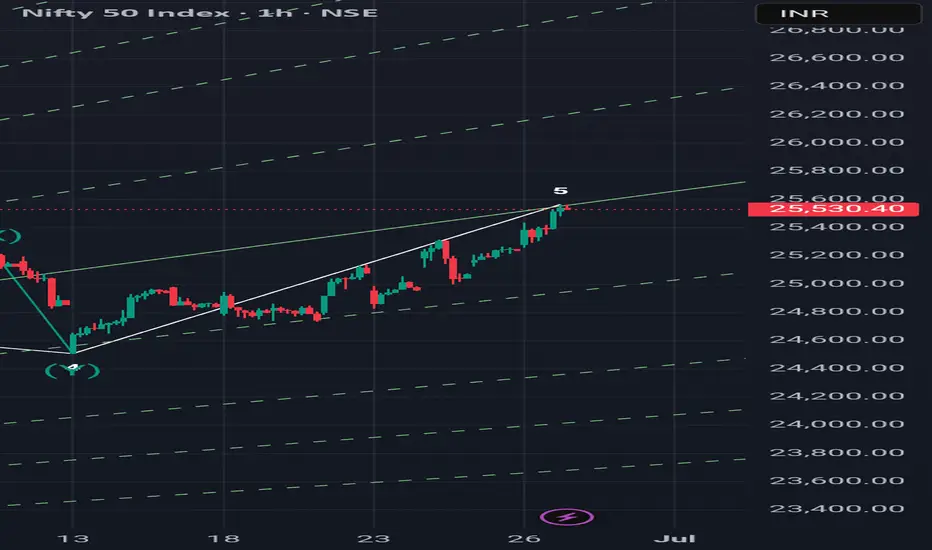
5 th wave done today? If Nifty does not able to cross 25600 by Monday and goes down after hitting today's high of 25565 then it is the indication of completion of wave 5th and now it is the end of extended flat correction ABC started from March. Many price action tools are also indicating this pivot 25565 as high. So the conclusion is this that there are 50% chances of ending of correction and we will get further confirmation after Friday's price movement.
Analysis of Trades and Trading Tips for the GBP/USDThe test of the 1.3614level occurred when the RSI indicator had already risen significantly above the zero line, which limited the pair's upside potential. For this reason, I did not buy the GBP/USD.
There has been progress in the trade negotiations between China and the United States: yesterday, both sides stated that consensus had been reached on the main issues. This breakthrough, the result of several months of intense discussions, gives hope for the stabilization of global financial markets. Though not disclosed in detail, the agreements likely included key issues such as the export of rare earth materials from China to the U.S. to China. Nevertheless, despite the optimistic statements, analysts advise against excessive enthusiasm. Previous negotiation rounds also ended with promises that were later unfulfilled. The key to success will be boss sides' ability to honor their commitments and show willingness for further concessions. The impact of this progress on the global economy is hard to overestimate. Reducing trade tensions could stimulate the growth of international trade, ease inflationary pressures, and bolster consumer confidence. However, risks remain, and the agreement's long-term outcome will depend on both countries' subsequent actions.
Today, we should pay attention to the speech by Philip Lane, a British Central Bank representative, as there are no macroeconomic releases from the the eurozone. Markets will closely monitor his rhetoric for hints regarding the central bank's plans on interest rates. Investors hope to hear more clarity from Lane about how the ECB intends to proceed with rates and whether the regulator plans further cuts this summer. Overall, Philip Lane's speech will be the key event of the day for financial markets. His comments may influence currency movements in the first half of the day. Investors are advised to watch his remarks closely and consider them in decision-making

ETERNAL| Buy @LTP | SL below 240 | Targets 326, 440Disclaimer:
This is not financial advice. Please do your own research or consult with a financial advisor before making any investment decisions. Investments in stocks can be risky and may result in loss of capital.

NZDUSD short ideaLooking to enter a short on NZDUSD area given the opportunity.
Key area requires breach either on 1H or 2H timeframe (clear candle closure). If market provides this , will be looking to enter as per analysis.
SK
