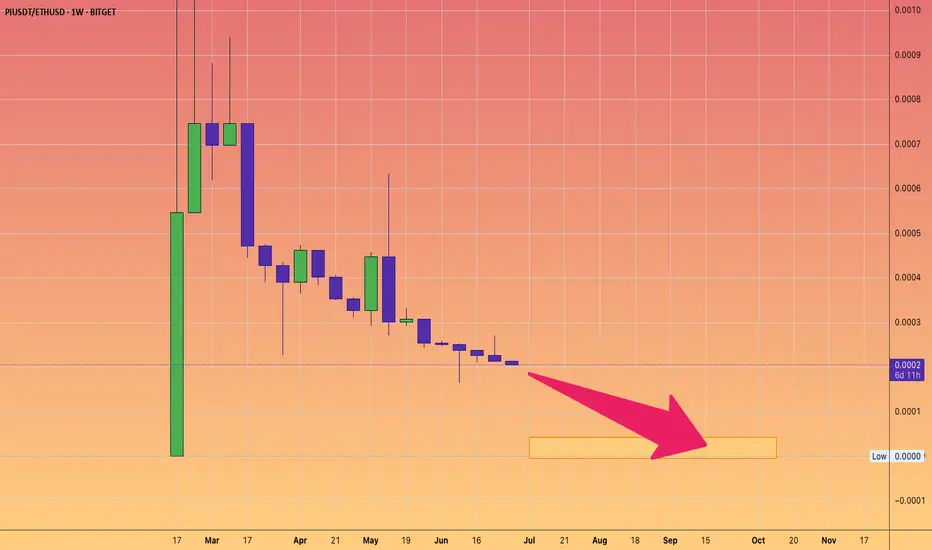
DON'T BUY Pi Network. It's a PUMP and DUMP.But feel free to short it if you desire.
This is Pi v ETH chart
It will continue it's trend to near ZERO.
Market makers will keep dumping into oblivion.
Trend Lines
OIL |Bearish Pressure Builds as OPEC+ Prepares Fresh Output Hike OIL | Market Overview
Oil prices edged lower on Monday despite strong seasonal demand, as the market prepares for an increase in supply. OPEC+ is set to raise production by 411,000 barrels per day starting Tuesday, marking the fourth monthly increase in output. Another similar hike is reportedly under consideration for August, which may further pressure prices.
Technical Outlook
The price remains within the bearish zone and is expected to continue its decline as long as it trades below the pivot level at 65.83.
A daily candle close above 65.83 is required to confirm a potential bullish reversal.
Until then, the bearish trend remains intact, targeting 63.47, 61.83, and potentially 60.16.
Key Levels
Pivot: 65.83
Support: 63.47 / 61.83 / 60.16
Resistance: 68.33 / 69.55

US 500 Index – Uptrend Channels, Support and Resistance CluesPositive price activity continues to materialise within equity indices, with several over recent sessions, successfully posting new all-time high trades.
The US 500 index is no exception, with at the time of writing (7.30am Monday 30th June) a new upside extreme just posted at 6208, see chart below.
However, such moves into new all-time high ground, which effectively is uncharted territory, can offer a challenge to traders. There is obviously difficulty in assessing where next resistance levels might stand. Just because an uptrend price pattern is evident and new all-time highs are being posted, doesn’t guarantee further price strength.
There will be levels where sellers, or resistance, are found again that might create at least a short term sell-off in price, even a more extended phase of price weakness.
However, how perhaps might we be able to judge where these levels may stand, when an asset is trading at price levels previously not seen?
Within technical analysis there is a tool that can potentially help traders gauge where next resistance might be encountered – The Uptrend Channel.
Let’s take look at uptrend channels and the US 500 index, and where possible clues might be offered to where both support and resistance levels may currently stand.
The Uptrend Channel:
We have previously discussed uptrends (and downtrends) in previous reports, so please look at our timeline for further details.
However, the basic definition of an uptrend line, is a straight line connecting previous price lows. In the chart below, we look at the US 500 index and have drawn a straight line connecting the 5095 low, posted on April 21st, with 5913, the June 23rd low.
This uptrend line today (June 30th 2025) stands at 6000, and traders may now be viewing this as a potential support to price weakness, if seen. It’s held on 2 previous occasions, April 21st and June 23rd, and may do so again, if price weakness approaches this line in the future. Please note, this is a rising trendline, so the support level will move higher each day.
Now look at the chart above again, you’ll notice we have also now drawn a trendline parallel to the lower uptrend line, which connects with the 5958 May 16th price high. This line also moves higher each day, as it too represents an uptrend and today stands at 6527.
While much will continue to depend on future market sentiment and price trends, if (and as we know within trading, it is a big if!) prices continue to move higher and post new all-time price highs, traders may be watching this uptrend channel pattern to suggest both potential support and resistance price levels.
They may argue that while support, which today stands at 6000, marked by the level of the lower limits of the uptrend channel, remains intact, potential might be for a more extended phase of price strength. Possible resistance could then be 6527, the current level of the upper limits of the uptrend channel.
Please remember, these levels will change daily, and you will need to refer to your own Pepperstone charts to update these levels on a daily basis, as they will change for each sessions.
Looking Ahead:
Today marks the end of a volatile but impressive second quarter for the US 500 index. It saw a low of 4799 on Monday April 7th in the thick of the trading carnage caused by President Trump’s trade tariffs, but since the 90 day tariff pause was announced on April 9th the index has rallied steadily to register a new all time high at 6208 in Asia this morning. That’s a bounce of 29% in Q2!
The start of Q3 isn’t likely to be without its challenges, however. There are concerns that President Trump’s $4.5 trillion tax bill, that is moving through the Senate currently, could increase the US debt burden to unsustainable levels.
Also, the July 9th tariff deadline is getting closer by the day and only 1 trade deal has been announced during the 90 day pause, despite lots of talk that 10 more deals, including India, Japan and potentially the EU are in the pipeline.
Updates on the health of the US economy this week in the form of Non-farm Payrolls on Thursday (1330 BST) and ISM Services PMI (1500 BST) could be critical if markets expectations for Fed rate cuts later in the year are to materialise, and the next earnings season for US companies begins in the middle of next week as well.
How this all unfolds could help to determine whether the US 500 keeps recording new all time highs or begins to unwind the recent upside moves as risk sentiment sours again.
The material provided here has not been prepared accordance with legal requirements designed to promote the independence of investment research and as such is considered to be a marketing communication. Whilst it is not subject to any prohibition on dealing ahead of the dissemination of investment research, we will not seek to take any advantage before providing it to our clients.
Pepperstone doesn’t represent that the material provided here is accurate, current or complete, and therefore shouldn’t be relied upon as such. The information, whether from a third party or not, isn’t to be considered as a recommendation; or an offer to buy or sell; or the solicitation of an offer to buy or sell any security, financial product or instrument; or to participate in any particular trading strategy. It does not take into account readers’ financial situation or investment objectives. We advise any readers of this content to seek their own advice. Without the approval of Pepperstone, reproduction or redistribution of this information isn’t permitted.

Gold has no chance to rise
Gold did not break through the upper pressure on Friday. Gold fell directly after opening on Friday. The bears broke through the previous 3295 support line, and the lowest reached 3255. It closed near 3274. The daily line also closed in the form of a big Yin line. The downward trend is obvious, and all the previous supports will also turn into pressure. The short-term moving average system crosses downward to accumulate energy for the bears, and the Bollinger Bands are also expected to open downward. Since the closing did not break through the upper 3300 suppression level, we will continue to rebound and short next week. After all, the technical side is still short, and only by following the trend can we keep up with our rhythm. We also pay attention to international news on the weekend. Combined with the news, I will analyze the specific strategy ideas before the opening of Monday. If your current gold operation is not ideal, I hope Yulia can help you avoid detours in your investment. Welcome to communicate!
From the 4-hour analysis, the upper short-term resistance is around 3295-3301, and the focus is on the important suppression of 3314-16. In terms of operation, the rebound continues to be short and follow the trend to fall. The short-term support below is around 3250-3255. The overall high-altitude participation is maintained in this range. I will remind you of the specific operation strategy during the trading session, so please pay attention to it in time.
Gold operation strategy:
Short at the rebound of 3295-3301, short at the rebound of 3314-16, stop loss at 3326, target at 3255-3260, and continue to hold if it breaks;

Seize the opportunity to short gold!Last week, we mentioned that if gold continues to fall, it will go to around 3245-3250. This position is 618 of the retracement from 3120 to 3450, and it is also the previous rising point. After the opening, it tested this position as expected and rebounded. If it continues to break down, it will gradually go to around 3225 and 3204. Last Friday, it opened weak and eventually fell to 3255. Although it rebounded at the end of the session, it was not enough to change the weak pattern. Today, we will focus on the rebound strength. The pressure is at 3291 and 3301. Short according to the rebound strength, and look at the 3245 support below. If it does not break, consider going long.
Gold operation suggestion: short around 3291-3001, target 3370-3360.

NZDJPY Potential UpsidesHey Traders, in today's trading session we are monitoring NZDJPY for a buying opportunity around 87.250 zone, NZDJPY is trading in an uptrend and currently is in a correction phase in which it is approaching the trend at 87.250 support and resistance area.
Trade safe, Joe.

NZDCAD Potential UpsidesHey Traders, in today's trading session we are monitoring NZDCAD for a buying opportunity around 0.82700 zone, NZDCAD is trading in an uptrend and currently is in a correction phase in which it is approaching the trend at 0.82700 support and resistance area.
Trade safe, Joe.

GOLD | Pressure Below Pivot – Eyes on 3255 and 3238GOLD | Market Outlook
The overall momentum remains bearish as long as the price trades below the pivot line at 3297.
Currently, the price is attempting to stabilize below 3281, suggesting a potential continuation of the downtrend toward 3270 and 3255.
A confirmed 1H close below 3255 would further strengthen the bearish scenario, opening the way toward 3238.
Sell Setup:
Valid if 1H candle closes below 3281→ Targets: 3270 and 3255
Buy Setup:
Valid if 1H candle closes above 3297→ Targets: 3314
Key Levels:
• Pivot: 3281
• Support: 3255 / 3238
• Resistance: 3297 / 3314

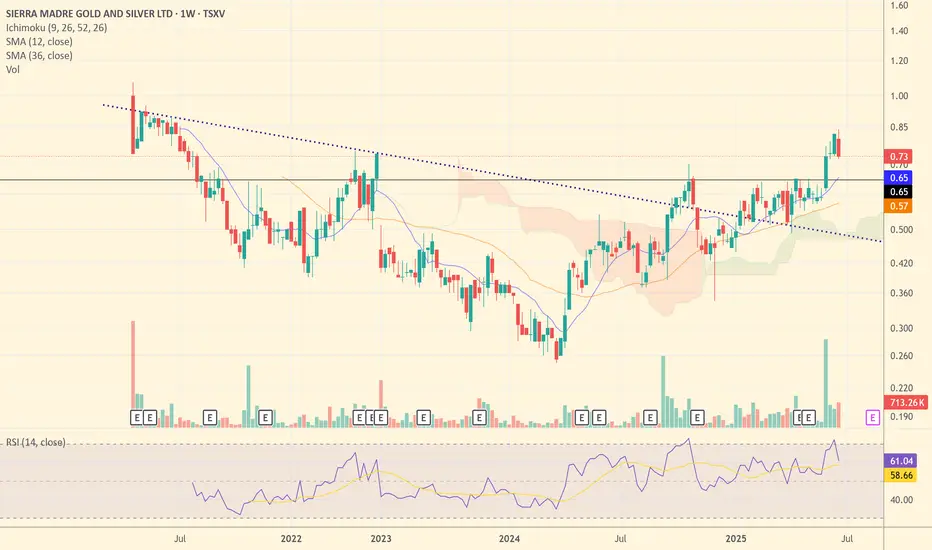
SM: Poised for Silver Alpha? - A Producer's Growth StorySierra Madre Gold and Silver (TSXV: SM) is shaping up to be a prime candidate for significant upside in a rising silver market. Having recently transitioned to commercial production and achieved positive cash flow in Q1 2025, SM has moved past the riskiest development hurdles and is now firmly in the "Production & Growth" phase of the Lassonde Curve.
Why SM Stands Out for Potential Upside:
- Operational Momentum: In Q1 2025, SM achieved positive cash flow with sales of 165,000 ounces of silver equivalent (AgEq), a critical milestone that validates the Guitarra project's viability.
- Improving Cost Structure: All-in Sustaining Costs (AISC) have been brought down to approximately $29/ounce AgEq. This efficiency directly translates to expanded margins as silver prices climb.
- Exponential Leverage to Silver Price: At a $40/ounce silver price scenario, SM's margin would jump to over $11/ounce AgEq. This significant increase in profitability is a powerful catalyst for share price appreciation, generating robust free cash flow for reinvestment.
- Clear Growth Catalysts: The company has ambitious plans to optimize operations, implement new flotation systems, and expand mill capacity to 1,200-1,500 tonnes per day. This could boost annual production to 2.5-3 million ounces of silver, creating substantial organic growth.
- Supportive Environment: A observed positive shift in the Mexican regulatory environment towards mining further enhances investment appeal.
Technical Analysis Snapshot:
SM's chart shows promising technical signs. After a period of consolidation (akin to a "valley" in the Lassonde Curve), the stock has recently experienced a breakout above a long-term downtrend line, signaling a potential shift from bearish to bullish sentiment. Volume accompanying this breakout is crucial for conviction. The stock appears to be establishing new support levels, indicating a potential accumulation phase. Investors should monitor for sustained trading above key moving averages and continued volume confirmation as indicators of a strengthening trend.
Risk-Reward Profile:
- Risk Profile: Medium to High (as a new, smaller producer with expansion execution risks)
- Potential Return at $40 Ag: Very High (due to dramatic profitability increase and accelerated growth)
Conclusion:
Sierra Madre Gold and Silver is well-positioned to capitalize on a bullish silver market. Its proven production, cost efficiency, and clear expansion roadmap make it a compelling candidate for significant price appreciation as silver prices head towards $40/ounce. For investors seeking "alpha" with a calculated approach to risk, SM offers a compelling growth story.
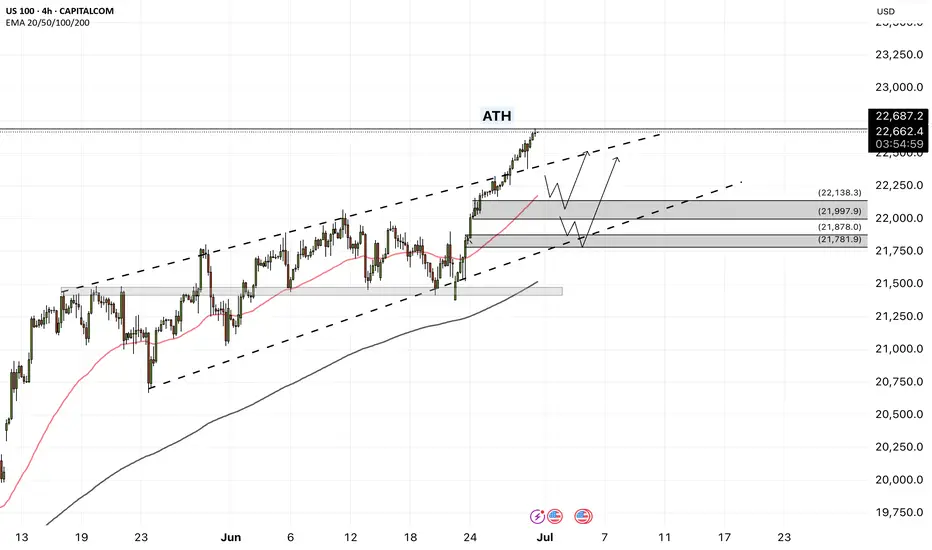
USNAS100 |Bullish Trend Holds Above Pivot – Eyeing 22790 & 23000USNAS100 | Bullish Movement
The price has stabilized above the key pivot level at 22640, confirming a continuation of the bullish trend toward the next resistance at 22790.
As long as the index remains above 22640, the uptrend is expected to extend toward 22790 and potentially 23000, with minor pullbacks likely to retest the pivot.
Currently, USNAS100 is consolidating between 22640 and 22790.
A 1H candle close below 22640 would signal a bearish correction toward 22520 and possibly 22410.
Pivot Line: 22640
Resistance Levels: 22790, 23000
Support Levels: 22520, 22410
previous idea:

PNB | Buy @110 | SL below 99 | Targets 135Disclaimer:
This is not financial advice. Please do your own research or consult with a financial advisor before making any investment decisions. Investments in stocks can be risky and may result in loss of capital.

ETH Ready for Lift-Off: Traders Eye +14% Surge Toward $2,813Ethereum has been consolidating in a large sideways range after recovering from a steep decline earlier this year. The chart clearly shows a defined support zone and key resistance area, with price currently trading just above mid-range and attempting to reclaim bullish momentum.
Chart Structure Highlights
• Support Zone: Around $2,231 – $2,232, which has been tested multiple times and held firmly, confirming strong demand here.
• Key Resistance / Take Profit Area: Near $2,813, a major level where price was repeatedly rejected in the past.
• Consolidation Box: A ~50-day range between support and resistance, suggesting accumulation.
• Recent Price Action: ETH is attempting to break out of the upper side of this consolidation, with buyers gradually stepping in.
Trade Setup
✅ Entry Zone: $2,450–$2,460
ETH is currently near this area, which represents a conservative breakout attempt from the range. Traders may look for confirmation candles closing above $2,460 for added conviction.
✅ Stop Loss: $2,231
Placed just below the lower edge of the support zone to protect against a failed breakout and renewed selling.
✅ Take Profit Target: $2,813
This is the key resistance level marked on the chart, offering approximately +14% upside from the entry.
Reward-to-Risk Profile
• Potential Reward: ~$353 (+14.3%)
• Potential Risk: ~$228 (-9.2%)
• Reward:Risk Ratio: ~1.55:1
Summary of the Setup
Ethereum has spent nearly 50 days consolidating between $2,230 and $2,813, and is now threatening a breakout to the upside. This creates a favorable swing trade scenario with a clear invalidation level below the strong support zone. A sustained move above the consolidation could target the $2,813 resistance in the coming weeks.

Bitcoin - Will Bitcoin Hit a New ATH?!Bitcoin is trading above the 50- and 200-EMAs on the four-hour time frame and is within its short-term descending channel. Bitcoin can be bought from the demand zone indicated. A break of the channel ceiling would pave the way for Bitcoin to rise to a new ATH.
It should be noted that there is a possibility of heavy fluctuations and shadows due to the movement of whales in the market and compliance with capital management in the cryptocurrency market will be more important. If the downward trend continues, we can buy within the demand range.
In recent days, Bitcoin has been trading in a range of around $107,000, and the market is going through a consolidation phase with complex but deeply fundamental characteristics. What matters at this point is not just the current price, but the precise mix of capital flows, the behavior of major players, on-chain data, and macroeconomic ratios that shape Bitcoin’s short- and medium-term trajectory. Overall, although Bitcoin’s rapid growth after the halving has stopped, internal market signals point to a continuation of the upward trajectory in a more stable framework.
The first important component is the significant influx of institutional capital into the market via ETFs. In the past week, according to CoinShares, more than $1.24 billion in new capital entered crypto products, with Bitcoin accounting for more than $1.1 billion. This marks the 10th consecutive week of capital inflows into the market, bringing the total inflows for 2025 to over $15 billion. Prominent ETFs such as BlackRock’s IBIT and Fidelity’s FBTC are attracting hundreds of Bitcoins per day, indicating steady institutional demand that has weathered the momentary volatility and is more focused on long-term asset building.
Alongside this capital inflow, the Onchain data also paints a mixed but highly interpretable picture. While the average active address rate has declined slightly and the MVRV (market value to realized value) has fallen from 2.29 to 2.20, these changes are more indicative of profit-taking by investors than selling pressure! In fact, rather than fear of a correction or crash, the market is witnessing a “gentle shift of ownership” between short-term and long-term holders. UTXO data also shows a roughly 5% increase in Bitcoin held for over 8 years, a strong sign of long-term accumulation and a decrease in the willingness to sell at current prices!
This can be seen as a period of supply and demand equilibrium; a period in which large investors have entered, but on the other hand, some older players are taking reasonable profits. This has led to a kind of price consolidation, which in June showed itself with only 2% growth—the weakest monthly growth since July last year. However, CoinDesk and Glassnode analysts rightly emphasize that this consolidation is not a sign of market weakness, but rather evidence of the maturity of Bitcoin’s price behavior. The price is reacting to data rather than becoming emotional.
From a macroeconomic perspective, Bitcoin remains highly sensitive to the Federal Reserve’s monetary policy, the value of the dollar, and interest rates. While the market is still waiting for interest rate cuts in the second half of the year, Bitcoin will remain in a quasi-expectant state until then, reacting to macro data, short-term and reactive. However, given that most ETFs follow long-term accumulation models, any stabilization in interest rates or easing geopolitical pressures could trigger a new wave of upside. Common analyst scenarios predict a range of $120,000-$130,000 for Bitcoin by the end of the summer if current conditions are maintained and capital inflows continue. In summary, Bitcoin is now at a stage where the dynamic combination of institutional accumulation, supply and demand balance, and on-chain data has transformed it from a purely risky asset into a strategic investment vehicle. The market has moved beyond the emotional phase and entered a phase of stability and maturity. This is a promising sign for long-term investors, provided that risk management is maintained and sensitivity to macro events is maintained. Bitcoin is preparing for the next stage of its rally—but unlike in the past, this time it is standing on the shoulders of fundamentals that are much stronger than at any time in the asset’s history.
ETFs with the most volume traded on Friday
Total: $501M
BlackRock: $153M
Fidelity: $165M
Grayscale: $0M

NAS100 - The stock market is breaking the ceiling!The index is above the EMA200 and EMA50 on the four-hour timeframe and is trading in its medium-term channels. If it does not increase and corrects towards different zone, it is possible to buy the index near the reward.
Following a strong rally in U.S.equities, the S&P 500 and Nasdaq indices both achieved new all-time highs on Friday. It marks the first time since February that the S&P 500 has surpassed its previous peak, while the Nasdaq entered fresh price territory for the first time since December.
Despite ongoing market focus on economic data and the Federal Reserve’s interest rate policy path, the simultaneous surge in both indices reflects a renewed appetite for risk in the stock market—an appetite that has been accelerating since mid-April, especially in tech stocks.
In contrast, the Russell 2000 index, which tracks small-cap U.S. companies, still remains significantly below its prior high. To return to its October levels, it would need to rise over 13.5%. However, Friday’s 1.7% gain suggests capital is beginning to flow more broadly into underrepresented sectors.
Analysts argue that a strong breakout in the Russell 2000 could signal a broader rotation toward increased risk-taking—possibly driven by optimism over future rate cuts, easing inflation, and improved business conditions in the second half of the year.
Now that the S&P 500 has reached new highs and the Nasdaq has joined in, attention turns to the Russell 2000. If it begins to accelerate upward, markets could enter a new phase of sustained bullish momentum.
Following a week focused on gauging U.S. consumer spending strength, the upcoming holiday-shortened week (due to Independence Day) will shift attention to key employment and economic activity data.
On Tuesday, markets await the ISM Manufacturing PMI and the JOLTS job openings report. Wednesday will spotlight the ADP private employment report, and Thursday—one day earlier than usual due to the holiday—will see the release of several crucial figures, including the Non-Farm Payrolls (NFP), weekly jobless claims, and the ISM Services Index.
Currently, investor reaction to Donald Trump’s tariff commentary has been minimal. Market participants largely believe that any new tariffs would have limited inflationary effects and that significant retaliation from trade partners is unlikely.
Friday’s PCE report painted a complex picture of the U.S. economy. On one hand, inflation remains above ideal levels; on the other, household spending is showing signs of fatigue—a combination that presents challenges for policymakers.
Inflation-adjusted personal consumption fell by 0.3%, marking the first decline since the start of the year and indicating a gradual erosion of domestic demand. While wages continue to rise, their impact has been offset by declining overall income and reduced government support. To maintain their lifestyle, households have dipped into their savings, driving the personal savings rate down to 4.5%—its lowest level this year.
On the inflation front, the core PCE price index—the Fed’s preferred inflation gauge—rose 2.7% year-over-year, slightly above expectations. Monthly inflation also increased by 0.2%. Although these figures appear somewhat restrained, they remain above the Fed’s 2% target, with persistent price pressures in services—particularly non-housing services—still evident.
Altogether, the data suggest the U.S. economy faces a troubling divergence: weakening household income and consumption could slow growth, while sticky inflation in the services sector—especially under a potential Trump tariff scenario—could limit the Federal Reserve’s ability to cut interest rates.

Analysis and layout of gold trend at the end of the month📰 News information:
1. Gold market liquidity at the end of the month
2. Impact of geopolitical situation
📈 Technical Analysis:
From the beginning of the decline of gold near 3338 on Friday to today's lowest point near 3244, gold has fallen by nearly $94. At present, gold has rebounded as expected. In the short term, I think we have two key areas to pay attention to. The first is the position of 3290-3295, which is a 50% rebound, and the second is the upper top range limit range of 3300-3320. Of course, if it breaks through 3280 and then retreats, it can also be long twice, but the current price rebounds, considering the position of the temporary low long position, there is not much trading opportunity. First look at the key areas given to find opportunities for shorting, and pay attention to the opportunity of retreating to 3280-3270 below.
🎯 Trading Points:
SELL 3290-3295
TP 3380-3370
SELL 3300-3310-3320
TP 3290-3280-3270
BUY 3270-3260
TP 3290-3300
In addition to investment, life also includes poetry, distant places, and Allen. Facing the market is actually facing yourself, correcting your shortcomings, confronting your mistakes, and strictly disciplining yourself. I hope my analysis can help you🌐.
OANDA:XAUUSD FOREXCOM:XAUUSD FX:XAUUSD PEPPERSTONE:XAUUSD FXOPEN:XAUUSD TVC:GOLD

SPX500 Extends Rally on Fed Hopes and China Trade DealS&P 500 Set to Extend Record Highs
U.S. stock futures climbed on Friday, continuing this week’s strong momentum on hopes of eased trade tensions and growing confidence in multiple Fed rate cuts later this year.
Futures tied to the S&P 500 and Nasdaq 100 pointed to fresh record-high openings, while the Dow Jones was set to rise by 150 points.
Adding to the bullish tone, Commerce Secretary Lutnick announced a trade agreement with China, reducing tariff risks and easing concerns over rare earth shortages.
TECHNICAL OUTLOOK – SPX500
The index has broken into new all-time highs (ATH) and stabilized above the 6,143 resistance level, confirming bullish strength.
As long as the price trades above 6,143, the uptrend is likely to continue toward 6,225, with potential short-term pullbacks to 6,143.
A 1H candle close below 6,143 could trigger a deeper correction toward the pivot zone at 6,098.
Key Levels
Resistance: 6,175 → 6,225
Support: 6,098 → 6,041
previous idea:

GOLD(XAUUSD): Bearish Trend Will Resume SoonGOLD appears to be bearish on an intraday chart following the violation of a key support zone.
The broken structure and descending channel resistance line now indicate a tightening supply area.
A significant bearish movement is likely to follow. The next support level is at 3249.

NATURAL GAS (NATGASUSD): Bullish Outlook Explained
Natural Gas is trading in a mid-term bullish trend on a daily.
The price updates higher highs and higher lows after each
test of a rising support line.
Its last test made the market form a strong rejection first
and a bullish engulfing candle then.
The market may continue growing and reach at least 3.7 resistance soon.
❤️Please, support my work with like, thank you!❤️

MarketBreakdown | EURUSD, GBPUSD, USDJPY, USDCHF
Here are the updates & outlook for multiple instruments in my watch list.
1️⃣ #EURUSD weekly time frame 🇪🇺🇺🇸
The pair is unstoppable.
The market violated a significant weekly resistance cluster last week.
It opens more growth potential after a pullback.
2️⃣ #GBPUSD weekly time frame 🇬🇧🇺🇸
In comparison to EURUSD, GBPUSD is now approaching a major
resistance area. I think that we can expect a retracement from that.
3️⃣ #USDJPY daily time frame 🇺🇸🇯🇵
The market continues a correctional movement lower.
The closest strong support that I see is based on a rising trend line.
I think that buying interest may spark again after its text.
4️⃣ #USDCHF daily time frame 🇺🇸🇨🇭
The price updated a historic low on Friday.
The next strong support that I see is based on a falling trend line.
We can expect a pullback from that.
Do you agree with my market breakdown?
❤️Please, support my work with like, thank you!❤️
I am part of Trade Nation's Influencer program and receive a monthly fee for using their TradingView charts in my analysis.


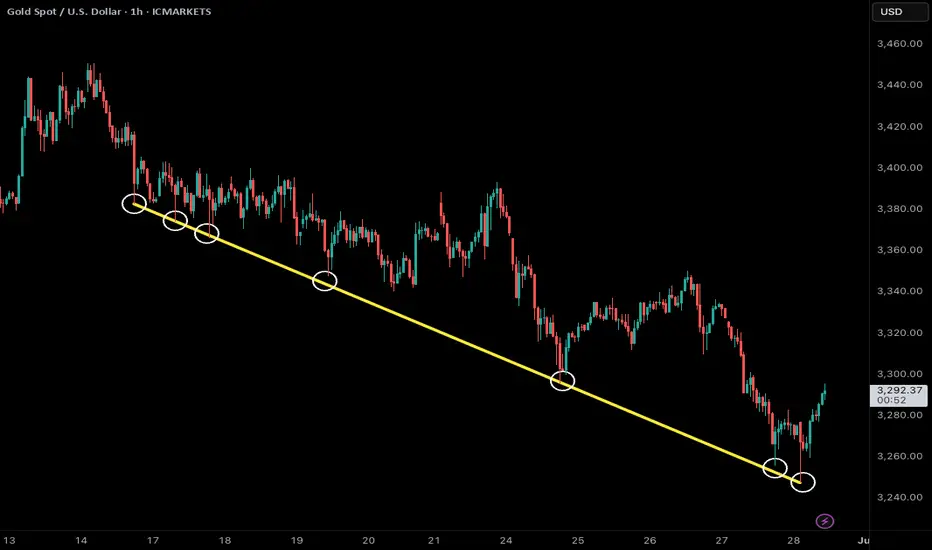
golden trend linegold price peaked on intraday h1 chart on 3450 level despite shocking war news
opposite to crowd consensus price came down last two week until crowd give up buying war news
but price was falling like text book from trend line
test bounce then new lower low
(price now testing h4 support 3245)
EURUSD – June 30th OutlookBias: Still bullish
Liquidity zone pullback: 1.16853 held as expected
Next move: Watching for break of Friday's high at 1.17342 → possible retest of 1.17311 → continuation upward
HRHR Setup: If price returns to 1.16853 today, it's a high risk play due to end-of-month volatility
Caution: If we break below the previous 4H candle, we could range between 1.17342 and 1.16853 for the remainder of the day.
🔹 Approach with caution — it’s the final trading day of the month.
