SHIBUSDT lowest and strong support is ahead As we can see price is near major daily support zone now and here we have one of the last daily supports which is currently touching and price can easily receive bull candles and start pump like green arrows if the supports hold.
DISCLAIMER: ((trade based on your own decision))
<<press like👍 if you enjoy💚
Trend Lines

USDJPY Potential DownsidesHey Traders, in today's trading session we are monitoring USDJPY for a selling opportunity around 146.700 zone, USDJPY is trading in a downtrend and currently is in a correction phase in which it is approaching the trend at 146.700 support and resistance area.
Trade safe, Joe.

S&P500 Potential UpsidesHey Traders, in today's trading session we are monitoring US500 for a buying opportunity around 6,075 zone, S&P500 is trading in an uptrend and currently is in a correction phase in which it is approaching the trend at 6,075 support and resistance area.
Trade safe, Joe.

This currency is likely to go down.It is moving within a very strong support resistance zone so we can expect it to sell again.

HelenP. I Euro will drop to trend line, after movement upHi folks today I'm prepared for you Euro analytics. If we look at the chart, we can see that EURUSD has been moving in a stable upward trend, supported by a clear ascending trend line. Each time the price approached this line, it rebounded and continued to grow, respecting the bullish structure. After the recent breakout from the support zone around 1.1500, the market made a strong impulse to the upside and reached a local high. Now, the momentum seems to be slowing down, which opens the possibility for a corrective movement. Given this setup, I expect that the price could first make a small upward push to trap late buyers, and then turn around to begin a decline. The trend line remains a critical technical level, and I anticipate the price will revisit it soon. For this reason, I’ve placed my goal at 1.1575 points — this area aligns with the trend line and can serve as the next support if a pullback occurs. As long as this level holds, the market remains in a bullish structure, but a correction seems likely before further growth. If you like my analytics you may support me with your like/comment.
Disclaimer: As part of ThinkMarkets’ Influencer Program, I am sponsored to share and publish their charts in my analysis.

HelenP. I Bitcoin can drop from resistance levelHi folks today I'm prepared for you Bitcoin analytics. If we examine the chart, we can see that the price has approached a significant resistance zone between 108200 and 108800. This area previously acted as a ceiling for the price, and now coincides with the retest of the broken trend line from above. After a strong bullish push from the support zone near 103000, the price is currently consolidating just below resistance, which often signals hesitation and potential reversal pressure. Earlier, we observed a period of consolidation around the support zone, followed by a breakout that broke above the trend line. However, the current structure suggests that the breakout may have been temporary. With multiple signs of slowing momentum and price failing to break convincingly through the resistance, a bearish move from this level becomes increasingly likely. Given the context, I expect BTCUSD to reject this resistance and move downward toward the 103000 support level again. That is my current goal, as I anticipate the price to complete a corrective wave in line with the overall structure. If you like my analytics you may support me with your like/comment ❤️
Disclaimer: As part of ThinkMarkets’ Influencer Program, I am sponsored to share and publish their charts in my analysis.

Is ADANIENT Ready to Fly? – With Detailed Analysis & TargetDisclaimer:
This is not financial advice. Please do your own research or consult with a financial advisor before making any investment decisions. Investments in stocks can be risky and may result in loss of capital.

highest ever weekly close : breakout on chartsHPCL witnessed its highest ever weekly frame close with a clean clear breakout
volumes are healthy with stock clocked more than 11% jump last week.
rsi witnessed healthy improvement and suggest the momentum to continue

CYPARK - 52 WEEK HIGH CYPARK - CURRENT PRICE : RM0.925
CYPARK made a NEW 52 WEEK HIGH on 26 JUNE 2025. It also breakout a significant down trendline - indicating strong bullish momentum. Nearest target will be the measurement of flag pattern price target which is RM0.980. Then if it continues to rise, RM1.02 will be second target. Stop loss level is RM0.850.
ENTRY PRICE : RM0.920 - RM0.930
TARGET : RM0.980 and RM1.02
STOP LOSS : RM0.850

DANGSUGAR LONG IDEARecently, the price of DANGSUGAR stock has broken out of a bearish trendline with a strong bullish weekly candle. This shows a strong intention to continue the buying momentum. To take advantage of the long opportunity, you can buy at the current market price while you can also wait for price to drop to N42.95. The stop can be at N37.70 while the target are N47.85 and N63.50 (final target). If this zone should fail, then the next long opportunity will be at N33.50 with a stop at N30.35 based on market structure.
Confluences for the long idea:
1. Trendline and resistance breakout with a strong bullish weekly candle.
2. Strong volume momentum on the volume indicator.
3. Market structure is bullish.
Disclaimer: This is not a financial advice. The outcome maybe different from the projection. Don't take the signal if you're not willing to accept the risk.

HelenP. I ARTY can break trend line and start move upHi folks today I'm prepared for you ARTY analytics. If we examine the chart, we can see that the price traded in "big" accumulation zone 0.2-0.3, then moved to small one 0.2-0.1 and being close to trend line. Arty looks like ready to show us bullish movement, break trend line and both accumulation zones. Along the way we encounter an intermediate level of resistance 0.75 which can be easily broken thought because of launch the first Play-and-Earn mode in Artyfact on June. This update will attract thousands of new players, which will significantly increase demand for ARTY and can boost price to both targets, 1$ and 1.5$ and above. If you like my analytics you may support me with your like/comment ❤️

GBPJPY Potential UpsidesHey Traders, in the coming week we are monitoring GBPJPY for a buying opportunity around 198.100 zone, GBPJPY is trading in an uptrend and currently is in a correction phase in which it is approaching the trend at 198.100 support and resistance area.
Trade safe, Joe.

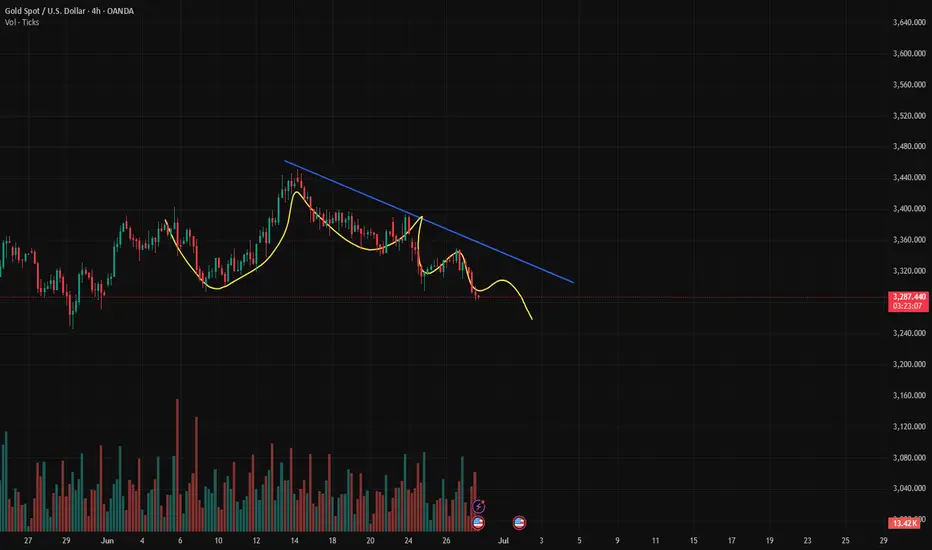
Gold is coiling for a breakout... All eyes on the next move!📉 Gold is currently moving within a minor descending channel.
In yesterday’s analysis, I pointed out the potential for a drop. Now, after a period of range-bound movement, I expect a breakout from this channel and a return to the main trend.
🎯 The first target on a reversal would be the top of the minor channel.
Keep a close eye on price action here — this zone could be key for the next move
OANDA:XAUUSD

GBPUSD Potential DownsidesHey Traders, in the coming week we are monitoring GBPUSD for a selling opportunity around 1.37400 zone, GBPUSD is trading in a downtrend and currently is in a correction phase in which it is approaching the trend at 1.37400 support and resistance area.
Trade safe, Joe.

TOTAL3 is getting squeezed. Breakout imminent?TOTAL3 seriously looks ready for a massive breakout. A move to the downside would be unfortunate, but the upside potential looks excellent!

Are we out of the woods? BTC has been trading above the golden pocket for three consecutive days. This should give us a technical target of at least 110k, where the next major resistance lies.

I'm a little nervous about this one - LONG QRVO at 83.02The chart is a mess. There's really no support close by after the big post earnings pop. 5 red candles in 6 days. Trump tariffs taking effect this weekend...nobody in their right mind should take this trade. So why did I?
A) I literally have only JNPR in my portfolio when it comes to tech, so I am underrepresented in the space.
B) anyone who follows me already knows what I'm about to say... my algo made me do it. 295-2 with an average gain of 1.93% in an average of 13 trading days (.15%/day - about 3.5x the average return of the market). It has had some rough trades in the last year (long holds and more lots of capital committed than I'd like), but this is a probability game for me, so I'm hoping it'll go as smoothly as my other trades have lately. I'm prepared for that not to be the case, though. I don't like what the market did today and I think it could be a bumpy ride next week. I may regret not just leaving this money in AMEX:BIL over the weekend, but that's the trading life. Wish me luck.
Per my usual strategy, I'll add to my position at the close on any day it still rates as a “buy” and I will use FPC (first profitable close) to exit any lot on the day it closes at any profit.
As always - this is intended as "edutainment" and my perspective on what I am or would be doing, not a recommendation for you to buy or sell. Act accordingly and invest at your own risk. DYOR and only make investments that make good financial sense for you in your current situation.

₿itcoin Dominance New Cycle High 66% ₿itcoin Dominance reaches new cycle high tapping 66%
If there's one thing I learned this cycle, it's never to sell your CRYPTOCAP:BTC for Alts.
If you want to play the casino, play with USD 💯

It’s the right time to make a golden layout!Gold opened at 3328 today and started the downward mode. After the European session, it continued to fall and broke the new low. The negative opening data of the US session also continued the downward mode. So far, it has reached the lowest point of 3255 and rebounded, but the strength is not very strong. After all, the upper pressure is still very strong. In the short term, we pay attention to the previous low point of 3295-3300, and focus on the upper 3305-3311. Today, the short-term operation of gold is mainly short-selling on rebounds, and long-selling on callbacks is supplemented.
From the 4-hour analysis, the upper short-term resistance is around 3295-3300, with focus on the important suppression at 3305-3311. The rebound will continue to be mainly short and look to fall back. The lower short-term support is around 3255-3245. Relying on this range as a whole, the main tone of high-altitude and low-multiple participation remains unchanged.
Gold operation strategy:
1. Short-selling in batches near the rebound of gold near 3295-3310, with a target of 3380-3370.
2. When gold falls back to around 3345-3455, go long in batches, with the target at 3370-3380.

XAUUSD/GOLD/SellThe pressure from the bears is too great. In the end, the pressure from above was not broken. Instead, it broke out and fell after being under pressure. The stop loss was hit.
The current price is 3285. After gradually boosting the US dollar index. The trend of gold prices has continued to fall. More importantly, the tariff issue has been eased. At the same time, geopolitical factors are also orderly and stable. This is the news that caused the bears to attack.
History has not become the savior because of repeating itself. Of course, this is also an emergency. In some transactions, the extremely low probability of causing losses is a common problem in transactions. However, our analysis team has stabilized a high trading win rate.
Then the next trading plan is still to focus on the pressure from above. If the London market rebounds above 3300. It is still mainly selling. 3314 is an important level for short-term rebound, and we need to pay attention. Although there is no obvious sign of rebound yet, the release of short-selling pressure has been alleviated because the decline is slow. Today's main trading idea is still to sell at high levels.
The target is to focus on the position of 3264-3248. Remember the risk of buying at low levels. Do not trade independently.
USDJPY Buy scalp analysis and sell swing analysisThis analysis is based on the daily and 4-hour timeframes and executed using reversal trading, trend formation, and supply and demand trading. Full explanation in the video!

USDCHF Buy analysis/ideaThis analysis is based on the Daily and 4-hour timeframes and executed using reversal trading and trend formation. Full explanation in the video!

GBPUSD Sell analysis/ideaThis trade is based on the daily and 4-hour timeframes and executed using reversal trading and trend formation. Full explanation in the video!
