AUD/USD Coils Below Critical ResistanceThe June range is preserved heading into the close of the month with a massive outside-weekly reversal taking Aussie back into key resistance on Friday. Note that momentum is approaching the 60-level for the first time this year and a break higher alongside a breach above 6550 could fuel a substantial rally here- watch the weekly close.
Initial support rests with the February high-week close (HWC) at 6357 and is backed closely by 6290/6315- a region defined by the yearly low-week close (LWC) and the 38.2% retracement of the yearly range. Note that the median-line converges on this level over the next few weeks and we’ll reserve this threshold as our bullish invalidation level- a break / weekly close below would threaten downtrend resumption toward the next major technical consideration at 6162/79.
A topside breach / close above this key pivot zone is needed to fuel the next leg of the advance with key resistance seen at the 2019 lows near 6670. Ultimately a break above the upper parallel (blue) would be needed to suggest a more significant trend reversal is underway with subsequent resistance objectives eyed at the 2024 HWC / yearly open near 6795-6810 and 6900.
Bottom line: An outside-weekly reversal has covered the entire monthly range with the Australian Dollar now testing critical resistance for an eighth-consecutive week. From a trading standpoint, losses should be limited to the 52-week moving average IF price is heading higher on this stretch with a close above 6550 needed to fuel the next move.
-MB
Trend Lines

Gbpusd Daily_TF Analysis within the bearish flag GBP/USD Daily Timeframe Analysis
1. The price is still trading within a bearish flag pattern on the daily chart.
2.Currently, the price is in a significant high on the higher timeframe.
3. There has been a recent breakout of resistance on the Daily Timeframe.
4. The breakout occurred at the same spot as the trendline breakout.
Expectation: We can anticipate a potential move to the downside for a retest of the previous resistance breakout level and the broken trendline. After a successful retest, the overall bullish trend may continue.

HTL is at the best level for taking a position.HTL is at the best level for taking a position.
It has already taken the Fib retracement, and is taking support from a trendline

AUDUSD Potential UpsidesHey Traders, in today's trading session we are monitoring AUDUSD for a buying opportunity around 0.65300 zone, AUDUSD is trading in an uptrend and currently is in a correction phase in which it is approaching the trend at 0.65300 support and resistance area.
Trade safe, Joe.

War is a Racket | DFEN | Long at $28.00The war machine keeps turning. Profits will reign. Direxion Aerospace and Defense 3x AMEX:DFEN never fully recovered from pandemic lows, but world peace is (unfortunately) far from reach. The uptrend in the chart has commenced. Personal entry point at $28.00.
Target #1 = $37.00
Target #2 = $50.00
Target #3 = $64.00

Make Dollar Great AgainDXY Big Picture
While looking at other DXY charts to use a clean chart for HTF, I saw that it touched historical trend support. It didn't touch only on the TVC chart, so I am adding it with the other charts and accepting that it touched the trend.
According to the fractal I added in August last year, the price is moving very well.
I expect a correction from these areas. I think we have reached the reversal areas due to both the momentum in the declines and the oversold.
The decline fatigue I mentioned is more evident in LTF charts. The price cannot reach the EQ zone of the decline channel that has been going on since February on the daily chart. Although it is a very inclined channel on the 4h chart, it can no longer reach the channel bottom. For this reason, I think this region is where reversal should be sought. After the first 0.38 of this decline, I think a pullback to 0.5 is possible.

ARTY - Play-and-Earn Launch Poised to Ignite Rally Toward $1.80Hi guys, this is my overview for ARTYUSDT, feel free to check it and write your feedback in comments👊
After consolidating in a flat range between $0.36 and $0.74 for months, ARTY triggered a bullish breakout, climbing rapidly toward $1.83.
Following this surge, price corrected back to the $0.27–$0.36 support area, which absorbed selling pressure and formed a reliable accumulation base.
On June 30th, Artyfact will launch its inaugural Play-and-Earn mode, poised to attract hundreds of thousands of new users and significantly boost ARTY demand.
This upcoming catalyst underpins the bull case, reinforcing buyers’ confidence and justifying another leg higher from current levels near $1.62.
Key downside support remains at $1.00–$1.08, where any retracements could offer favorable long entries ahead of resumed uptrend momentum.
My three upside targets are $1.00 for the first level, $1.40 as intermediate resistance, and $1.80 near the previous all-time high.
If this post is useful to you, you can support me with like/boost and advice in comments❤️

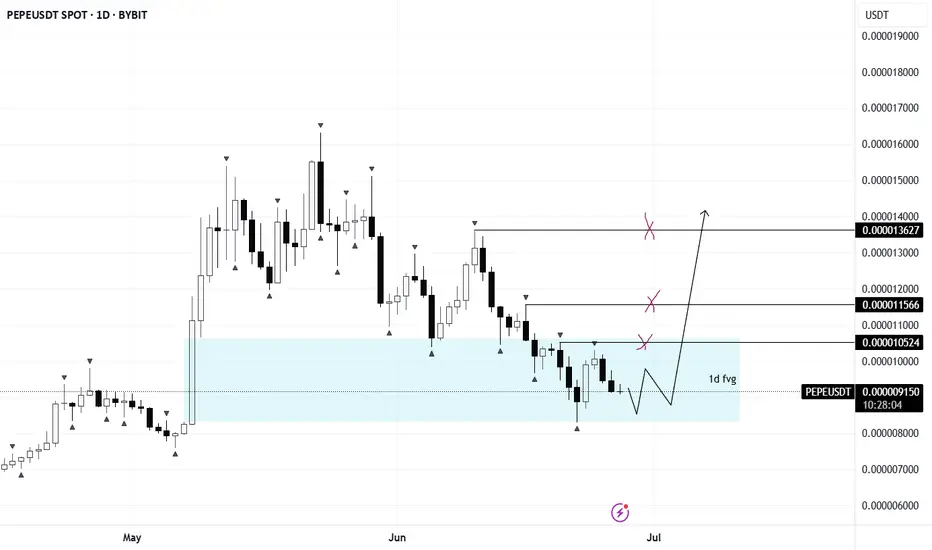
PEPE/USDTDaily FVG has been fully filled. Now watching lower timeframes for long entry conditions.
If confirmed, upside targets sit in the 105–136 range. Let the setup come to you — no entry without clear signals.
This Trendline Has Held Since January, Will Gold Finally Break?Gold (XAUUSD) is currently testing a key ascending trendline that has acted as dynamic support since early 2025. Today's price action shows strong bearish pressure, but confirmation is still needed as the daily candle has not yet closed below the trendline. A decisive close beneath this level would signal a potential shift in market structure and open the door for further downside. Fundamentally, mixed U.S. data adds to the uncertainty—while Personal Income (-0.4%) and Spending (-0.1%) came in below expectations, the Core PCE Price Index rose to 0.2%, suggesting lingering inflationary pressure.
If price breaks and closes below 3,260, I’ll consider a bearish continuation toward 3,200, 3,120, and possibly 3,000. However, if bulls defend this zone and reclaim 3,300+, a short-term bounce could still play out. For now, I'm staying patient and waiting for the daily close to confirm direction.

VOLTAMP | Detailed Analysis | with Target & Stop-lossDisclaimer:
This is not financial advice. Please do your own research or consult with a financial advisor before making any investment decisions. Investments in stocks can be risky and may result in loss of capital.

GOLD → Local bearish trend. Retest of support.FX:XAUUSD is technically looking a little weak. Support is being retested amid de-escalation of geopolitical conflicts in the Middle East. Interest in the metal is waning.
On Friday, gold remains under pressure ahead of data on the core PCE index, a key inflation indicator for the Fed. If inflation turns out to be higher than expected, this could strengthen expectations of a rate cut as early as July, supporting gold. The probability of a July cut is currently estimated at 21%, and 75% for September. Amid dollar volatility caused by rumors of a possible Fed chair replacement and trade negotiations with the EU and China, traders remain cautious, awaiting clarity on inflation and monetary policy
Technically, before falling, gold may form a correction to 3320 (liquidity capture).
Resistance levels: 3320, 3336, 3347
Support levels: 3293, 3271
If the fundamental background remains unchanged and gold continues to decline towards support at 3293 and break through this level, the breakout could lead to a fall to 3271. However, I do not rule out the possibility that after a sharp decline, a correction to 3320 could form before the fall.
Best regards, R. Linda!

USDCHF → Hunting for liquidity before the fallFX:USDCHF , against the backdrop of the falling dollar and the exit from consolidation, is forming another ‘bos’, which only confirms the market sentiment.
The fall of the dollar only increases pressure on the currency pair. The price has broken out of consolidation and is trading below the key level. USDCHF has broken through a fairly strong support level, which only confirms the bearish market structure. A correction is forming ahead of a possible decline (liquidity capture).
Resistance levels: 0.803, 0.8042
Support levels: 0.798, 0.79
Fundamentally and technically, the currency pair looks weak. The decline may continue after the liquidity capture phase and a retest of resistance. A false breakout of resistance will be a strong signal.
Best regards, R. Linda!

Gold Holds Above $3340 as Dollar Drops and Fed Uncertainty Rises GOLD OVERVIEW
Gold Holds Gains as Dollar Weakens and Fed Uncertainty Grows
Gold climbed above $3,340 per ounce on Thursday, supported by a sharp decline in the U.S. dollar amid growing dovish expectations from the Federal Reserve.
Adding to market speculation, U.S. President Donald Trump hinted he may announce a new Fed Chair as early as September or October, potentially reducing Jerome Powell’s influence before his term ends in June and boosting expectations for a more accommodative policy stance.
TECHNICAL OUTLOOK – XAU/USD
Gold shows bearish potential if the price can stabilize below the pivot level at 3,341.
However, while trading above 3,341, a short-term correction toward 3,364–3,365 is likely before any renewed selling pressure.
Today’s U.S. GDP release may add further volatility and direction to the market.
Key Levels
Pivot Line: 3,341
Resistance: 3,364 → 3,373
Support: 3,320 → 3,302
previous idea:

Gold fluctuates, operate at the right time!
💡Message Strategy
Trump called Powell "terrible" and said he was considering three or four candidates to replace Powell. Meanwhile, the Wall Street Journal reported that Trump was even considering announcing a potential successor as early as September or October.
The current mainstream narrative in the market is that once Trump nominates a new Fed chairman, market expectations will tend to favor a more "dovish" Fed. This in turn could lead to a weaker dollar, higher U.S. long-term Treasury yields, and higher stock prices.
Powell testified before the U.S. Senate on Wednesday that while Trump's tariffs could trigger a one-off price increase, the risk of sustained inflation is significant enough for the Fed to be cautious about further rate cuts.
Markets are now focused on U.S. GDP data due out that day and will closely watch personal consumption expenditures (PCE) data on Friday for further clues on whether the Fed will cut rates.
On the geopolitical front, a ceasefire between Israel and Iran appeared to hold on Wednesday. Trump hailed the swift end to the 12-day conflict at a NATO summit and said he would seek a commitment from Iran to abandon its nuclear ambitions in talks next week.
📊Technical aspects
From the 1-hour analysis, the upper resistance is around 3350. The intraday rebound relies on this position to continue the main short-term decline. The lower short-term support focuses on the 3300-3310 integer mark, and the upper pressure focuses on the 3350 mark.
The overall support relies on this range to maintain the main tone of high-altitude low-multiple cycle participation. The short-term long-short strength and weakness watershed is 3370. It is difficult to say that it is strong before the daily level breaks through and stands on this position. Pay attention to the specific operation strategy in time.
💰Strategy Package
Short Position:3340-3350,SL:3320,Target: 3310-3300
Long Position:3310-3320,SL:3290,Target: 3350-3360

Waiting for data release to rebound and short📰 Impact of news:
1. PCE and Consumer Index
📈 Market analysis:
The current price of 3280 has a higher profit and loss ratio advantage. Technical indicators show that the hourly chart is severely oversold. Combined with the top and bottom conversion of 3300 above, there is a 20-point rebound space in the short term. If the PCE data is in line with the trend, gold prices are expected to quickly regain the 3,300 mark. Note that negative data beyond expectations may cause a brief decline.
🏅 Trading strategies:
BUY 3295-3280-3275
TP 3298-3300-3310
SELL 3300-3310
TP 3290-3280-3260-3250
If you agree with this view, or have a better idea, please leave a message in the comment area. I look forward to hearing different voices.
TVC:GOLD FXOPEN:XAUUSD FOREXCOM:XAUUSD FX:XAUUSD OANDA:XAUUSD

XRP Bears Ready to Feast? Short Setup Targets $1.93 With 1.6:1RROn the XRPUSDT 4-hour chart, price action shows a clear rejection of higher levels and a transition to a bearish tone. After rallying up toward the 2.19–2.18 USDT resistance zone, XRP failed to sustain momentum and rolled over sharply. The Supertrend indicator flipped to red, signaling renewed selling pressure.
Currently, the market is retesting the 2.09–2.10 USDT zone, which previously acted as strong support but is now functioning as resistance. This is a classic bearish retest structure, often confirming further downside if price fails to reclaim the level decisively. Beneath the current price, the most significant support area rests near 1.93 USDT, where buyers previously defended with strong volume.
This backdrop supports a short-biased trade setup. The ideal entry would be around 2.09–2.10 USDT, where the market is testing the broken support as resistance. The stop loss should be positioned just above the prior swing high and the top of Resistance Level 2, at 2.19 USDT. If the rejection holds, the take profit target aligns with the clear structural support around 1.93 USDT. This setup offers a risk of roughly 0.10 per XRP and a potential reward of about 0.16, maintaining a sound risk-reward profile near 1.6:1.
While a bullish reversal is possible if XRP can reclaim 2.19 USDT on a strong daily close, current price action and trend signals favor sellers in the near term.

Dow Jones Retesting 43,020 | Bullish Bias Intact Above 42,810US30 OVERVIEW
Dow Jones Holds Bullish Momentum | Eyes on Retest and Continuation
US30 (Dow Jones) remains under bullish pressure, supported by recent macro developments and improving sentiment.
The price appears to be forming a retest toward 43,020, which could act as a springboard for further upside.
As long as the index trades above 42,810, the bullish trend remains intact, targeting 43,350, and potentially 43,765.
However, a confirmed break below 42,810 would shift the outlook to bearish in the short term.
Resistance Levels: 43,350 → 43,765
Support Levels: 43,020 → 42,810
Previous idea:

USNAS100 Hits New ATH | Watch 22,520 for Possible Correction USNAS100 TECHNICAL OVERVIEW
Nasdaq 100 Prints New ATH | Eyeing 22,640, But Correction Risk Builds
USNAS100 recorded a new all-time high, supported by broad bullish sentiment across U.S. indices after upbeat S&P and inflation data boosted risk appetite.
Technically, the index remains bullish, but signs of short-term exhaustion are appearing.
If the price closes below 22,520 on the 1H timeframe, a correction toward the 22,280 zone is likely.
However, a clean break above 22,640 would confirm continuation toward the next upside target at 22,790.
Key Levels
Pivot Line: 22,520
Resistance: 22,640 → 22,790
Support: 22,410 → 22,280 → 22,200
Take a look at the previous idea to see more reality...

Where will gold go?In 4 hours, it has fallen below the previous low of 3295, and will continue to fall. There are two supports below, namely 3280 and 3265. Don't expect a big rebound before going short in a negative market. If the rebound is large, it will not fall. This kind of negative decline is generally judged by the 15- and 30-minute patterns. When resistance appears in the big cycle, the market has actually fallen a lot.
Today, I think the pressure is mainly in the 3300 and 3310 areas. 3310 can be considered as the pressure of the top and bottom conversion. Pay attention to 3280 and 3265 below. If you consider going long, these two positions are the main positions. For the time being, the general direction is mainly short.

$NVO Trade Idea – Potential Bullish Reversal Setup📊 Market Structure Insight
After a clear downtrend marked by consecutive Lower Highs (LH) and Lower Lows (LL), NYSE:NVO is beginning to show early signs of a trend reversal.
🔹 Recent price action has shifted into a Higher High (HH) and Higher Low (HL) formation – a classic sign of bullish momentum building.
🔹 Price is consolidating above a major demand zone (~$60–68), which previously acted as strong support. Buyers are showing interest here again.
🔹 The RSI is rebounding from oversold territory, indicating growing bullish pressure and a potential momentum shift.
📈 Upside Scenario (Projection)
If the current HL around $67 holds, we could see a continuation of the uptrend targeting key levels:
TP1: $90 – Initial resistance / possible gap fill
TP2: $120 – Mid-supply zone and structure resistance
TP3: $147 – Macro supply zone and previous all-time high
🎯 Trade Setup
Entry Zone: $67–70
Stop Loss: Below $60 (beneath key support)
Targets: $90 / $120 / $147
⚠️ Invalidation
Breakdown below $60 would invalidate this bullish setup and signal possible continuation of the previous downtrend.
💡 Watch for confirmation on the next HL / HH combo. A clean breakout above recent highs would further validate the bullish case.

PENGU | Waiting for Trendline BreakPENGU/USDT is forming a classic descending triangle pattern with price consolidating near the lower support zone around 0.0060-0.0080. The key resistance level is the descending trendline (blue line) that has been capping recent rallies. RSI shows recovery from oversold conditions, suggesting selling pressure may be exhausting.
A decisive break above the trendline would signal a shift in momentum and potentially trigger the bullish scenario outlined by the red arrow projection. This breakout could target the upper resistance zone around 0.0220, representing significant upside potential.
The current consolidation near support provides a favorable risk-to-reward setup for patient traders. However, failure to break the trendline could see price retest the lower support levels. Volume confirmation on any breakout attempt will be crucial for validating the bullish thesis. Risk should be managed with stops below the recent lows around 0.0050.

CHFJPY: Strong Bullish PatternI observe a bullish accumulation pattern, specifically an ascending triangle, on CHFJPY chart.
In a strong uptrend, this pattern typically suggests a high likelihood of bullish continuation.
The next buy signal will come from a bullish breakout above the neckline of the ascending triangle on the 4H timeframe.
A close of a 4H candle above 180.94 will confirm this breakout, with the next target set at 182.00.

Technical outlook for the EUR/GBP pair!The EUR/GBP pair had been trading in a general uptrend on the 4-hour chart, forming higher highs and higher lows, until the recent pullback on June 24, 2025. During this decline, the price broke below the last higher low located at the 0.85257 level and recorded a lower low.
This recent drop suggests the end of the uptrend on the 4-hour chart and a shift toward a downtrend.
What is the next possible move?
A rise in price toward the 0.85607 level would be considered a corrective move before another potential drop targeting the 0.85241 level.
A rise above the 0.85749 level followed by a 4-hour candle closing above it would indicate a return to the uptrend and invalidate the negative scenario mentioned above.
