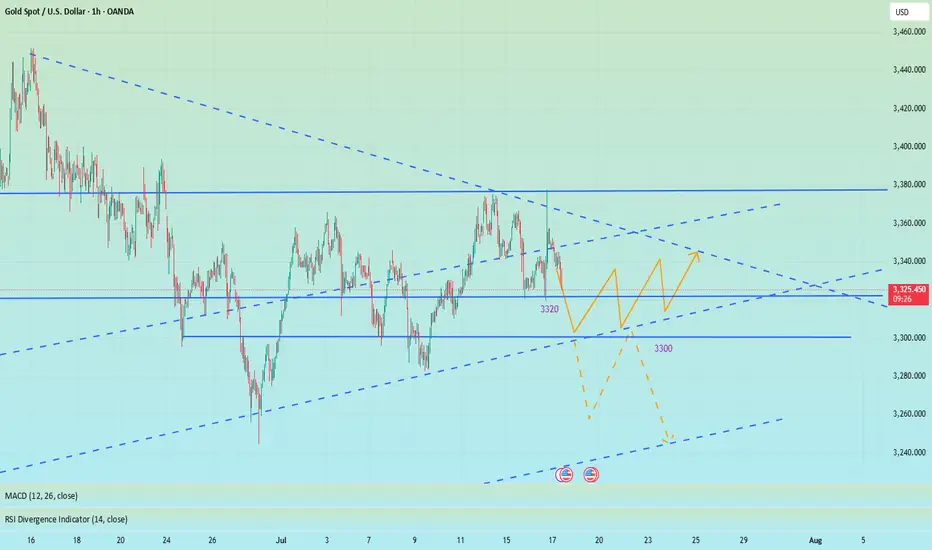
3340-3300: Lock in the buy high and sell low in this area!Under the influence of unemployment benefits and zero monthly sales data, gold fell sharply in the short term, but it did not effectively fall below 3310 during multiple tests, effectively curbing the further downward space of the shorts. Multiple structural supports are also concentrated in the 3310-3300 area, so as long as gold does not fall below this area, gold bulls still have the potential to rebound.
However, for the current gold market, it may be difficult to see a unilateral trend in the short term. After experiencing discontinuous surges and plunges, gold may focus on consolidation and repair, and the consolidation range may be limited to the 3340-3300 area.
So for short-term trading, first of all, I advocate going long on gold in the 3320-3310 area, and expect gold to rebound and reach the 3330-3340 area;
If gold reaches the 3335-3345 area as expected, we can start to consider shorting gold, and expect gold to step back to the 3320-3310 area during the shock and rectification process.
Trend Lines
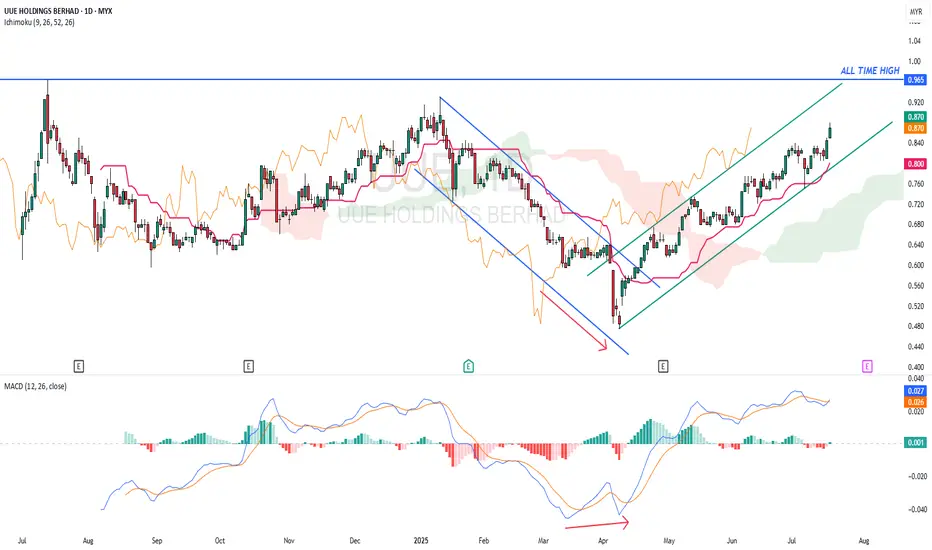
UUE - Potential hit All Time High ?UUE - CURRENT PRICE : RM0.870
The downtrend from January 2025 to April 2025 had changed to uptrend after the stock broke out the descending channel. Take note that there was a bullish divergence in MACD before the breakout of channel.
ICHIMOKU CLOUD traders may take note that the KIJUN SEN is rising steadily and CHIKOU SPAN also moving above candlesticks - indicating stock is uptrending. Today's closing price is higher than previous day's close suggesting a bullish breakout buy signal. A close below the KIJUN SEN may indicate a trend reversal (KIJUN SEN acts as support level).
ENTRY PRICE : RM0.865 - RM0.870
TARGET PRICE : RM0.930 , RM0.965 and RM1.03
SUPPORT : KIJUN SEN (cutloss if price close below KIJUN SEN)
Today’s main strategy: bulls take the lead, followed by bears!Yesterday, gold maintained a range of fluctuations. The game between bulls and bears was fierce but failed to break the current structure. The overall trend is not clear for the time being. From a fundamental perspective, risk aversion still dominates market expectations, which makes the gold trend lack a directional breakthrough. However, we need to be vigilant that the main funds may force the gold price to fall through extreme suppression in the future. From the 4-hour cycle, gold has been under pressure near the upper track of 3377 and has fallen continuously. It has fallen below the middle track support and touched the lower track. The current price is temporarily supported near the lower track, but the overall situation is still in a wide range of fluctuations. The trend has not yet formed. The short-term strength of the US dollar also suppresses the gold rebound. The current bulls and bears are anxious, and the key support and resistance have not been effectively broken. Currently, pay attention to the effectiveness of the support in the 3325-3320 area. If it pulls back to this area, you can consider a short-term long layout, and the target is the 3340-3350 range above. If it rebounds to this area, you can choose to stop profit and go short at the right time, and the target is the lower track area. If the downward momentum is strong, it may fall below yesterday's low to form a continuous decline.

DXY Trade Bias | Bullish Continuation Structure🔍 Chart Breakdown:
Trendline support respected
Order flow blocks (OBs) unbroken — confirming demand
Minor liquidity grabs without breaking bullish structure
Double mitigation of intraday OB, implying potential bullish continuation

Gold. Swing Signal ONLY no detail. 17/July/25XAUSD.. For the past I try to give as detailed as possible on my chart for learning purpose BUT end up fewer likes and "complicated" to understand comments.. I hope this time you are not getting signals only But nothings to learn...
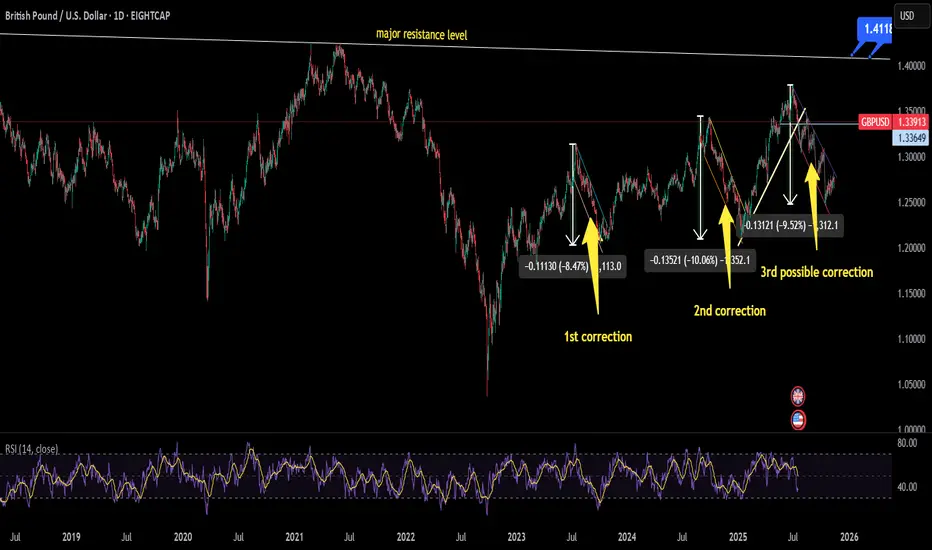
will GBPUSD make its 3rd correction???currently price is testing marked trendline which is acting as support level for a decent time if this level price will reverse its trend from here and will hit major resistance level which also has been drawn but if price action follows what it has done twice in the past then chances are that trend will enter in correction phase which is 3rd phase. In all this movement of DXY will play major role if DXY will continue to move upward pair will follow bearish trend and vice versa
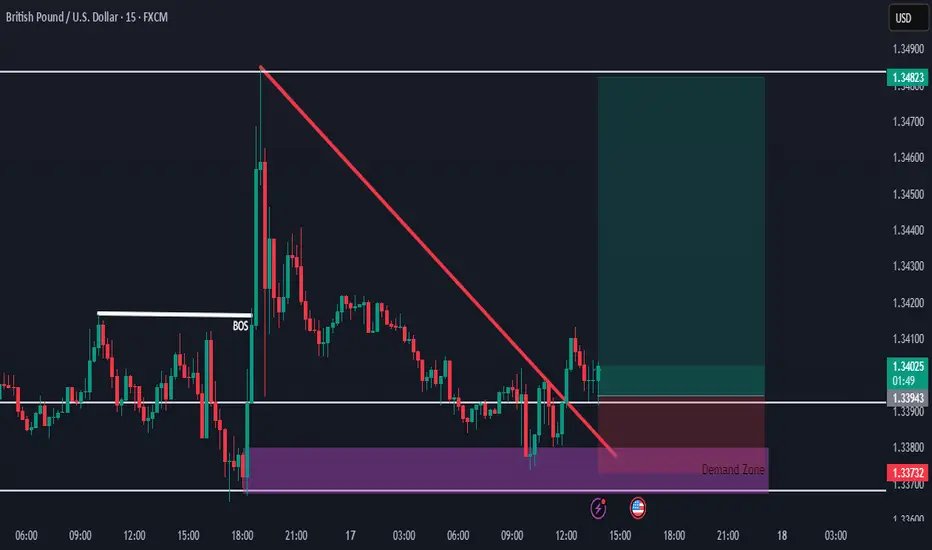
GBPUSD Buy Setup from Strong Demand ZoneHello everybody!
Price is in a higher timeframe demand zone, which is very strong and a good place to buy.
We were waiting patiently for confirmation, and now we have two key signals:
1- After a break of structure in the market, a small demand zone has formed.
2- The break of the downward trendline is where we entered the buy position.
Treat it as a long-short wash-out shock, and go long on pullback📰 News information:
1. Initial jobless claims data
2. June retail data
3. Beware of Trump's remarks about firing Powell
📈 Technical Analysis:
Last night, the daily line closed at around 3347. The current short-term daily line range is 3355-3300. The short-term support below is still 3320. Once it falls below 3320, it will look to 3310-3300. Short-term trading is still volatile. If the intraday retracement reaches 3320-3310, consider going long, and the defense is 3300, with the target at 3340-3350. Under the current rhythm of long and short wash, don't chase the rise and sell the fall, look at it rationally, and brothers who trade independently must bring SL.
🎯 Trading Points:
BUY 3320-3310
TP 3340-3350
In addition to investment, life also includes poetry, distant places, and Allen. Facing the market is actually facing yourself, correcting your shortcomings, facing your mistakes, and exercising strict self-discipline. I share free trading strategies and analysis ideas every day for reference by brothers. I hope my analysis can help you.
FXOPEN:XAUUSD OANDA:XAUUSD FX:XAUUSD FOREXCOM:XAUUSD PEPPERSTONE:XAUUSD TVC:GOLD
Powell's stay or departure affects the market, and gold is unlik
Yesterday, the Trump and Powell incident caused gold to rise strongly to around 3377. The rise of gold was just a moment. In the end, the gold daily line closed positive, but closed with a super long upper shadow line. In the end, the gold price quickly rose and broke through the 3377 mark, and then fell under pressure and fell into a shock closing. The daily K line closed high and fell back and fluctuated in the middle of the positive. Although the overall gold price repeatedly fluctuated and washed the market under the stimulation of the news, it ultimately failed to break through the recent large box shock range. Today we continue to pay attention to the support line of 3318-25 below. We will continue to go long if it falls back!
From the 4-hour analysis, today's short-term support below continues to focus on the vicinity of 3318-25, the short-term pressure above focuses on the 3340-45 line, and the key pressure above focuses on the 3380 line. The overall support range still maintains the main tone of high-altitude low-multiple cycle participation. In the middle position, watch more and do less, and follow orders cautiously, and wait patiently for key points to enter the market.
Gold operation strategy:
Gold falls back to the 3318-25 line and goes long, stop loss 3312, target 3340-45 line, and continues to hold if it breaks;

SOLUSDTThis chart BINANCE:SOLUSDT say to me that change of character. But we need to best confirmations for buy for example: pollback to 143 - 147 $ and higher high next pollback to level.
Support: 147 - 143 - 131.50
Resistance: 158 - 170 - 177 - 183
⚠️Please Control Risk Management in trades.

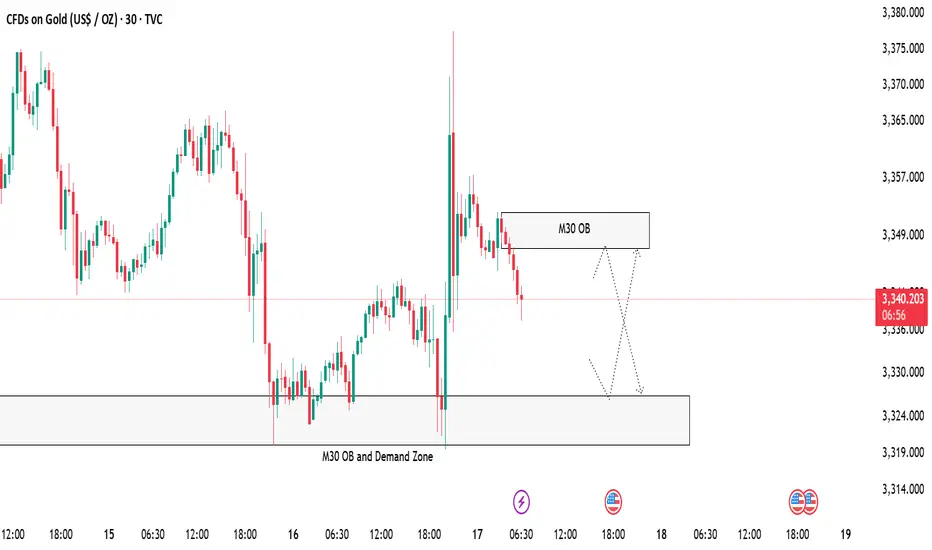
Gold 30-Minute OB and Demand Zone SetupGold is now approaching a 30-Minute Order Block along with a strong demand zone 🟢. We are expecting some clean reactions from these areas.
📌 Plan:
Scenario 1:
👉 If price respects the M30 OB and Demand zone area at 3327 -3320, we can look for bullish signs like rejection wicks or bullish candles to enter buy positions 📈, targeting the upper zone M30 OB zone near 3347 🎯.
Scenario 2:
👉 If price tap the above 30 min OB near 3347 we take our sell or short side entries for a reaction from there entering short ✅.
Both scenarios are possible, so we will watch the price action closely 🧐 and only trade with confirmation!
MarketBreakdown | EURAUD, GBPJPY, WTI CRUDE OIL, SILVER
Here are the updates & outlook for multiple instruments in my watch list.
1️⃣ #EURAUD daily time frame 🇪🇺🇦🇺
The market is trading in a bullish trend.
The price is steadily growing within a rising parallel channel.
A recent test of its support triggered a strong bullish reaction.
I think that a rise may continue at least to a current high - 1.8035
2️⃣ #GBPJPY daily time frame 🇬🇧🇯🇵
The market is consolidating within a narrow horizontal
parallel channel.
Consider consolidation, trading within its boundaries.
The next bullish wave will be confirmed with a breakout and a
daily candle close above its resistance.
3️⃣ CRUDE OIL #WTI daily time frame 🛢️
The market remains weak and consolidation continues.
I see a wide horizontal range where the price is now stuck.
I think that we may see a pullback from its support.
4️⃣ #SILVER #XAGUSD daily time frame 🪙
The market is retracing after a formation of a new higher high.
I see a strong demand zone ahead: it is based on a rising trend line
and a recently broken horizontal resistance.
The next trend following movement will most likely initiate from there.
Do you agree with my market breakdown?
❤️Please, support my work with like, thank you!❤️
I am part of Trade Nation's Influencer program and receive a monthly fee for using their TradingView charts in my analysis.

The firing of Powell set off the market, don't chase the longsTrump showed a draft of the letter to fire Powell, but whether Powell will be fired in the end remains to be seen, but the impact on the gold market is undoubtedly huge. The wolves have now smelled a very dangerous scent. Don’t chase high prices. Don’t chase high prices! ! ! After all, the impact of the news comes and goes quickly, and there is a high possibility of a reversal later in the evening. The final suppression position of the current gold daily line is 3340. If the closing line today can maintain above 3340, then gold will usher in a real bullish trend in the future.
OANDA:XAUUSD
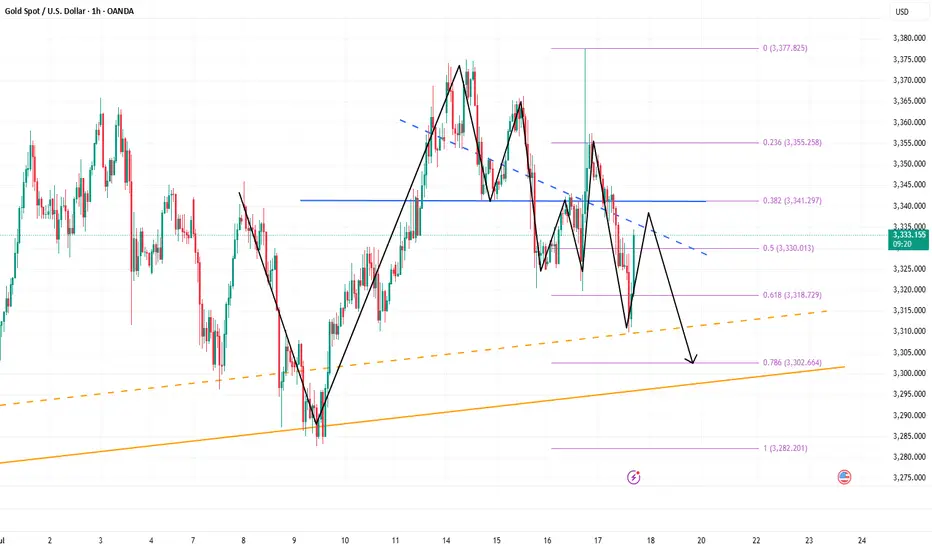
Gold Slips in London – $3,296 Incoming?📉 XAUUSD 1H Bearish Analysis – July 17, 2025
Gold (XAUUSD) is showing clear signs of bearish momentum on the 1-hour chart. After forming a local high around the $3,346–$3,347 region, price was sharply rejected and has since maintained a lower high structure. This rejection came right after the London session began, confirming that institutional volume is likely favoring the downside for now.
The previous few sessions show multiple failed attempts to break above the $3,346–$3,365 range. Sellers are consistently stepping in near those zones, marking a strong supply area. Meanwhile, recent candles have broken below the intraday support around $3,327.74, showing bearish continuation is underway.
Session activity is also in favor of the bears. The current London session opened weak, following a failure to hold above the previous session highs. Typically, gold experiences volatility during London and New York overlaps, and given the current structure, the pressure seems tilted to the downside.
From a broader perspective, the lower highs and lower lows on the 1-hour chart confirm a short-term downtrend. Price is now hovering just above $3,319 support—if this level is taken out cleanly with volume, it opens the path to deeper targets.
________________________________________
📌 Trading Setup (Short Bias)
• Entry: $3,327.74 (breakdown zone)
• Stop-loss: $3,346.29 (above last supply rejection)
• Take-Profit 1: $3,319.69
• Take-Profit 2: $3,311.62
• Take-Profit 3: $3,296.28
• Take-Profit 4 (extended): $3,282.66
________________________________________
If price manages to hold below $3,328 with consecutive rejections on any pullback, this bearish thesis remains valid. A breakdown below $3,311 would likely trigger momentum-driven selling toward $3,296 and potentially $3,282. However, any 1H close back above $3,346 would invalidate the current setup and favor a temporary bullish retracement.

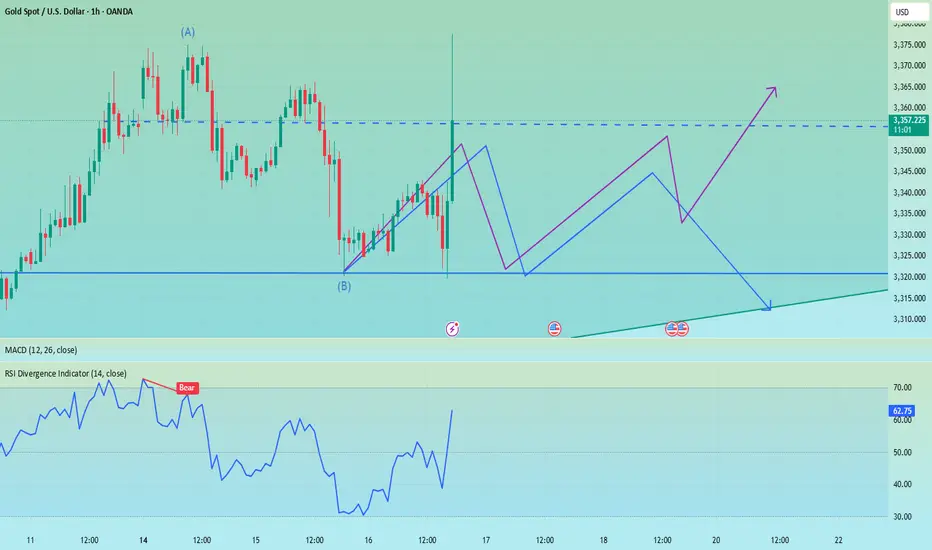
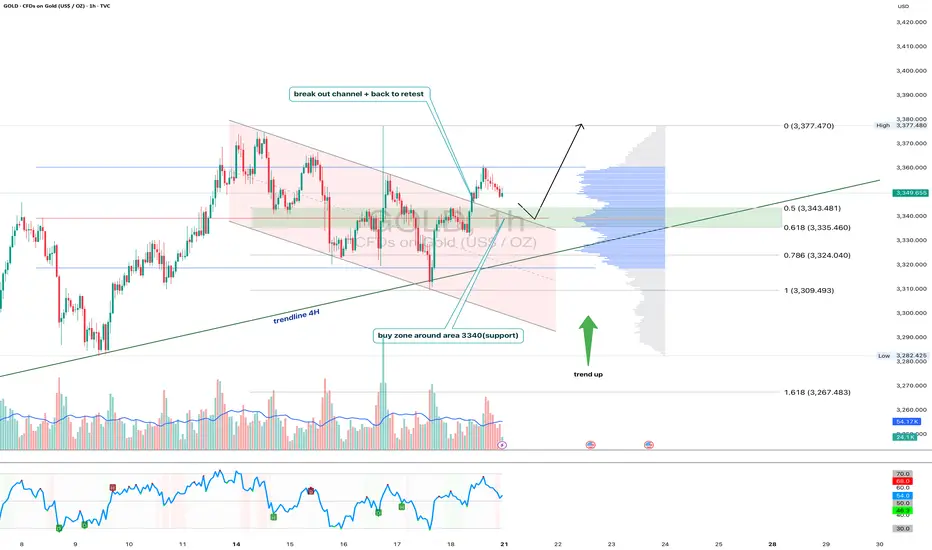
Gold 1H - Retest of channel & support zone at 3340After breaking out of the falling channel, gold is currently retesting its upper boundary — now acting as support. The 3340 zone is particularly important as it aligns with the 0.618 Fibonacci level and high volume node on the visible range volume profile. The price action suggests a potential bullish rejection from this area. With both the 50 and 200 EMA below price on the 1H, the short-term trend remains bullish. The 4H trendline further supports this setup. RSI is cooling off near the neutral zone, leaving room for another leg higher toward the 3377 resistance zone. If 3340 fails, 3324 (0.786 Fibo) becomes the next line of defense. Until then, the structure remains bullish following the successful breakout and retest of the channel.
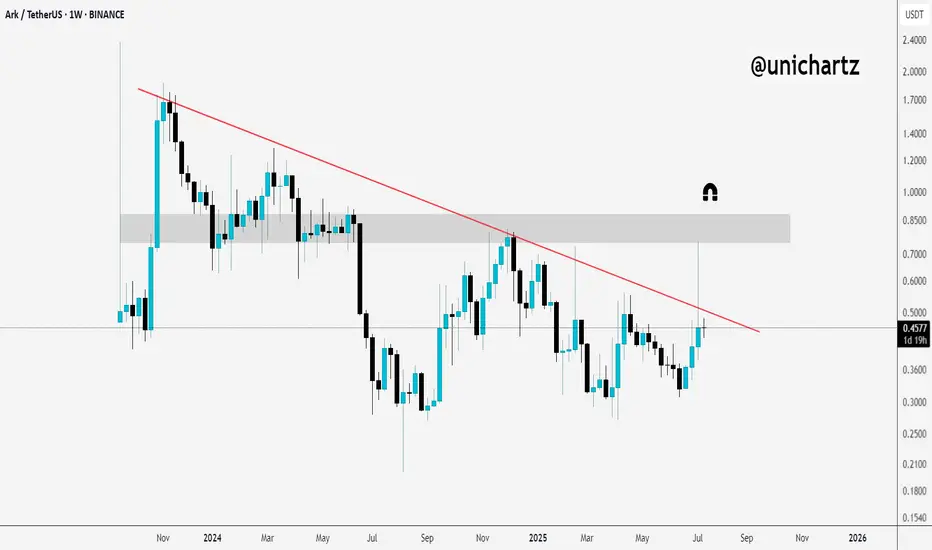
Potential Breakout Setup on ARK/USDT$ARK/USDT Weekly Outlook
Price is currently trading just below the trendline resistance.
If we get a clean breakout and weekly close above it, there’s a good chance we’ll see a move toward the marked resistance zone above.
Add this one to your watchlist — it’s heating up.
DYOR, NFA
XAUUSD ANALYSISWe are waiting for the price to come to our zone demand where we look for buy UpTo the level of supply zone where we look for sell entry .
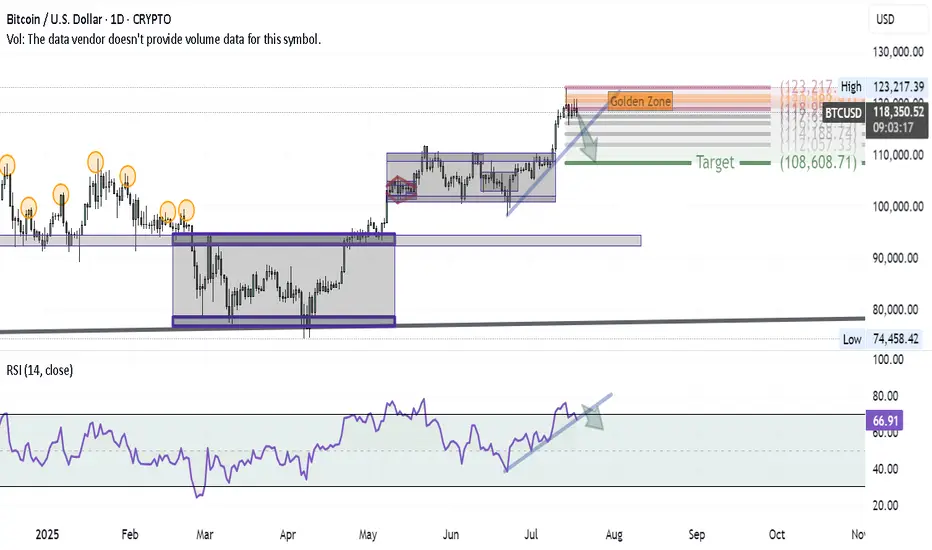
Bitcoin Correction Unfolding — First Wave in MotionAfter successfully hitting the BITCOIN target and anticipating a major correction in my previous ideas, here’s how the first wave of that correction is shaping up on the daily chart:
1- At the recent high, a Shooting Star candle formed — a classic reversal signal.
2- Using Volunacci analysis, the price retraced exactly to the Golden Zone, validating the first leg of the pullback.
3- The next step? A breakdown of the blue trendline would likely send us toward the Volunacci target at $108,600.
4- For confirmation, we're watching the RSI trendline — if it breaks down as well, it would strongly support the bearish continuation.
The setup is clean and developing as expected — it's all about following price and letting the chart guide the story.
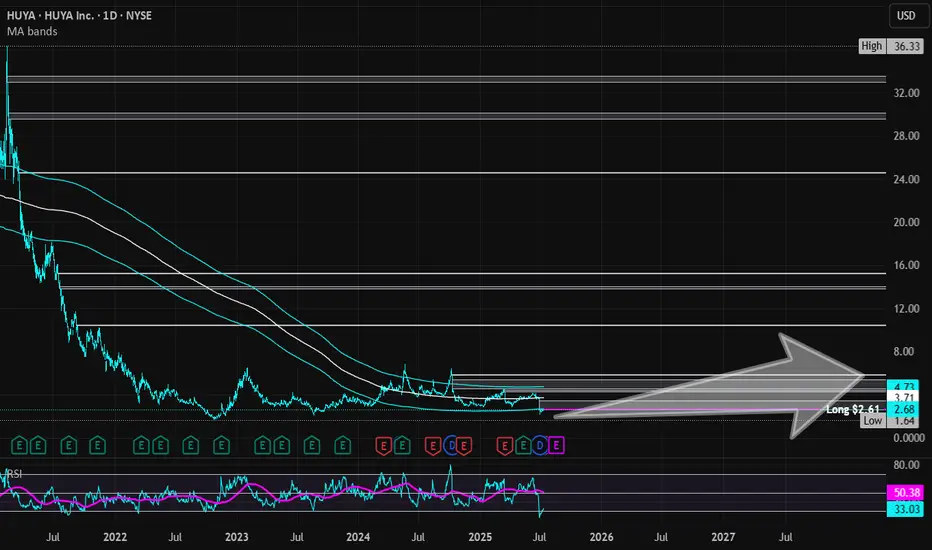
HUYA | HUYA | Long at $2.61HUYA NYSE:HUYA operates game live streaming platforms in China. This stock got my attention based on the reported fundamentals and price position, but moderate "Chinese delisting" risks exist given the US's new political administration.
Book Value = $3.23 (Undervalued)
Forward P/E = 4.1x (Growth)
Debt-to-equity = 0x (Healthy)
Quick Ratio = 1.56x (Healthy)
Altman's Z Score = <1.8 (Bankruptcy risk is relatively high)
From a technical analysis perspective, the stock price momentum has shifted upward based on the historical simple moving average. The price often consolidates within and slightly outside of this simple moving average band before progressing higher (after a long period of selling). While near term-declines are a risk, a longer-term hold (if the fundamentals do not change and delisting doesn't occur) may pay off given the value, growth, and overall health of the company.
Thus, at $2.61, NYSE:HUYA is in a personal buy zone.
Targets into 2028:
$3.45 (+32.2%)
$5.80 (+122.2%)
ETHUSD - ANOTHER GROWING WEEK
ETHUSD - ANOTHER GROWING WEEK✅
ETHUSD has been growing all these days together with a bitcoin. All the news, listed in my previous post for the BTCUSD are also valuable here. Really nice fundamental support, people are purchasing the asset.
But what's with technicals? 📊
Compared to the bitcoin, ETHUSD hasn't reached ATH. According to a daily chart (pic 1), the price has been moving sideways since 2021 and a strong resistance is waiting ahead at 4,000.00. However, for now we are good. I bet that during upcoming days the asset will reach this level and rebound from it. Will it break the resistance? I think it is too early to make any conclusions.

RPL | Waiting to Reclaim PivotRPL appears to be at a critical juncture on the weekly timeframe, having recently broken below its long-term descending trendline. The price is currently consolidating near the pivot level, which represents a key technical inflection point.
Current Setup:
Price trading below descending trendline resistance
RSI showing oversold conditions with potential for bounce
Critical pivot level at acting as immediate resistance
Bullish Scenario:
Reclaim of the pivot could trigger the projected upward path
Target the resistance zone around $28-32 (marked in red)
A break above the descending trendline would confirm trend reversal
Risk Factors:
Failure to reclaim pivot could lead to further downside
Overall crypto market sentiment remains a key factor
The setup suggests RPL is waiting for a decisive move above the pivot to initiate the bullish trajectory outlined in the chart projection.

Binance Coin (BNB) to $780? Chart Says 5.8% Rally Incoming!BNBUSDT is currently showcasing a clear bullish structure, supported by consistent demand and a strong breakout beyond previous resistance zones. The price action has steadily evolved into higher highs and higher lows since July 10, confirming bullish market control.
After consolidating around the 707–710 USDT range, the pair decisively broke out, flipping this level into support. The price is now hovering near 736.50 USDT, holding its gains despite brief intraday corrections.
The ascending pattern that started from mid-July saw a short-term dip toward 675 USDT, but strong buying interest quickly stepped in. This bounce marked the formation of a new swing low, followed by a powerful rally above the previous resistance.
The recent long-bodied bullish candles reflect strong momentum and possible accumulation by larger players. Buy and sell signals shown on the chart further validate the demand zone around 674–691 USDT, where bulls aggressively defended support.
The breakout structure is now entering a price discovery phase, with room for a measured move toward the upper resistance near 780 USDT, which is both a psychological round number and the projected Fibonacci extension zone.
________________________________________
📍 Trading Setup (Based on Chart)
• Entry Price: 736.50 USDT (current market price)
• Stop-Loss: 725.00 USDT (just below the recent structure low and horizontal support)
• Take-Profit: 780.22 USDT (Fibonacci target + psychological resistance)
• Risk: 11.78 USDT (~1.60%)
• Reward: 42.94 USDT (~5.82%)
• Risk-Reward Ratio: ~3.65 — favorable for swing-long positions
________________________________________
🧭 Key Zones to Watch
The support zone between 707.54 and 691.35 USDT is now the major demand base. As long as BNBUSDT holds above this area, the bullish thesis remains intact. A retest of this level followed by a bounce would further strengthen the ongoing uptrend.
Immediate resistance is at 737.28 USDT, but the market is attempting to flip this level. If it holds as support on the next retest, upside continuation to 780.22 USDT becomes highly probable.
If bulls fail to defend the 725 USDT level, we could see a deeper retracement toward 707 or 691 USDT, but currently that risk remains low given the strength of the latest breakout.

ETHFI | Trendline BreakoutETHFI on the weekly timeframe shows a significant bullish breakout after successfully breaking above the long-term descending trendline resistance that had been capping price action for months. This breakout represents a major shift in market structure and suggests the extended downtrend may be ending.
Key Technical Points:
Clean break above descending trendline resistance
Volume appears supportive of the breakout move
Potential Targets:
Initial resistance zone around $4.5 (red shaded area)
Higher targets possible if momentum sustains
Risk Considerations:
Weekly timeframe moves take time to develop
A false breakout could see price return below trendline
Overall crypto market sentiment remains crucial
The breakout setup offers favorable risk-to-reward for longer-term positioning, though traders should monitor for sustained momentum above the trendline to confirm the reversal.
