TBOTEK | Risk-Takers Buy @LTP, Safer Entry Above 1410, SL 1230Disclaimer:
This is not financial advice. Please do your own research or consult with a financial advisor before making any investment decisions. Investments in stocks can be risky and may result in loss of capital.
Trend Lines

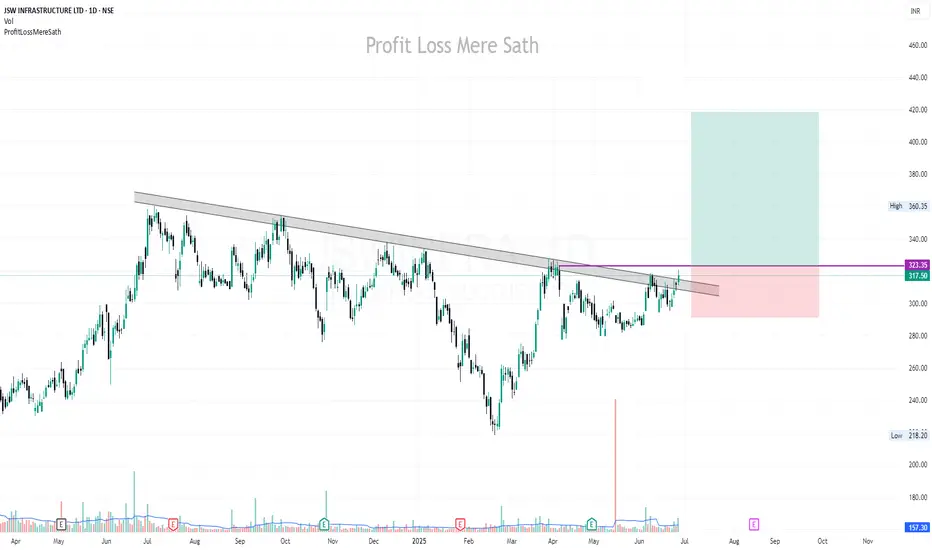
JSWINFRA | Buy Above 324 | SL Below 290 | Target 417Disclaimer:
This is not financial advice. Please do your own research or consult with a financial advisor before making any investment decisions. Investments in stocks can be risky and may result in loss of capital.
ATKR is near to best buying priceATKR is near the best buying price. It has already retraced to Fib 0.786.
A long term investment plan

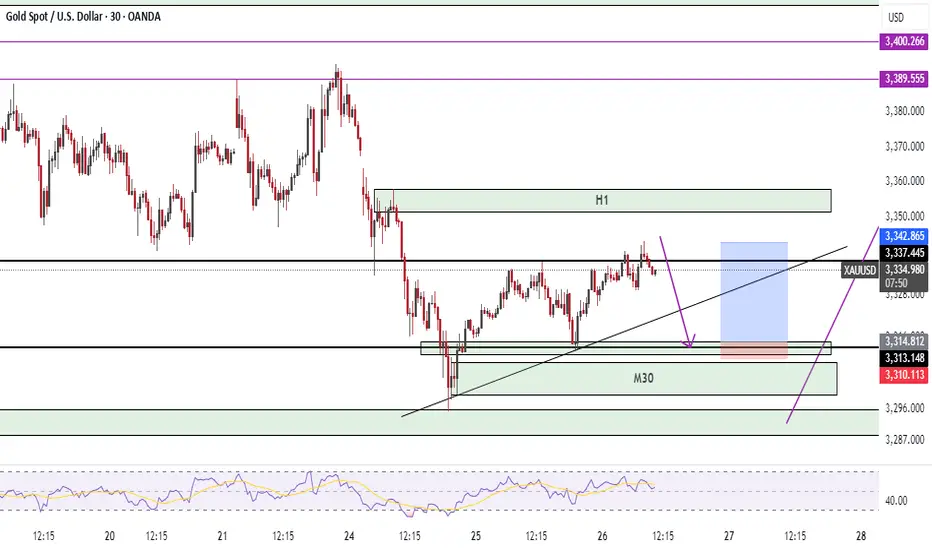
GOLD → Within range. Retest resistance at 3347FX:XAUUSD continues to correct after a false breakdown of support at 3300. Due to uncertainty, the price may remain in the range of 3300-3340 for some time.
Gold is fluctuating amid a weak dollar and uncertainty over Fed rates. Gold is struggling to hold on after rebounding from weekly lows, despite the US dollar falling to multi-year lows. Pressure on the dollar has intensified due to Trump's criticism of the Fed and rumors of a possible replacement for Powell. However, gold is limited in its growth due to a pause in geopolitical tensions and hawkish signals from the Fed chair. Investors are awaiting key macro data from the US (e 12:30 GMT Durable goods orders, GDP, Initial Jobless Claims) and especially the PCE inflation report on Friday.
Technically, the focus is on key areas of interest: 3300, 3306, 3340, 3347. Until strong news emerges, an intraday trading strategy should be considered.
Resistance levels: 3347, 3357
Support levels: 3320, 3307, 3300
Technically, a false breakout of resistance at 3347 and a retest of the local liquidity zone at 3320-3307 are possible before growth continues for the reasons mentioned above. Targets could be 3347, 3364, 3372, and 3396.
Best regards, R. Linda!

GBPUSD → Pre-breakout consolidation. One step away from a rallyFX:GBPUSD is trading in consolidation. Against the backdrop of the falling dollar index, the currency pair is testing resistance at 1.3632 but is not yet ready to bounce down.
Against the backdrop of the dollar's decline due to fundamental reasons, the GBPUSD currency pair is strengthening. Technically, this could lead to the price breaking out of consolidation upwards. A pre-breakout base is forming relative to the upper boundary of consolidation. The price is compressing towards the level, volatility is decreasing, which in general could lead to a breakout of resistance - trigger 1.3632. The exit from consolidation may be accompanied by distribution. The liquidity zone with W1 can be considered as a target.
Resistance levels: 1.3632, 1.3743
Support levels: 1.3593, 1.3508
The global and local trends are bullish. After growth, consolidation is forming. Against the backdrop of the falling dollar, GBPUSD is testing resistance. The reaction to the false breakout of resistance is weak. The chances of a breakout are quite high.
Best regards, R. Linda!

Bullish Setup on ARBUSDT: Risking 5.5% to Gain 13% Toward $0.339The price action of ARBUSDT has shown a significant reversal from a strong support region around 0.2612–0.2838 USDT, marked by bullish engulfing candles and a clear break above the descending trendline. This breakout is reinforced by the Supertrend indicator flipping green, signaling a potential shift in momentum toward the upside.
After bottoming out near 0.26, ARBUSDT has established a short-term higher low structure, and the current price action shows consolidation above the trendline, hinting at a possible continuation toward the next resistance.
A resistance level is marked at 0.3399, which coincides with previous supply and rejection zones. Volume and structure suggest buyers are regaining control, especially after holding support above 0.29 despite market-wide volatility.
📈 Trade Setup
• Entry Zone: 0.3000–0.3015
(Preferably on a bullish 4H candle close above 0.3000 for confirmation)
• Stop-Loss: 0.2838
(Just below the short-term demand zone and minor structure)
• Take-Profit: 0.3399
(Aligns with recent resistance and upper rejection zones)
• Risk–Reward Ratio: ~2.36
(Potential gain: ~13.11%, Potential loss: ~5.56%)
💬 Conclusion
ARBUSDT looks poised for a recovery after bottoming out near a strong multi-week support region. The break of the falling trendline and transition above the Supertrend resistance enhances the bullish outlook. A breakout above 0.3015 could lead to a push toward the 0.3399 resistance.
Note: If momentum builds above 0.3399, we may even see extension targets around 0.36–0.38 in the coming sessions. However, for now, staying disciplined within the trade plan ensures better risk control.

It’s the right time to short goldThe daily gold line presents a three-top gathering pattern. The historical trend shows that the 3290-3280 area has triggered technical pullbacks many times, all of which rebounded to around 3350. The current 4-hour chart trend line suppression level coincides with the Fibonacci 0.618 pullback resistance from the previous high of 3450 to 3300 in the 3350-3360 range. This area constitutes the core pressure zone. If the price fails to effectively break through and stand above 3360 when it probes this area again, it is highly likely to replicate the previous two resistance and fall patterns. At that time, short orders will be arranged based on the 3350 first-line resistance area, with the goal of breaking the key support of 3300 and further looking down at the 3280 and 3260 levels. The overall bearish tendency is maintained, and the resistance to rebound is a signal to enter the market and sell short.
Gold recommendation: Gold is short around 3345-3352, target 3330-3320

USNAS100 Eyes New ATH as Fed Rate Cut Bets &Ceasefire Fuel Rally USNAS100 OVERVIEW
Wall Street Gains as Rate Cut Hopes and Ceasefire Boost Sentiment
U.S. indices surged on Monday as growing expectations for a potential Federal Reserve rate cut in July helped offset market concerns over Middle East tensions.
The ceasefire agreement between Israel and Iran further eased geopolitical risk, supporting bullish momentum on Wall Street.
Forward Outlook:
A combination of dovish monetary policy expectations and geopolitical de-escalation continues to support upside potential in U.S. equities.
TECHNICAL OUTLOOK – (USNAS100)
The price has stabilized above 22,090, signaling strength and opening the path toward a new All-Time High (ATH) and beyond.
As long as the price holds above 22,090, the bullish trend remains in control.
A break and stabilization below 22,090 would suggest a bearish correction may be underway.
Resistance Levels: 22,210 → 22,280 → 22,460
Support Levels: 21,930 → 21,850

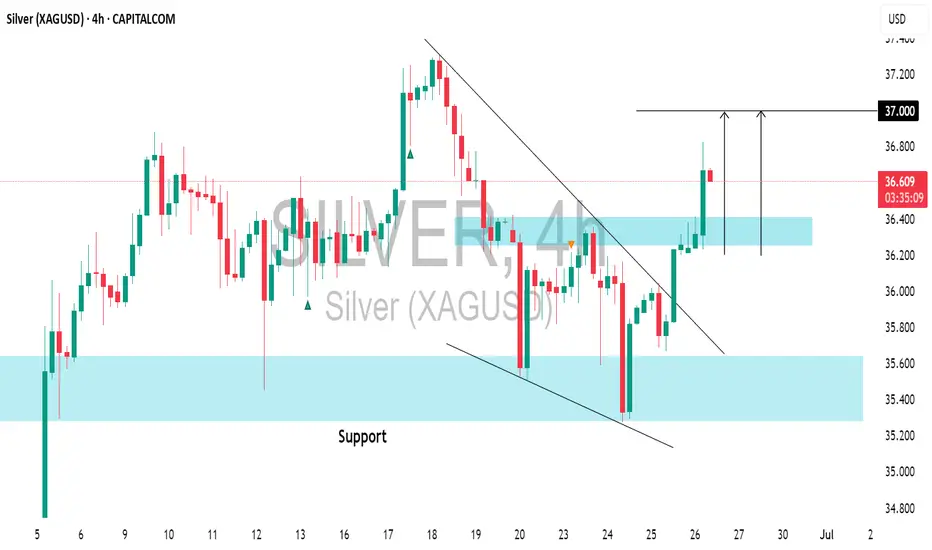
SILVER (XAGUSD): Intraday Bullish Confirmation?!📈SILVER appears to be on a bullish trend following a bounce off crucial daily/intraday horizontal support.
The price broke through a resistance line of a descending channel and created a local Change of Character (CHoCH).
There is a strong likelihood that the price will keep rising, with a target of 37.00.
SILVER (XAGUSD): Buyers Show Strength
Silver is going to rise more, following a strong bullish sentiment this morning.
The price violated a strong falling trend line and an intraday horizontal resistance.
These 2 breakouts indicate a strong buying pressure.
The price may grow more today and reach 37.14 level.
❤️Please, support my work with like, thank you!❤️
I am part of Trade Nation's Influencer program and receive a monthly fee for using their TradingView charts in my analysis.

SPX500 Holds Above 6,098 | Bullish Bias Toward ATH at 6,143OANDA:SPX500USD OVERVIEW
S&P 500 Futures Subdued After Near-Record Close | Market Eyes Powell’s Comments
U.S. stock futures were muted on Wednesday after the S&P 500 closed near an all-time high, following signals from Israel and Iran that their air conflict has ended.
Investors now await further comments from Fed Chair Jerome Powell for clues on the monetary policy outlook.
TECHNICAL OUTLOOK – SPX500
The price remains in a bullish trend as long as it trades above 6,098, with upside potential toward the ATH at 6,143.
However, a 1H or 4H candle close below 6,098 would likely trigger a bearish correction toward 6,056 and 6,041.
Pivot Level: 6,098
Resistance Levels: 6,143 → 6,175 → 6,210
Support Levels: 6,066 → 6,041

AUDUSD Potential UpsidesHey Traders, in today's trading session we are monitoring AUDUSD for a buying opportunity around 0.63800 zone, AUDUSD is trading in an uptrend and currently is in a correction phase in which it is approaching the trend at 0.63800 support and resistance area.
Trade safe, Joe.

SatochiTrader Expecting a huge BTC CRASH AFTER This..BTC Market Update by SatochiTrader
EVERY CRASH DID START WITH A FALSE INCREASE TREND.
Depending on the market sentiment and price action, BTC is currently showing strength with a positive trend. However, based on deeper data and insights held by myself and a small group of early-cycle followers, this current movement may be a deceptive signal — potentially foreshadowing a major crash.
This is not trading advice. Those who are confident in the long position should continue, and those on the other side should stay prepared as well.
We have previously explained that the current cycle appears to have ended. Since 2013, BTC has consistently respected its macro cycle targets. The end of such a cycle typically leads to significant corrections.
A cycle ending implies not just a retracement, but the potential for a major crash. Hedge funds and real BTC whales understand the underlying indicators and risks at play. Our expectation remains clear: BTC may soon fall below the 100K level, with $85K identified as a critical support and target zone.
Stay sharp. Stay informed. The market may look bullish — until it isn't.
The best way to follow BTC is not the news.. but the cycle overview.
This update is an education update, which means the high expectations of the upcoming correction for BTC.
Compared to last quarter, miners are now less severely underpaid, though profitability remains low

LTCUSD - Bottom in, starting wave 3In green we see the levels to be taken out as a corrective wave, but the structure is very much impulsive, so we aim fot the impulsive fib targets of 1.6 and 2.3.
Let's go!!

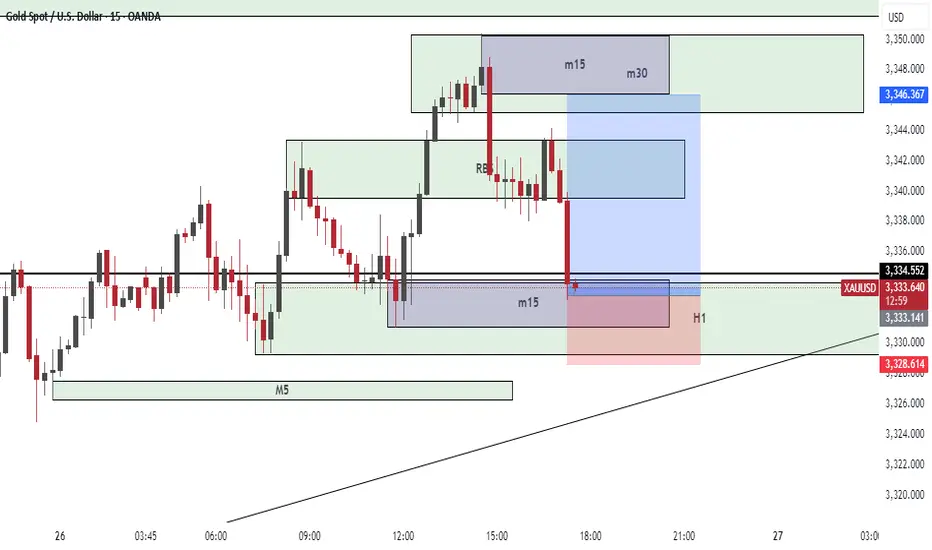
Gold rebound is blocked and high-altitude strategy continuesGold continued its bullish correction yesterday, reaching 3336 in the European session, and continued to retreat in the US session, reaching a low of around 3312 before temporarily stopping, and started a second pullback correction, and finally closed around 3332. Today, it opened at 3333, rebounded to 3340, and then entered a shock consolidation. Currently, the upper side focuses on the suppression of the 3342-3350 area. If the price cannot effectively break through and stand firm in this area, gold still has room for further retracement. In terms of operation, it will continue to rely on this suppression range to maintain a high-altitude thinking during the day, and follow the trend to see a decline. The recent market trends are basically the same, bottoming out and rebounding. In terms of strategy, keep a sense of rhythm and mainly short at highs.For more specific operation points, please pay attention to the notification at the bottom🌐.

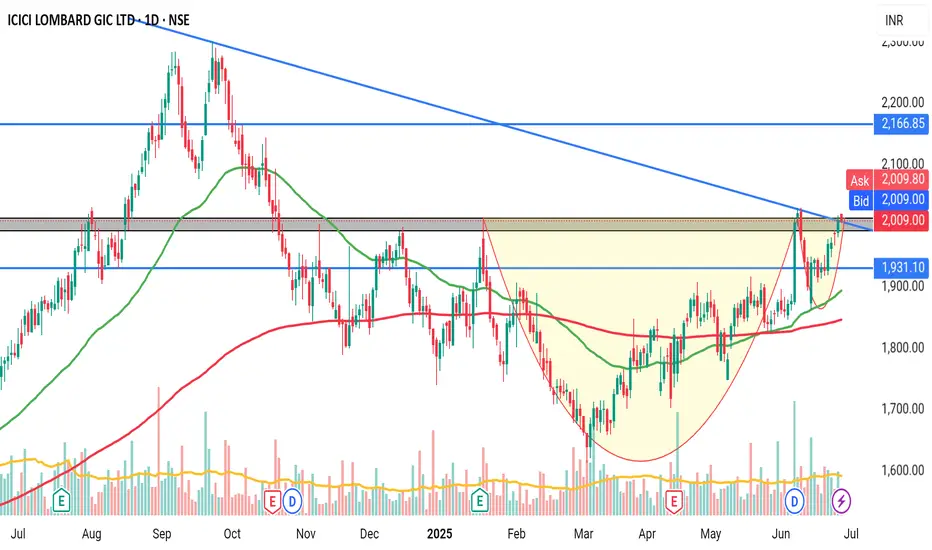
ICICI LOMBARDOn the verge of giving breakout of cup and handle pattern. If volume supports the breakout, it will shoot up in no time.
XAUUSD IDEAWe are waiting for the price to retest to our zone so that we can enter buy .
Please follow to support me .
GBPUSD InsightHello to all subscribers.
Please feel free to share your personal opinions in the comments. Don’t forget to hit the booster and subscribe.
Key Points
- NATO’s 32 member countries have agreed to increase defense spending to 5% of GDP by 2035, as requested by U.S. President Trump.
- Federal Reserve Chair Jerome Powell, speaking before the Senate, stated that the Fed is "in a position to wait" and noted it is difficult to predict how tariffs will impact inflation.
- The Fed has decided to ease the Supplementary Leverage Ratio (SLR) regulation that applied to major banks. With the regulatory easing, large banks are expected to increase their purchases of U.S. Treasuries, which could lead to lower bond yields.
Key Economic Events This Week
+ June 26: U.S. Q1 GDP
+ June 27: U.S. May Personal Consumption Expenditures (PCE) Price Index
GBPUSD Chart Analysis
Although the pair pulled back after encountering resistance from the trendline, it successfully rebounded from the 1.34000 level and climbed to 1.37000. After breaking through the resistance this time, it is now likely to rise toward the upper trendline. The projected high is expected to be around the 1.40000 level.

Crude oil fluctuates in a narrow range, waiting for direction
💡Message Strategy
Middle East ceasefire eases supply concerns, but risk premium remains
Oil prices rose more than 1% on the day as investors weighed the status of the ceasefire between Iran and Israel. Although both sides have announced an end to hostilities, US intelligence reports show that Iran's nuclear capabilities have only been temporarily damaged. ING analysts pointed out that although immediate concerns about supply disruptions have subsided, potential risks remain, a factor that may support spot prices in the short term.
Previously, crude oil prices soared after the US military action on Iranian infrastructure, but prices have retreated as the ceasefire continues. Although the geopolitical premium has been reduced, it has not been fully digested.
API shows a sharp drop in inventories, traders await EIA report
Industry data from the American Petroleum Institute (API) showed that US crude oil inventories fell sharply by 4.23 million barrels in the week ending June 20, far higher than the expected drop of 800,000 barrels. Gasoline and distillate inventories increased by 400,000 barrels each.
Market focus now turns to the US Energy Information Administration (EIA) report scheduled for release on Wednesday. Traders were expecting a 1.2 million-barrel draw in inventories, and confirmation of that figure by the EIA, widely viewed as an industry benchmark, would reinforce expectations of tighter supply.
📊Technical aspects
From the daily chart level, crude oil fluctuates upward in the medium term and tests around 67. The K-line closes with a large real negative line, which has not yet destroyed the moving average system and is still supported. The medium-term objective upward trend remains unchanged.
However, from the perspective of momentum, the MACD indicator crosses downward above the zero axis, indicating that the bullish momentum is weakening. It is expected that the medium-term trend of crude oil will fall into a high-level oscillation pattern.
The short-term trend of crude oil (1H) is in a narrow range of consolidation, with a small fluctuation. The oil price repeatedly crosses the moving average system, and the short-term objective trend direction fluctuates. In terms of momentum, the MACD indicator fast and slow lines slowly rise below the zero axis, and the long and short positions are in a stalemate, with no obvious advantage on one side. It is expected that the trend of crude oil will maintain a consolidation pattern during the day.
💰Strategy Package
Short Position:67.00-67.20,SL:67.80,Target: 65.50-64.50
Long Position:64.00-64.20,SL:63.50,Target: 65.50-66.50

EURUSD Breakout and Potential RetraceHey Traders, in today's trading session we are monitoring EURUSD for a buying opportunity around 1.15700 zone, EURUSD was trading in a downtrend and successfully managed to break it out. Currently is in a correction phase in which it is approaching the retrace area at 1.15700 support and resistance area.
Trade safe, Joe.

Descending broadening wedge after peak BTC/USD 4hCurrently BTC/USD is in a descending broadening wedge after a peak.
This means high chance of upward breakout. Price increase from breakout point is usually the difference from pattern top to pattern bottom, which would mean a price of $123000.
Not financial advice. There is a chance of this not playing out, even though the chance is small.

GBPUSD GBPUSD is currently exhibiting short-term bearish momentum, targeting the fresh demand zone at 1.36416.
This level aligns with a key order block that could act as a pivot for the next bullish leg.
As long as price holds above this zone, we anticipate a potential bullish reversal from 1.36416 on the 15-minute timeframe. We’ll be monitoring for confirmation and continuation to the upside from that level.
