TSLA: Don't Sleep on the PullbackTesla’s bullish momentum is still in control – the weekly chart shows we’re still in an uptrend, and the trend is still our best friend. After a strong bounce from support a couple weeks ago, price is now rejecting off a weak resistance zone. Ideally, this pulls it back into my entry zone to retest the bottom or the 50% mark of the current swing. I’m using trend lines for guidance and expecting the next swing to push up into that confluence area. My golden zone is set between $367–$390, with partial profits be taken at $367 (top of the channel) and the rest near $390, where we meet the trend line. Stop loss is placed at $241, just below the level where momentum would likely shift.
Trend Lines

AAPL Short Term Highs IncomingAAPL 1D
Apple looks good from here.
Target 1 @ 214.30
Target 2 @ anywhere from 218 to buyside liquidity
Retest of the former high then a pullback to fair value region is possible before continuation to the next short term high.

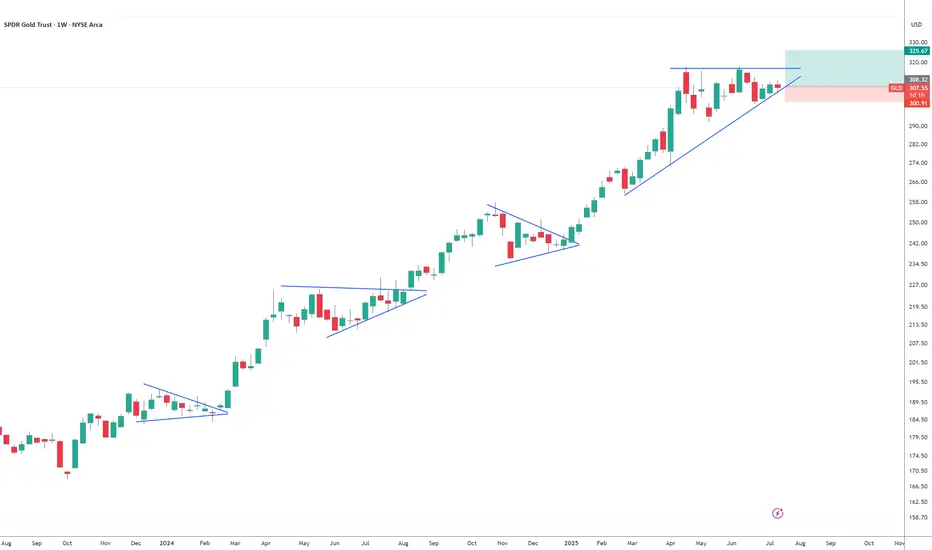
Gold!!!!!Looks like GLD is setting up for a big move to the upside. It likes to consolidate for a few weeks before a massive breakout. I have some GLD calls strike 310 for September 19. My SL triggers if a weekly candle closes under trendline. TP 325 ish.
THAT WHAT YOU NEED TO KNOW ABOUT BTC IN 2025Professional Technical Analysis & Trading Plan for BTC/USD (Hypothetical 2025 Data)
---
1. Technical Structure & Key Observations
A. Price Context:
- **Current Price:** ~84,197 (below SMA 81,998).
- **SMA (Simple Moving Average):** 81,998 (likely 200-day SMA, acting as dynamic resistance).
- **Volume:** 52K (low volume suggests consolidation; watch for spikes to confirm breaks).
C. Key Levels (From Data):
- **Resistance:**
- Immediate: 81,998 (SMA).
- Major: 90,000, 100,000, 130,000 (swing highs).
- **Support:**
- Near-term: 74,000 (psychological),
---
2. Advanced Indicator Analysis
A. Momentum (RSI & MACD):**
- **RSI (14):** Likely near 40–45 (neutral-bearish zone). A break below 30 signals oversold; above 55 confirms bullish momentum.
- **MACD:** Bearish crossover possible (signal line above MACD line). Watch for reversal above SMA.
B. Volume Profile:
- **Low Volume (52K):** Indicates weak participation. A surge above 100K on a breakout/breakdown would validate direction.
- **Volume-Weighted Average Price (VWAP):** If price trades above VWAP, bullish bias strengthens.
---
3. Trading Strategies
Scenario : Bullish Reversal (30% Probability)
- **Trigger:** Daily close above SMA (81,998) with volume >100K.
- **Entry:** Long at 74,500 (confirmation of strength).
- **Targets:**
- TP1: 90,000 (8.5% move).
- TP2: 100,000 (19% move).
- **Stop Loss:** 71,500
---
5. Sentiment & Catalyst Watch
- **Bullish Catalysts:** Institutional ETF inflows, Fed rate cuts, Bitcoin halving momentum.
- **Bearish Risks:** Regulatory crackdowns, exchange hacks, macro recession.
-Conclusion
BTC/USD is at a critical juncture. *Trade the SMA break/breakdown with volume confirmation*, and prioritize risk-reward ratios. Always cross-verify with real-time data and news.
Disclaimer: Hypothetical analysis for educational purposes. Not financial advice.* 🚀

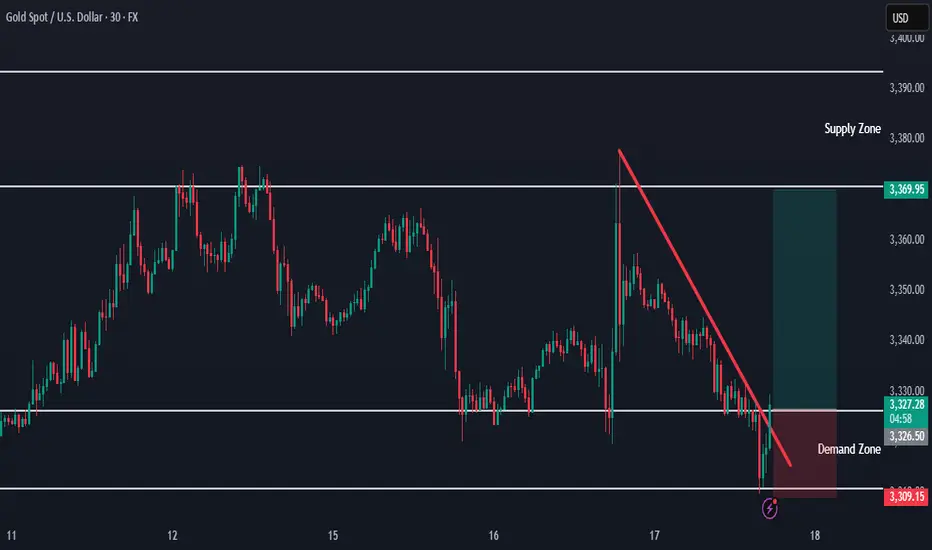
Oolong news stirs up gold market trend analysisWe decisively prompted support and arranged long orders near 3320. While the bottom stabilized, Trump suddenly released a smoke bomb, saying that he was considering whether to fire Fed Chairman Powell. The risk aversion sentiment exploded instantly, and gold soared in the short term, hitting the target of 3340-3345 in a few minutes, and the highest rose to 3377! But then Trump denied the relevant plan, and the risk aversion sentiment quickly cooled down. The gold price immediately fell from a high level, and the market returned to a volatile pattern. At present, the risk aversion drive has been falsified. In the short term, we need to focus on the trend opportunities after the high and fall. Considering that the news is still uncertain, it is recommended to wait and see first, and wait for the situation to become clearer before entering the market.
🔍Technical observation: The 1-hour chart of gold shows an obvious high and fall pattern, accompanied by a long upper shadow line closing. If there is no new risk aversion stimulus, the short-term momentum for another attack is limited.
📉Operational suggestions: Maintain the main idea of rebound short selling, pay attention to the short-term pressure in the 3365-3370 range, and choose to arrange short orders. ⚠️It should be noted that news has a great impact on the market. Transactions need to be executed decisively, but be careful not to be led by short-term fluctuations. Strict implementation of trading plans is the key.

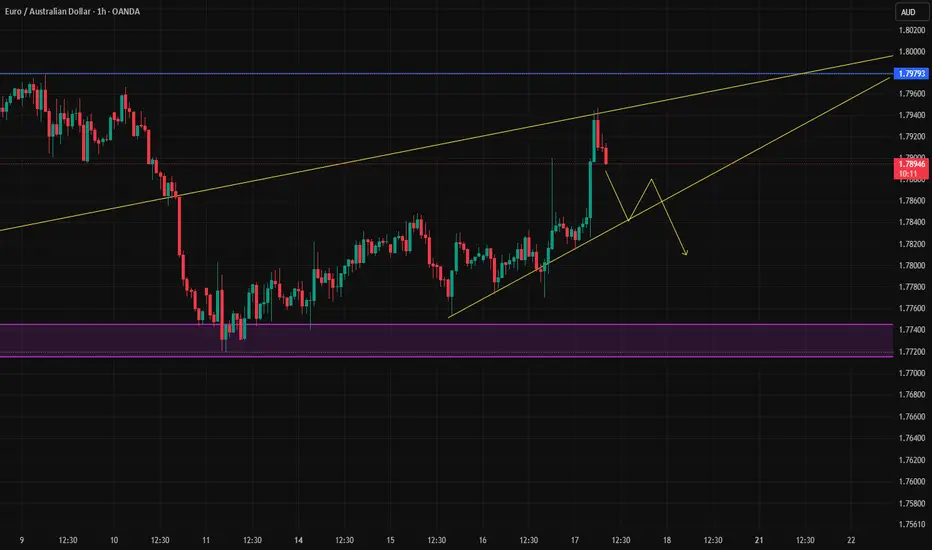
EURAUD BUY OPPORTUNITY Buying from the current market gives an edge to capitalise on the bullish trend that’s developing after a major pullback that happed in the H4 timeframe.
Our target is at 1.79872

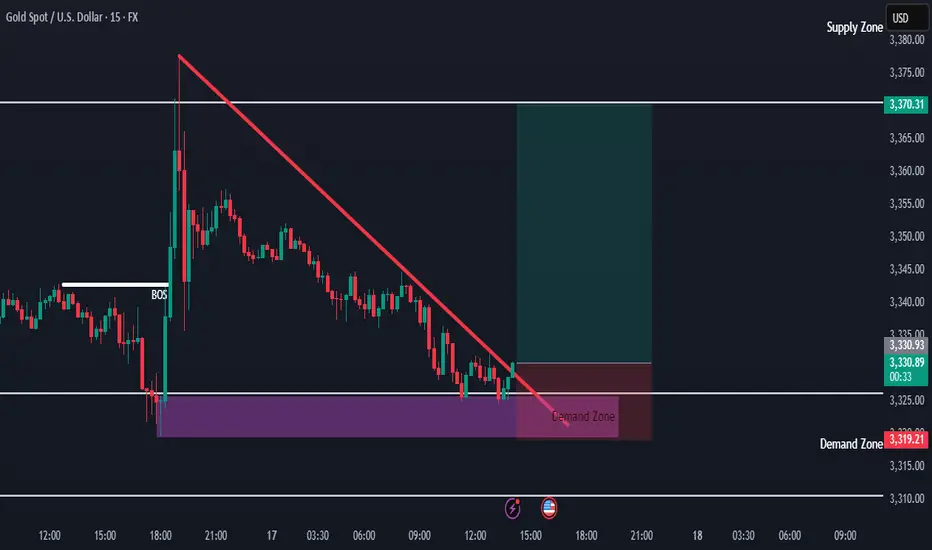
Gold Holding Demand — New Buy Setup FormingThe demand zone on the higher timeframe is still holding, and price is starting to move higher.
A new buy opportunity is forming upon the break of the downward trendline.
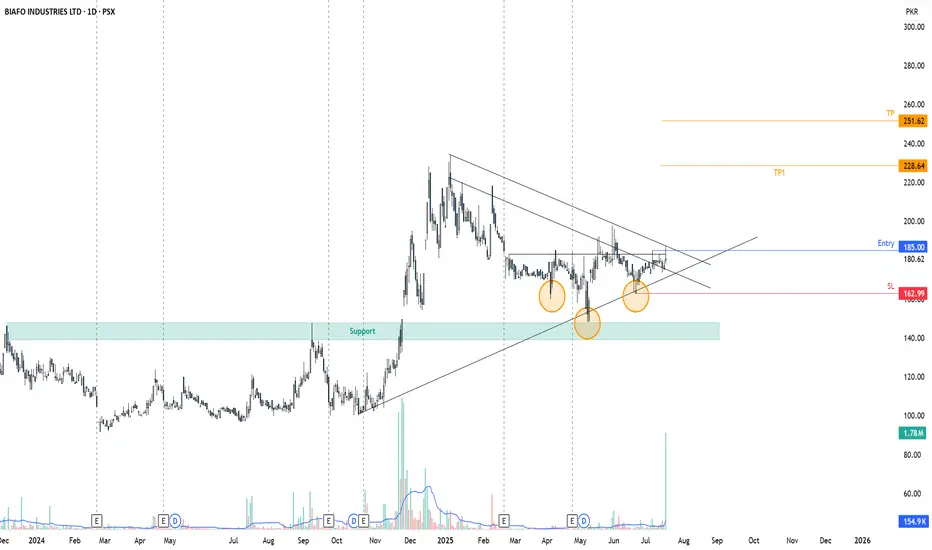
Are you seeing BIFO next Upper cap?BIFO has already shown bullish divergence and formed an Inverted Head and shoulder pattern. On the breakout of Resistance, it can make a fine move.
Are you seeing it next Upper cap?
Gold Ranging Between HTF Zones — Buy Setup FormingHello everybody!
Price is fluctuating between two higher timeframe supply and demand areas.
The market structure on the lower timeframes changed yesterday, and now we’re watching to see if the newly formed small demand zone will hold.
The break of the downward trendline is our signal to enter a buy position.
Gold Setup. Midas losing his touch.TVC:GOLD has reached an all time high of $3500. It further created a LH @ $3435 in the daily TF. This signals the beginning of a possible down trend of the commodity with the current fundamentals as confluence.
Furthermore, TVC:GOLD is likely to reach level $3160 and possibly test levels as low as $2960, below the much acclaimed $3000 support structure.

WEDGE IN XAUUSD, POSSIBLE OUTCOMESWEDGE IN XAUUSD, POSSIBLE OUTCOMES👀
Since the fundamentals didn't influence this asset (I mean yesterdays U.S. PPI report, escalation in the Middle East and Trump's hint on Powell's resignation), let's talk about technicals in gold.
XAUUSD primarily trades sideways since the beginning of June. Main support levels are 3,250.00 and 3,300.00. Main resistant levels are 3,375.00 and 3,450.00. Currently the asset trades within a range of 3,300.00 - 3,375.00. Additionally, bullion has formed a bearish wedge since the beginning of July. Right now the price is heading towards lower border of this wedge, where the SMA50 is situated and may act as an additional support here.
I see 2 main scenarios for a mid-term here:
1) Break below the wedge, rebound from 3,300.00 support, targeting 3,375.00.
2) Rebound from the wedge’s lower border, show a bearish move to 3,375.00, then drop to 3,300.00.
In both cases, I assume the price to stay sideways for a long period of time.

Analysis based on a channel within two cyclesWe have a large descending channel, which appears to be forming a smaller ascending channel as part of a correction.
Once the correction is confirmed and completed, it could provide a good opportunity for a short position.
However, if the lower boundary isn't broken and the price moves higher, we’ll hold off and wait for a new structure to form.
NZDUSDSince March we have been trading NZDUSD inside a chanell and after catching the sells we now look into maximising the buys as well with 0.61775 as our main target before we consider changing biase to bear.
A colure below the channel will invalidate this analysis and will target 0.57646 - 0.55404

BullsHaving in mind that the have been in buys through the year so far. This would be a flag formation and we currently on the daily FVG which provides an entry to continuation in buys.
NB we have a resistance line and that would be iur target before EURUSD starts to dunp massively. Closure below the FVG will result in closure of the buys.

Bitcoin Buy analysis/ideaThis analysis is based on the 4-hour and 1-hour timeframes and executed using Supply and Demand trading and trend formation. Complete explanation in the video!

If confirmed, this could be a strong trigger to enter shortIf the euro is indeed set to weaken — as we anticipate based on the current signs of trend exhaustion — this could be a solid trigger for a short position.
However, if the breakout fails to confirm, it may turn out to be a fakeout, potentially leading to a bullish reversal instead
GBPUSD InsightWelcome to all our subscribers.
Please feel free to share your personal thoughts in the comments.
Don't forget to like and subscribe!
Key Points
- According to CBS and other U.S. media outlets, former President Trump asked Republican lawmakers during a closed-door meeting whether they supported removing Federal Reserve Chair Jerome Powell. It was reported that many lawmakers showed support for the idea. However, in a meeting with the Prime Minister of Bahrain, Trump stated that unless Powell is involved in a scandal related to renovations of the Federal Reserve building, the likelihood of his dismissal is very low.
- President Trump is actively lobbying lawmakers to pass three stalled cryptocurrency bills in the House of Representatives. Optimism about the bills' passage has resurfaced. In particular, the potential strategic use of stablecoins to strengthen the dominance of the U.S. dollar and boost demand for U.S. Treasuries has brought renewed attention to these legislative efforts.
- The U.K.’s Consumer Price Index (CPI) for June came in at 3.6%, exceeding the market expectation of 3.4%. As a result, the possibility of a Bank of England rate cut in July has significantly diminished.
Key Economic Schedule This Week
+ July 17: Eurozone June Consumer Price Index (CPI)
GBPUSD Chart Analysis
The GBPUSD pair failed to break above the 1.38000 level and fell through the trendline after facing resistance in that zone. Currently, it is testing support near the 1.34000 level. If the pair successfully rebounds from this area, we could expect another potential rally toward the 1.40000 level. However, if the support is broken, a further decline toward the 1.31500–1.32000 range is likely.

EUR/USD – Falling Wedge at Major Fibonacci Zone | Bullish ReversAfter a strong mid-June rally, EUR/USD has pulled back into a key fib cluster, showing early signs of reversal from a classic falling wedge pattern — often a precursor to bullish breakouts.
Technical Breakdown:
📉 Descending Trendline
🔍 Fibonacci Confluence:
Price is reacting from the 0.5-0.618 – 0.705 zone (1.16421-1.15969), aligning perfectly with historical demand and the golden zone of the fib retracement.
Just below sits the 0.79 fib (1.15339), which also marks our invalidity level for this idea — a deep but powerful retracement if tested.
💡 RSI:
While still below 50, it has created a hidden bullish divergence between July 12–17, hinting that momentum is flipping back to bulls.
🧠 Educational Insight:
This setup combines Trendlines, Fibonacci retracement theory, and EMA dynamics to build a multi-layered trade thesis — the type of confluence we look for at Wright Way Investments.
Price doesn’t just reverse because it hits a fib level. But when structure, EMAs, and RSI align — the odds increase significantly.
📈 Trade Setup (Idea-Based, Not Financial Advice):
Long Entry Zone: Current area (1.159–1.161), with confirmation above 1.1626
Invalidation: Clean break & close below 1.15339
Target Zones:
🎯 TP1 – 1.1642 (50 fib & retest zone)
🎯 TP2 – 1.1686 (38.2 fib)
🎯 TP3 – 1.1755 (Weekly Resistance)
📌 Summary:
EUR/USD is forming a textbook reversal setup, supported by fib precision and EMA alignment. Patience is key — but the ingredients are here for a strong bullish continuation.

Median Line Trade RGTIPrice tests the LMH and rejects it. Look for a long at the retest. We get set at 12.50.
TP1 is logical at 2.5R and just before the prior top in case we fail to follow through
TP2 is at the median line. As Dr Andrews says "Price makes it to the Median Line 80% of the time".
Ok 'we got lucky' on some news for such a quick set of T/P's. Price definitely moved quicker than expected. However it wasn't luck that put us in the position.

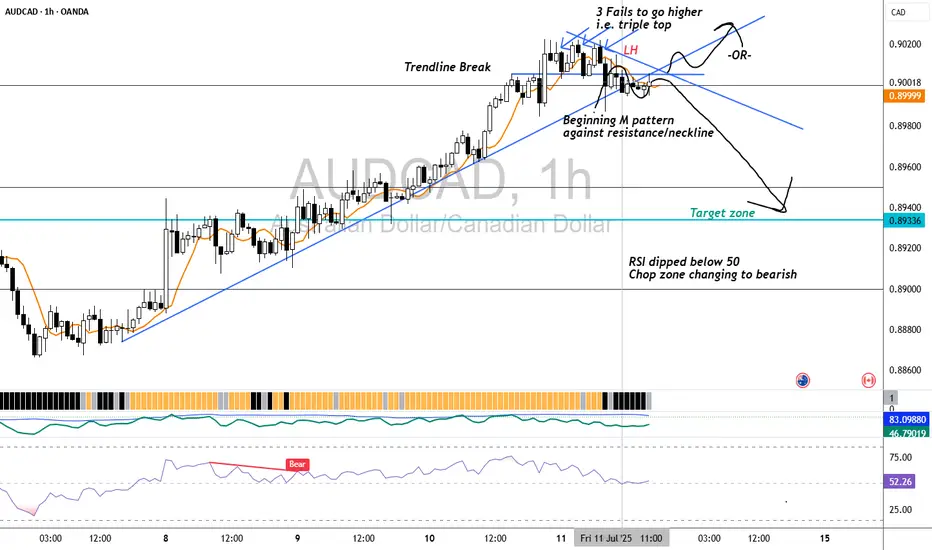
AUDCAD H1 BearishFactors of confluence in favor of short
1. Daily resistance zone 0.90432
2. Triple top
3. M pattern against resistance
4. RSI dipped below 50
5. Chop Zone change to bearish
6. Break of trendline
7. 3.5 R/R
8. Removal of liquidity zone on daily chart(prior high)
Risks
1. No LL yet
2. 2nd time back to daily resistance zone- may break through to upside
3. Price to return to congestion zone above for more consolidation before choosing a direction
4. Possibility to resume upwards momentum
GRASS About to EXPLODE or COLLAPSE? Traders Could Get Trapped inYello, Paradisers! Are you ready for what could be one of the most deceptive breakouts we’ve seen this week? #GRASSUSDT is showing signs of strength, but as always, we need to stay sharp and look beneath the surface to avoid getting trapped like 90% of the herd.
💎#GRASS is knocking on the door of a key descending resistance trendline that has been respected multiple times this month. The current price action is attempting to break above it with momentum, and a confirmed breakout could trigger a strong probable impulsive move toward the next resistance levels at $1.2630, $1.3959, and eventually even $1.6512.
💎But what gives this setup its real probability strength is what most retail traders are overlooking: the confluence between minor support at $1.10–$1.15 and the short-term EMAs on the 4H timeframe. The 50 EMA and 100 EMA are starting to curve upward and align just above this support range, offering a strong dynamic base. This zone isn’t just visual support anymore—it’s turning into a technical launchpad.
💎From a technical standpoint, any clean 4H candle close above the trendline and $1.2630 resistance will increase the probability of continuation toward the mid-range resistance near $1.3959. However, failure to break above this zone convincingly or a rejection back into the previous range could signal that market makers are just pushing price up to trap breakout traders before dumping it again.
💎Support remains firm in the $1.10–$1.15 zone, but invalidation is crystal clear — any 4H candle close below $1.0549 would negate this bullish outlook entirely and suggest a deeper move is coming. That level has held well so far, but remember: one quick breakdown can wipe out many weak hands.
💎This is exactly the kind of setup that separates emotional traders from strategic ones. Many will FOMO in right at the breakout without considering the higher timeframes or waiting for confirmation.
Strive for consistency, not quick profits, Paradisers. Treat the market as a businessman, not as a gambler. Only the patient and prepared will survive and profit from these types of traps. Let’s continue to stay smart, strategic, and wait for the best high-probability opportunities.
MyCryptoParadise
iFeel the success🌴

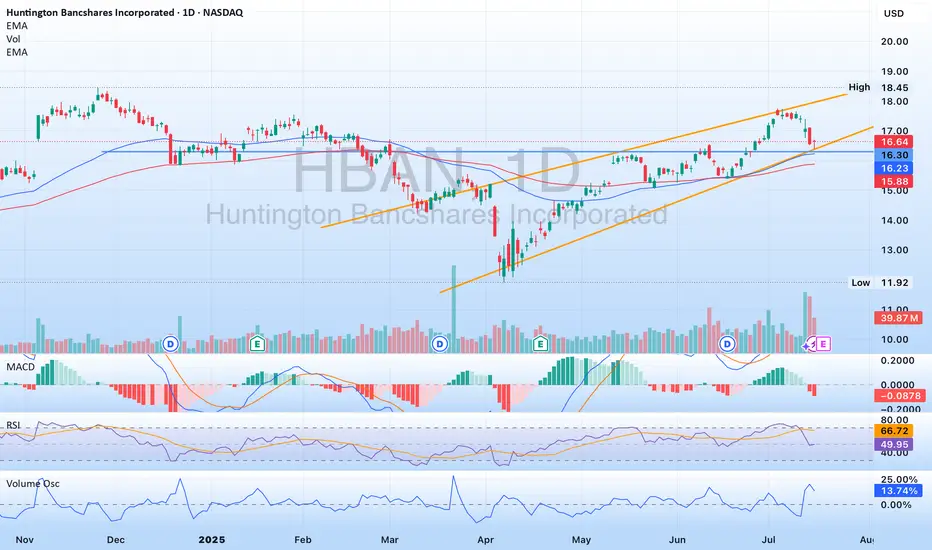
$HBAN - well positioned to continue on its pathNASDAQ:HBAN has been in a rising channel since April, and is no touching the lower band of the channel. His area also includes some previous resistance turned support, as well as some movement paces. NASDAQ:HBAN recently announced they are acquiring Veritex ( NASDAQ:VBTX ) which will strengthen their mark in Texas. Please note NASDAQ:HBAN is releasing earnings July 18th. A good report should see the stock moving towards the upper band of the channel, maybe break through it.
Fake news stirs up the market, market trend analysis📰 News information:
1. Beige Book of Federal Reserve's economic situation
2. European and American tariff trade negotiations
📈 Technical Analysis:
Today, our overall trading can be said to have accurately grasped the trading points, and both long and short positions have earned us good profits.The gold market surged due to Trump's intention to fire Powell. Trump then denied the plan, which dissipated the risk aversion in the gold market and the overall rhythm fell back to a volatile pattern. The current market price of gold closed with a long upper shadow line, indicating that there is a certain need for adjustment in the market. Although the news stimulus has pushed it up to 3377, we need to be vigilant against the risk of a decline after a high rise. Pay attention to today's closing. If it closes below 3345, the bearish trend may continue in the future.
OANDA:XAUUSD PEPPERSTONE:XAUUSD FOREXCOM:XAUUSD FX:XAUUSD OANDA:XAUUSD FXOPEN:XAUUSD
