Taking another trip to Palo Alto for a quick flip If you want all the details on why I'm taking this trade, refer back to my Palo Alto ideas from Jan 8th and May 21st of this year. The only thing that has changed since May is 4 more profitable trades on PANW, so it's now 25-0. The longest of those 4 has taken 4 days and the average return on them has been 2.16%. So I'm going to Palo Alto again.
The entire cybersecurity sector took it on the chin yesterday, with NET, CRWD, ZS and others all down big and it continued today for them. I know PANW the best, so that's why I'm choosing it, but I think any of them could do well here. PANW is right on its 200d MA and has been above it for the better part of the last 3 years. Even if this trade takes longer than expected to produce, PANW and cybersecurity are not going anywhere. If I had to hold this one for years, I'd be happy to. Well, not "HAPPY" happy, but you get the point.
My exit is signal-based rather than price level based, but I'm targeting under a week for a return of 1-3% on average. Let's hope PANW keeps its record intact and makes this my best trade of the day.
As always - this is intended as "edutainment" and my perspective on what I am or would be doing, not a recommendation for you to buy or sell. Act accordingly and invest at your own risk. DYOR and only make investments that make good financial sense for you in your current situation.
Trend Lines

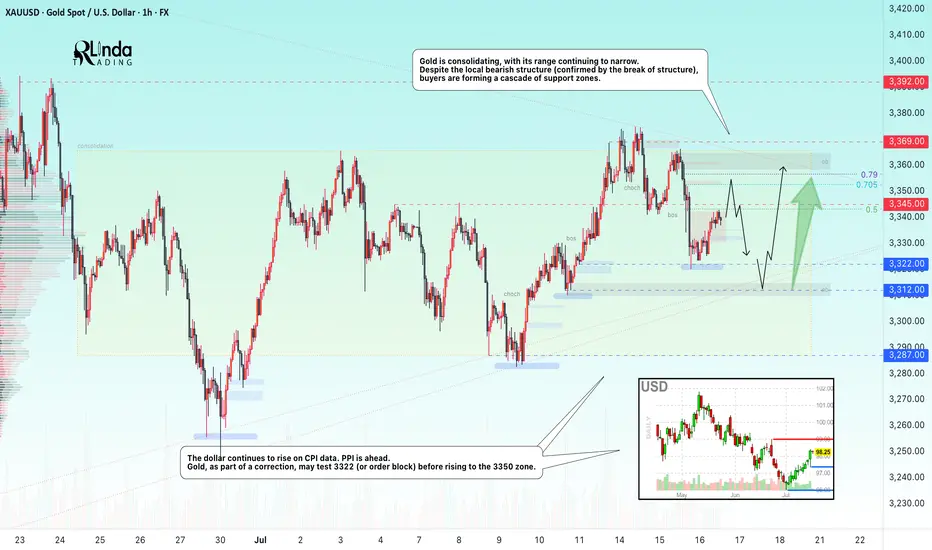
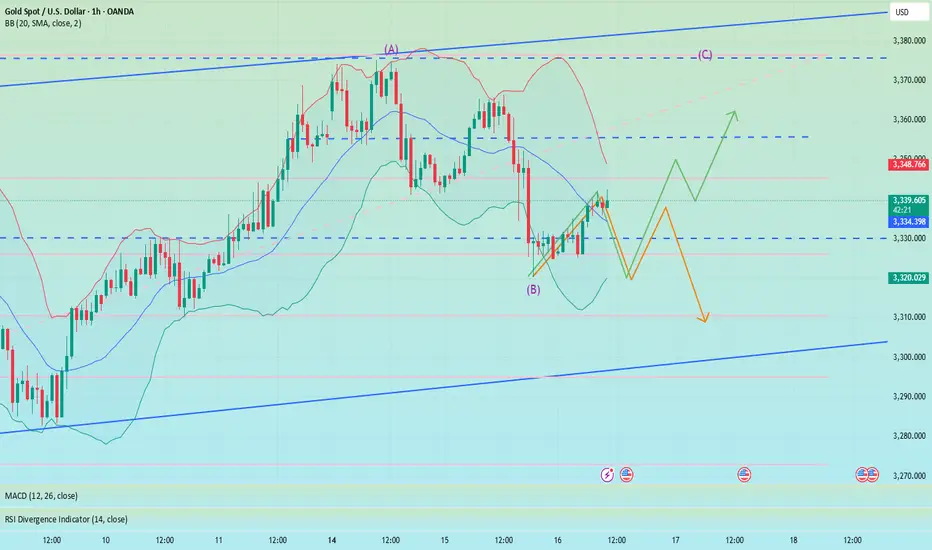
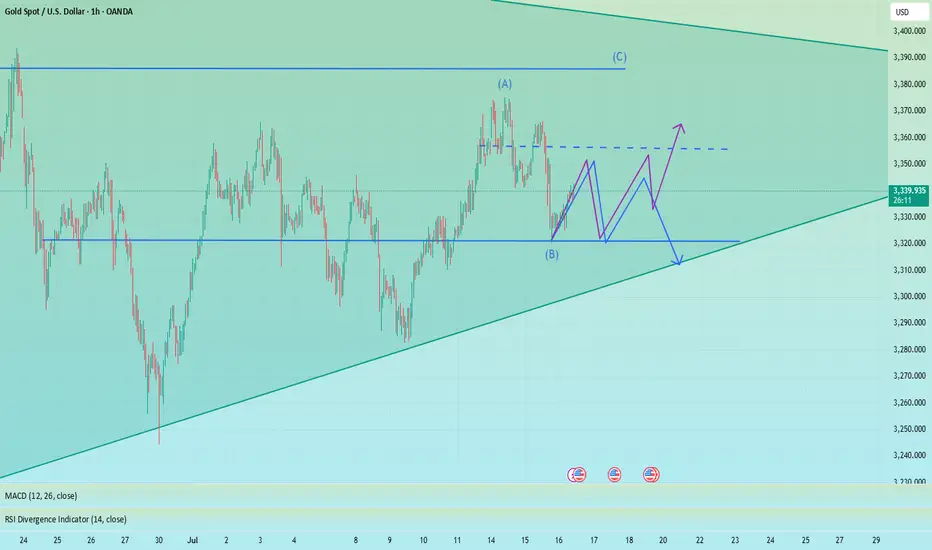
GOLD → Borders are shrinking. Consolidation continues...FX:XAUUSD is adjusting amid controversial CPI data and confirming the local bearish market structure. The PPI is ahead, and gold is consolidating, with its boundaries continuing to narrow...
Gold is recovering slightly but remains under pressure amid rising bond yields and a stronger US dollar. Higher inflation in the US reduces the chances of a quick Fed rate cut. Traders are cautious ahead of the PPI data release. If producer inflation exceeds forecasts, the dollar may rise again, putting further pressure on gold
Technically, we see consolidation in a symmetrical triangle pattern. Trading within the consolidation has a negative side - low volatility and unpredictable movements. The purpose of such movements is accumulation. However, decisions can be made based on relatively strong levels. In the current situation, we are seeing a rebound from 0.5 Fibonacci (I do not rule out a retest of the 0.7 zone before correction). The price may head towards the liquidity zone of 3322 before rising to the upper boundary of the consolidation and the zone of interest of 3350-3360.
Resistance levels: 3345, 3353, 3369
Support levels: 3322, 3312, 3287
The problem is that the price is in a consolidation phase. That is, technically, it is standing still and moving between local levels. You can trade relative to the indicated levels. Focus on PPI data. At the moment, gold is in the middle of a triangle and is likely to continue trading within the boundaries of a narrowing channel due to uncertainty...
Best regards, R. Linda!
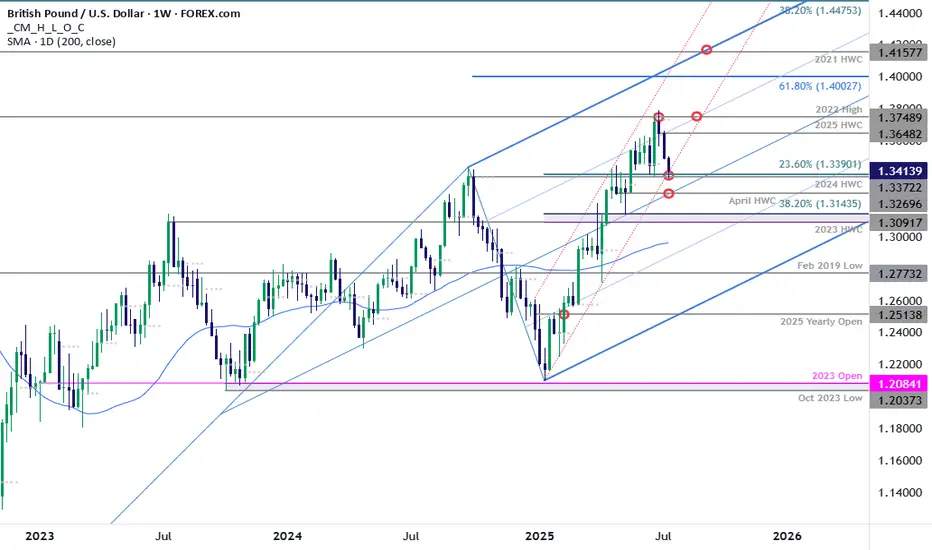
GBP/USD Plunges to Make-or-Break SupportSterling is poised to mark a third consecutive weekly decline after turning from resistance at multi-year highs. The decline takes price into critical support at the yearly trendline- this is a make-or-break level for the bulls.
GBP/USD is testing confluent support today at 1.3372/90- a region defined by the 2024 high-week close (HWC) and the 23.6% retracement of the yearly range. Looking for a reaction off this mark with a weekly close below the April HWC / median-line at 1.3270 ultimately needed to suggest a more significant high is in place / invalidate the yearly uptrend. Subsequent support rests with the 2023 HWC / 38.2% retracement at 1.3091-1.3143 and the 52-week moving average, currently near ~1.2980.
Weekly resistance now eyed at the yearly high-week reversal close at 1.3648 with a breach / close above the 2022 high at 1.3749 still needed to mark resumption of the broader Sterling up trend. Subsequent resistance objectives eyed at the 61.8% extension of the 2022 advance at 1.4003 and the 2021 HWC at 1.4158.
Bottom line: Sterling is attempting to break below the yearly uptrend and the focus is on the weekly close with respect to 1.3372/90- risk for price inflection here. From a trading standpoint, a good zone to reduce portions of short-exposure / lower protective stops- rallies should be limited to 1.3648 IF price is heading lower on this stretch with a close below 1.3270 needed to suggest a reversal is underway.
-MB
BorgWarner Inc Quote | Chart & Forecast SummaryKey Indicators On Trade Set Up In General
1. Push Set Up
2. Range Set Up
3. Break & Retest Set Up
Notes On Session
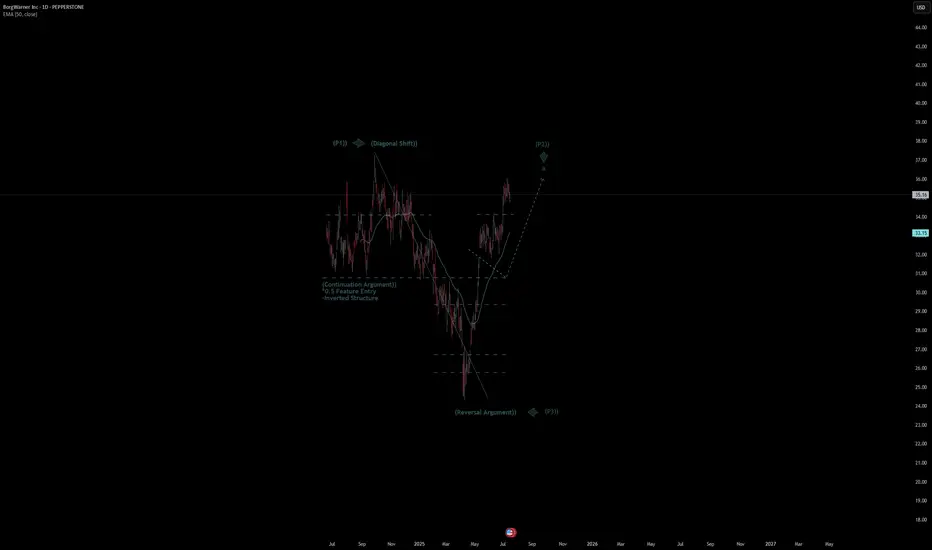
# BorgWarner Inc Quote
- Double Formation
* (Diagonal Shift)) At 38.00 USD | Completed Survey
* 0.5 Feature Entry | Subdivision 1
- Triple Formation
* (P1)) / (P2)) & (P3)) | Subdivision 2
* (TP1) = a / Long Consecutive Range | Subdivision 3
* Daily Time Frame | Trend Settings Condition
- (Hypothesis On Entry Bias)) | Regular Settings
- Position On A 1.5RR
* Stop Loss At 32.00 USD
* Entry At 35.00 USD
* Take Profit At 39.00 USD
* (Uptrend Argument)) & No Pattern Confirmation
- Continuation Pattern | Not Valid
- Reversal Pattern | Not Valid
* Ongoing Entry & (Neutral Area))
Active Sessions On Relevant Range & Elemented Probabilities;
European-Session(Upwards) - East Coast-Session(Downwards) - Asian-Session(Ranging)
Conclusion | Trade Plan Execution & Risk Management On Demand;
Overall Consensus | Buy
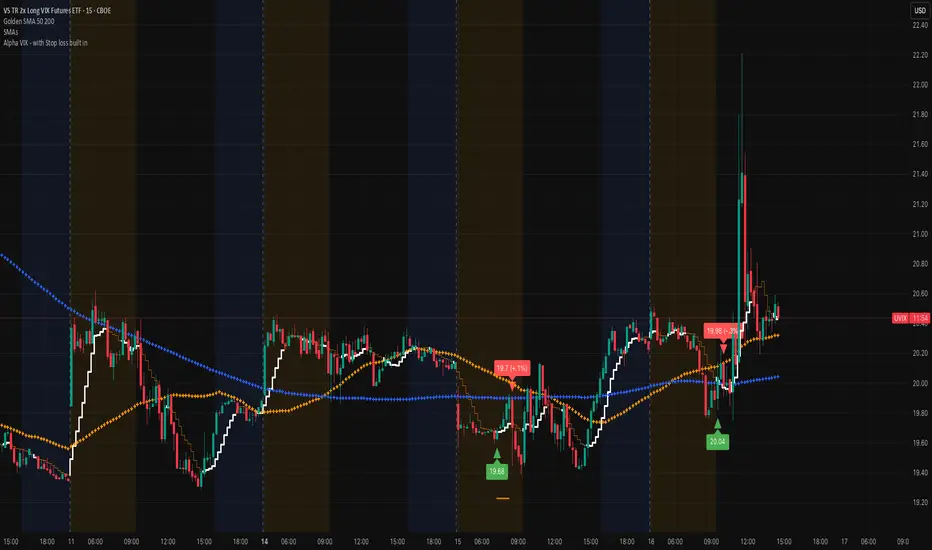
UVIX marching on (VIX proxy)Very nice spike this morning, that's typically a sign that there's more volatility in the works. Remember that we are at record lows on the VIX and that doesn't stay in this region for a long time. Add the Alpha VIX indicator to help you get an entry. The economy is brittle and staying focused on the VIX is a very nice play!
Best of luck and DM if you have any questions.....
Potential buys?Trade Journal Entry – XAUUSD (Gold Spot)
Date: July 16, 2025
Platform: TradingView (Demo Account)
Timeframe: 4H
Direction: Long
Status: Active, In Profit
Unrealized Profit: +301.54 GBP
Entry: ~3,327
Stop Loss: Below 3,316 zone
Take Profit (TP): ~3,492
Risk:Reward Estimate: ~1:4 or better
Market Context
Previous pullback into the sell-side liquidity and POI zone held firmly.
Price rejected from POI and aggressively moved upward, confirming bullish order flow.
POI (Point of Interest) is marked intentionally — awaiting a return to the zone after price closes above the wick.
A full buy confirmation is expected only upon a bullish close above the wick, followed by a retest into the POI.
Trade Logic
Trade was initiated based on:
- Break of market structure (BMS)
- Sweep of sell-side liquidity
- Bullish intent shown via momentum candles
- Expectation: price returns to POI after wick close for full confirmation
Management Plan
- Consider partial TP at 3,365–3,375 zone.
- Trail SL below latest higher low on lower TF.
- Wait for price to revisit POI after close above wick before scaling in full size.
Emotional Reflection
Feeling composed. The trade plan is well-structured with a POI-based confirmation strategy. No rush to fully size until POI is respected post-wick close.
Reflection Questions
- Did I stick to my POI confirmation logic?
- Am I patient enough to wait for a close above the wick?
- Is my entry risk properly managed while awaiting confirmation?

Falling correction, shorting in European session📰 News information:
1. Beige Book of Federal Reserve's economic situation
2. European and American tariff trade negotiations
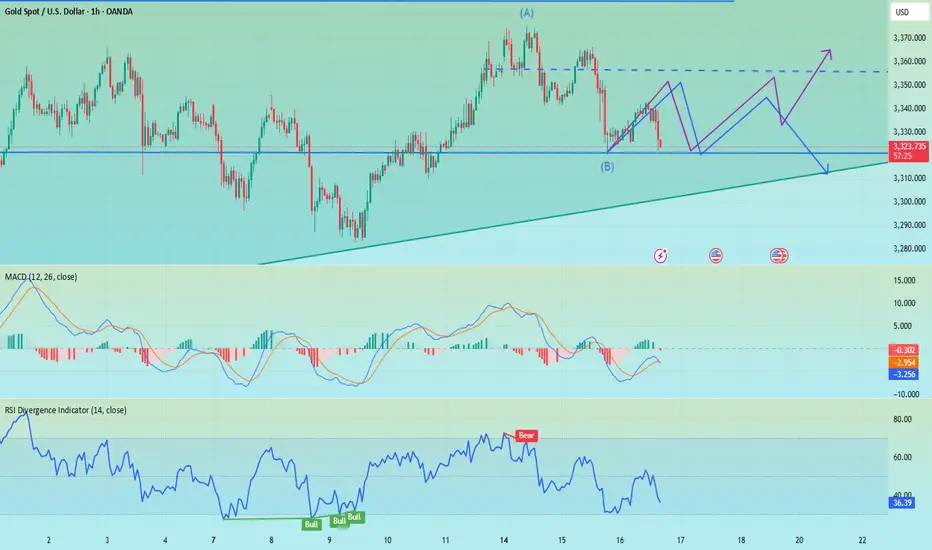
📈 Technical Analysis:
Currently, gold continues to consolidate around 3340, and the daily MACD indicator is stuck to the zero axis. Two consecutive days of negative bars also indicate that the overall trend of gold is weak and volatile. The hourly Bollinger Bands are closing, with the upper band located near 3352. The corresponding positions of the upper pressure middle band and SMA60 are basically at 3335-3350, but it is expected to gradually decline over time. On the whole, there are no particularly clear trading signals at present. Both bulls and bears have certain opportunities. It is recommended to wait and see for the time being. Pay attention to the 3342-3352 area above. If the bearish trend is confirmed in the future, you can consider shorting when it rebounds here, with the target at 3330-3325. If gold retreats directly to 3325-3320 and gains effective support again, you can consider going long.
🎯 Trading Points:
SELL 3342-3352
TP 3330-3325
BUY 3325-3320
TP 3340-3350
In addition to investment, life also includes poetry, distant places, and Allen. Facing the market is actually facing yourself, correcting your shortcomings, facing your mistakes, and exercising strict self-discipline. I share free trading strategies and analysis ideas every day for reference by brothers. I hope my analysis can help you.
FXOPEN:XAUUSD TVC:GOLD FX:XAUUSD FOREXCOM:XAUUSD PEPPERSTONE:XAUUSD OANDA:XAUUSD
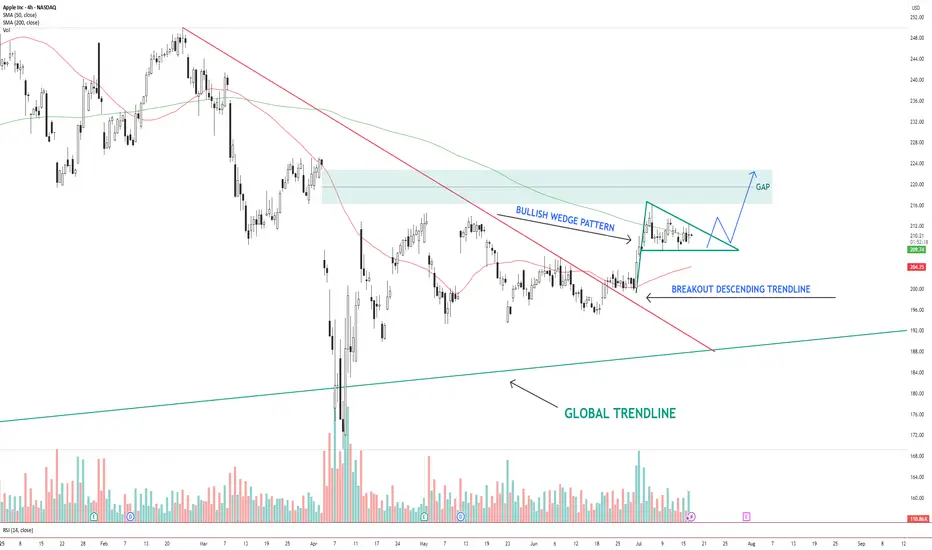
AAPL – Bullish Wedge Breakout Setup Toward Gap FillAAPL NASDAQ:AAPL has broken out of a descending trendline and is now consolidating inside a bullish wedge pattern . Price is holding above the 200 SMA and hovering near the 50 SMA.
The structure suggests a potential breakout above the wedge, with a clear gap area between $216–$224 acting as the next upside target.
Key levels:
Support: $206 (wedge base / 50 SMA)
Resistance: $216–$224 (gap zone)
Trend structure: Bullish consolidation after breakout
A clean breakout from the wedge with volume could trigger a continuation move toward the gap zone.
📌 Watching for confirmation and potential entry on a breakout + retest.
This is not financial advice. Always do your own research.
BTC Bull Flag Target Hit Is $150K Now on the Table?Bitcoin continues to deliver with precision. If you’ve been following the structure, this breakout is no surprise. We had a textbook bullish flag setup earlier in the cycle clean pole, sideways consolidation, and a sharp breakout. That initial flag target has now been achieved.
But here’s where it gets interesting: price didn’t just hit the flag projection it shows a good potential for a test towards the projected supply zone just beneath $128K. A short-term rejection here is completely normal and even healthy. The current pullback appears corrective, and the $115K–$111K region (our immediate buy-back zone) remains a critical area to watch for a potential base.
The structure so far has respected its levels cleanly. The pole projection landed almost perfectly, which builds confidence in how this setup is unfolding. A retest of the demand block offers a decent long opportunity, especially with trendline confluence and horizontal support lining up in that zone.
If BTC continues to respect the broader trend and finds strength off this pullback, the path toward $128k, $141K and even $150K remains valid. Those targets are measured extensions based on the original flag pole, and given how price is behaving, they’re not unrealistic.
Momentum is strong, but rallies like this often pause before the next move. I’ll be watching how price behaves if it dips into the demand zone. Clean volume and rejection candles there could offer solid re-entry setups for the next leg higher.
Are you riding this wave, trimming profits, or waiting for the dip reload? Drop your thoughts below. Let’s see how everyone’s navigating this phase.
📌 Follow for more clean, structured setups no hype, just charts.

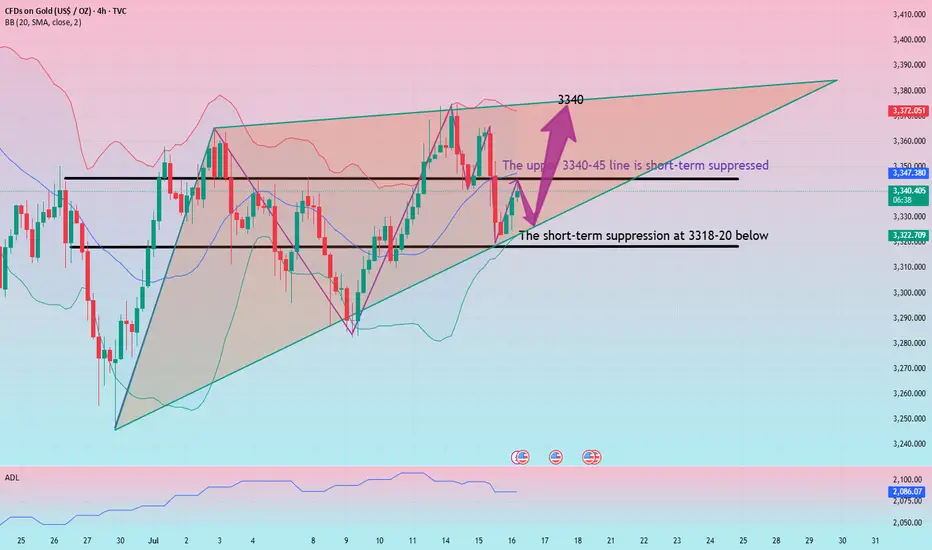
The high probability intraday trading strategy for gold is here!After gold fell below 3341 yesterday, the highest point of the rebound was around 3350-52. Today, we are long at 3320-25, and the target of 3340-45 has been reached. We continue to pay attention to the short-term suppression of 3340-45, but the overall rebound strength is limited. The 3340-45 point fell back several times last Friday, and it is now broken again. Therefore, we can participate in the short position at 3340-3345 in advance. Gold rebounded at 3322 today. Technically, it needs to rebound and repair when it falls back to 3316-20, so we can look for opportunities to go long below to seize the profit space of the rebound.
From the 4-hour analysis, the short-term pressure above is around 3340-3345, and the current focus is on the support of the middle track 3310 at the hourly level. If the gold price can effectively hold the 3310 area, it is expected to bottom out and rebound and test the intraday high, but the upper rail resistance of the 3345 channel is strong, and it may still fall under pressure when it is touched, and the range shock judgment will be maintained at that time. In terms of operation, if you hold this support, you can consider light positions to try short-term longs, and pay attention to the short-term support of 3320-3315 below. Relying on this range to maintain the main tone of high-altitude low-multiple cycles during the day, the middle position is always more watchful and less active, cautiously chasing orders, and patiently waiting for key points to enter the market. I will prompt more specific operation strategies at the bottom, and pay attention in time.
Gold operation strategy: Gold falls back to the 3322-3317 line to go long, the target is 3335-40 line, and continue to hold if it breaks.

Hidden Support on RIG: Next Big Move?🔹 Trade Summary
Setup:
Price pulling back to ascending trendline support
Testing major support near $2.58
Analyst 1-year target: $3.76
Entry:
Above today's high of $2.64 (on confirmation of bounce from trendline)
Stop-loss:
Below $2.40 (clear break of trendline)
Targets:
$3.76 (analyst price target / major resistance)
Risk/Reward:
Approx. 1:4 (risking ~$0.25 for ~$1.10 gain)
🔹 Technical Rationale
🔹 Ascending trendline holding as key support since April
🔹 Oversold bounce potential at this zone
🔹 Daily timeframe shows structure for a trend reversal if support holds
🔹 Catalysts & Context
🏦 Strong analyst “Buy” rating; 1-year target at $3.76 (+45%)
🛢️ Oil sector volatility—any rally could boost offshore drillers
🌍 Macro: Global energy demand headlines could trigger momentum
🔹 Trade Management Plan
Entry: Wait for daily close above $2.65 to confirm support
Stop-loss: Move to breakeven if price closes above $3.00
Scaling: Trim partial at $3.20, rest at $3.76 (analyst target)
What’s your view? Are you watching NYSE:RIG ? Comment below:
🔼 Bullish
🔽 Bearish
🔄 Waiting for confirmation
🔹 Disclaimer
Not financial advice. Trade at your own risk.
*** Don't forget to follow us for more trade setups ***

Patanjali Foods: A Potential Reversal Brewing Near Demand Zone?The price has now retraced back into a key value zone between 1,610 - 1,635, which has previously acted as a strong base. This zone also coincides with high volume activity on the visible range volume profile - suggesting accumulation interest.
Technically, the stock is near the 0% Fibonacci extension with multiple confluences of past support and volume, forming a potential base.
If this holds, look for retracement targets:
• First bounce zone: ₹1,687 (50% Fib)
• Further recovery: ₹1,745–₹1,775 (Fib 61.8–78.6%)
Long-term: ₹1,861 (161.8% Fib extension), ₹2,016 (261.8%)
Fundamentals Snapshot:
• Market Cap: ~₹58,000 Cr
• P/E: ~34x | P/B: ~3.8x
• Promoter Holding: 80.82% (No pledging)
• Debt-to-Equity: ~0.25
• ROCE: ~13.2% | ROE: ~10.4%
• FII Holding: 3.6%, DII Holding: 6.3%
Patanjali’s brand strength in edible oils, packaged foods, and growing FMCG integration offers secular demand visibility. The recent correction seems sentiment-driven, not structural.
Keep in Focus:
A decisive close above 1,660 could indicate a short-term reversal.
This chart is for educational use only and not a buy/sell recommendation.

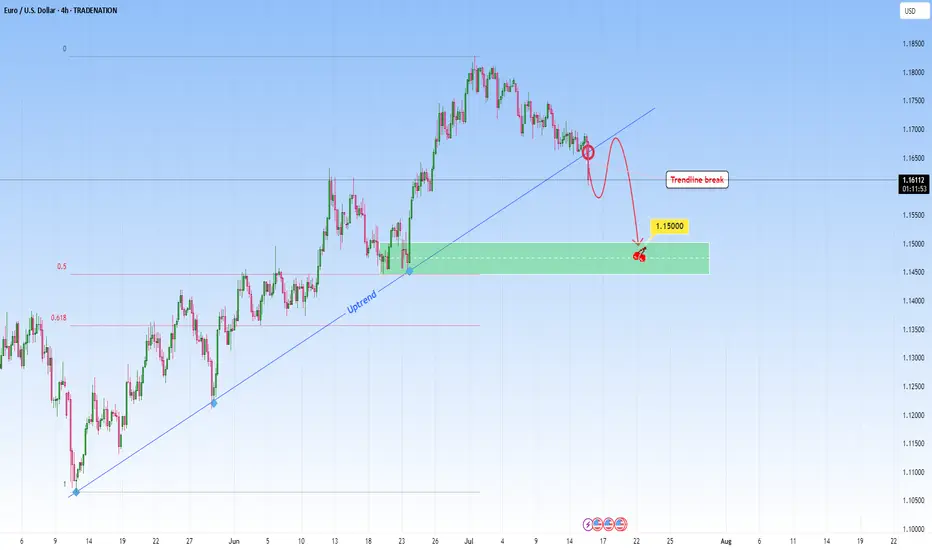
EURUSD: Sell Opportunity after Trendline breakEURUSD was in a steep uptrend but it might stop with this recent break through the uptrend. A break like this one on a strong trendline that had multiple touches, indicates either a potential reversal or major pause in the trend. This candle that broke the trendline signals the first hint of structural change.
I will be waiting for a retest and look to get involved in a short setup.
Ideally, what I look for in retests is to be met with a confirming candle. This would confirm the sellers have taken over and validate the change from uptrend to potential downtrend or consolidation phase.
My target would be around 1.1500.
Just sharing my thoughts for the charts, this isn’t financial advice. Always confirm your setups and manage your risk properly.
Disclosure: I am part of Trade Nation's Influencer program and receive a monthly fee for using their TradingView charts in my analysis .
BIG ALERT: Stock Market shown a massive break on a TL support. 🚨BIG ALERT: Tech Sector shown a break on a massive TL support level and this news just came out.
We may see everything reverse here pretty soon, depending how the market responds......
CRYPTO may still trend upward and most likely WILL!
- Crypto wins in the end, stay watchful! #BlackChain

Gold – Bullish Structure Still Intact, but Bears are Knocking📉 What happened yesterday?
As expected, XAUUSD made another leg down, breaking even below my buy zone (3330–3335) and hitting a low at 3320. From there, we’re now seeing a modest rebound, with gold trading around 3333 at the time of writing.
📌 Current position:
I'm currently holding a long position. It hovers around break-even – fluctuating between small gains and small losses. Nothing solid yet.
❓ Key question:
Was this just a deep pullback within a bullish structure… or the beginning of a deeper trend reversal?
🔍 Why bulls still have a case:
• Price prints higher lows – bullish structure technically remains intact
• A clean break above 3350 would show short-term strength
• A confirmed break above 3375 would activate a bullish ascending triangle → targeting the 3450 zone
⚠️ But here's the concern:
• Yesterday’s dip to 3330 happened during the New York session (strong volume)
• The bounce from 3320 has been weak, with no follow-through
• Daily candle closed near the lows, showing a long upper wick → a classic bearish signal
• The confluence support now lies at 3310–3320. A red daily candle closing in this area could mean the medium-term trend is flipping
🎯 My trading plan:
Although I'm still holding my buy, if bulls don’t recover 3350 quickly, I will consider closing early. The break of 3310 would shift my bias bearish.
________________________________________
📌 Conclusion:
We’re in a critical zone. The bullish structure isn’t broken yet, but yesterday’s action was not encouraging. If buyers fail to reclaim control soon, the market may be preparing for a deeper correction. Stay sharp. 🚀
Disclosure: I am part of TradeNation's Influencer program and receive a monthly fee for using their TradingView charts in my analyses and educational articles.
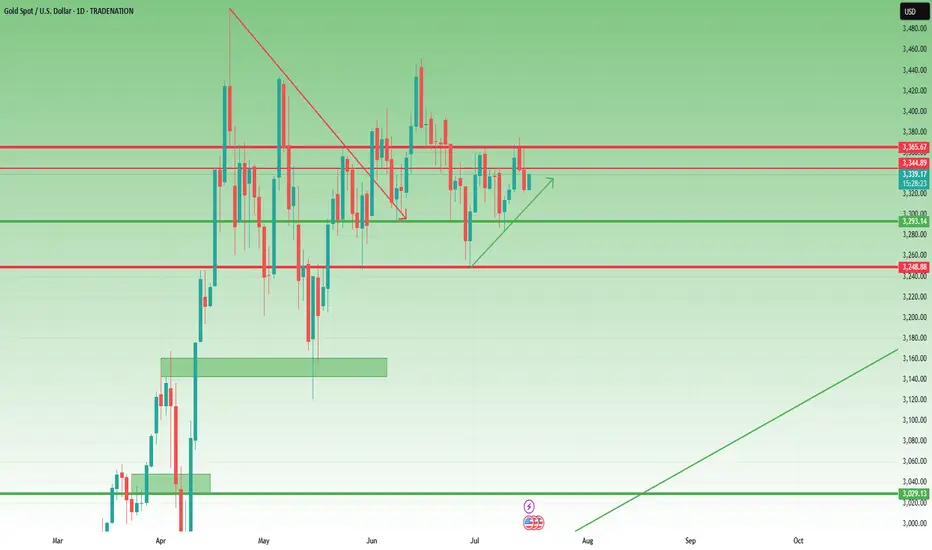
SWING TRADE OPPORTUNITY 〉LONGAs illustrated, I try to visualize what the next bullish impulse could look like if price holds 3300 as a key psychological and algorithmic price level.
Illustrated are the potential buy areas (a current one and an extended one in case a pullback occurs to manipulate lower levels in the next 24-48 hours).
This projection, if valid, could hold from now until next week, so it can be considered a swing trade to hold at least the next week and into the following one).
--
After this post, I will upload another analysis on the Daily timeframe projecting the longer term move, so make sure to go in my profile to check it out.
GOOD LUCK

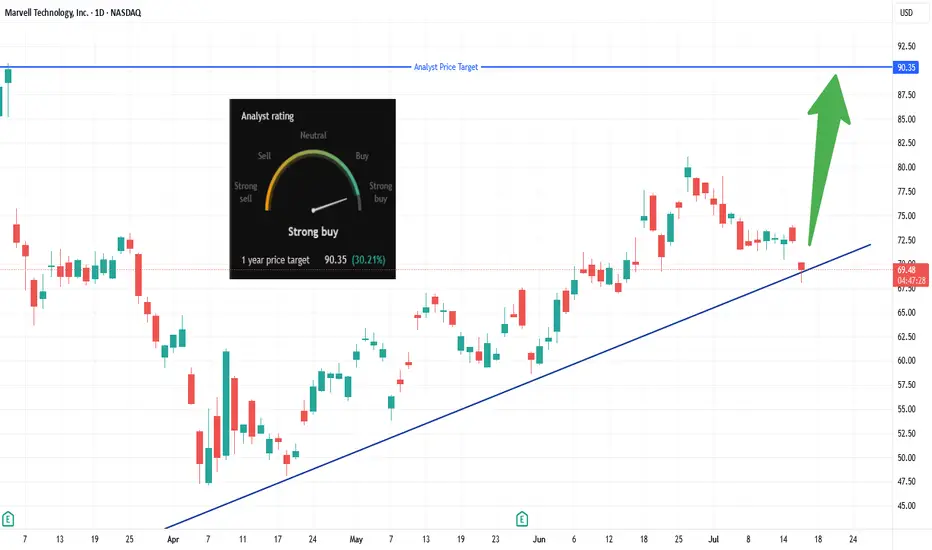
MRVL Long Breakout Setup, Eyes $90 Target!Looking to enter long on a clear breakout above $70.13 (today’s high).
• Entry: Above $70.13
• Stop-Loss: Below today’s low (~$68.50) to protect capital
• Target: $90.35 – per analyst consensus (~+30%)
✅ Why:
📈 Trendline bounce & momentum: Price holding strong above an ascending trendline from April suggests buyers are stepping in.
🏢 AI-chip catalyst: Marvell’s custom ASICs are gaining traction with Amazon, Microsoft, and Google—data-center demand is surging.
💰 Analyst confidence: Consensus is “Strong Buy” with average targets between $90–$94 (some as high as $133).
🧩 Market & Sector Tailwinds: AI chip stocks rallying; Marvell poised as lower-cost custom-chip alternative to Nvidia—and undervalued vs peers.
*** Be sure to follow us for more trade setups! ***
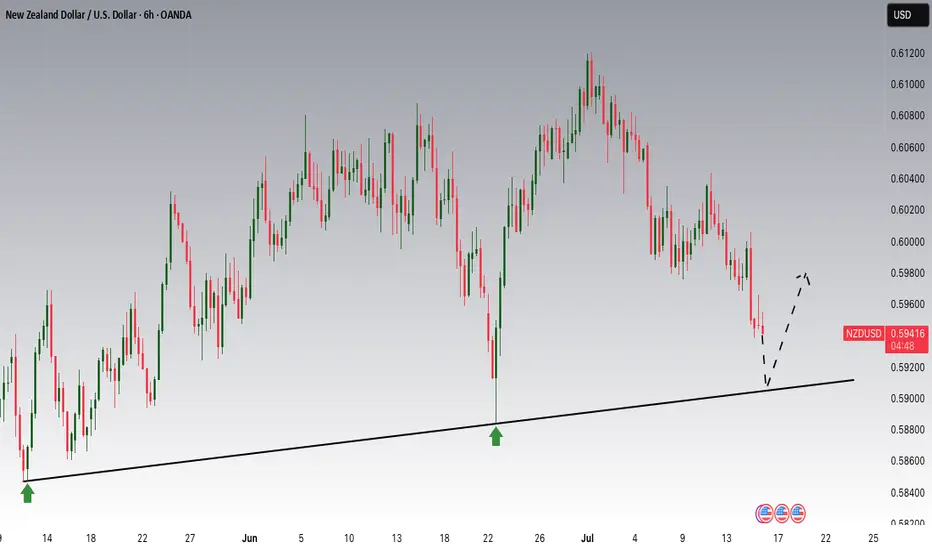
NZDUSD is Nearing an Important SupportHey Traders, in today's trading session we are monitoring NZDUSD for a buying opportunity around 0.59100 zone, NZDUSD is trading in an uptrend and currently is in a correction phase in which it is approaching the trend at 0.59100 support and resistance area.
Trade safe, Joe.
HelenP I. Gold will continue to decline and break support levelHi folks today I'm prepared for you Gold analytics. After a prolonged period of consolidation, we can observe how price has formed a symmetrical pennant pattern. Price respected both the descending and ascending trend lines, bouncing several times from each side. Recently, gold tested the upper boundary of the pennant near the 3390 resistance level but failed to break through, confirming the strength of the resistance zone between 3390 and 3400 points. Following this rejection, the price started to decline and is now approaching the support level around 3305. If this support doesn’t hold, the price may drop further and break out of the pennant downward. In that case, the nearest significant target lies at 3280 points — near the lower trend line and previous reaction zones. Given the current structure, repeated rejection from resistance, and narrowing volatility inside the pattern, I expect XAUUSD to exit from the pennant and move down, breaking the support zone. That’s why I remain short-term bearish and set my goal at 3280 points. If you like my analytics you may support me with your like/comment.❤️
Disclaimer: As part of ThinkMarkets’ Influencer Program, I am sponsored to share and publish their charts in my analysis.

Pay attention to 3320, if it falls below, go long at 3310-3300The short order has been completed and profit has been realized. Now the 1H technical indicators show that there is still room for decline in the short term. Focus on the 3320 support. If it falls below 3320, the gold price is expected to reach the 3310-3300 area, which is also an ideal trading area for intraday long positions. There is nothing much to say. Follow the wolves and you will get meat. Currently, the brothers who follow me to trade have all made good gains.
OANDA:XAUUSD
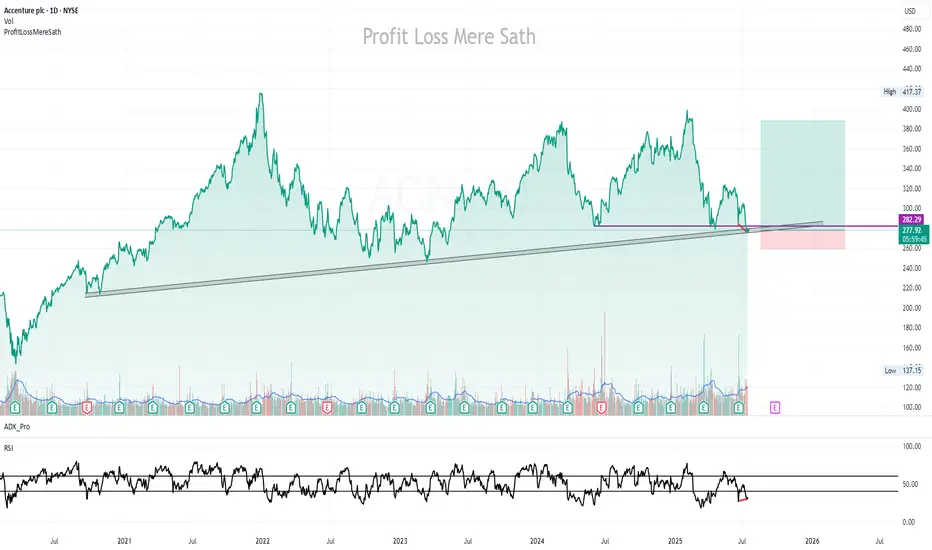
ACN | Buy @LTP | SL below 260 on closing basis | Target 385Disclaimer:
This is not financial advice. Please do your own research or consult with a financial advisor before making any investment decisions. Investments in stocks can be risky and may result in loss of capital.
The rebound is not a reversal, continue to shortGold showed a trend of rising and falling back and closing low on Tuesday. The highest intraday rise was 3366, and the lowest fell to 3320. The daily line recorded a medium-sized Yin line with a long upper shadow. The K-line was negative, and the closing line broke the resonance support of the middle track and the short-term moving average, suggesting that the bullish momentum has slowed down and the bears are ready to move. Today, we need to pay attention to the further downward performance of gold. From the 4H level, the price stood firm at the four-hour resistance position last Thursday, and then rebounded upward in the short term. Yesterday, the price fell below the daily support level. Currently, the short-term market is bearish, and attention is paid to the resistance in the 3340-3345 range above. In the one-hour period, the price is in short-term shock adjustment. On the whole, it will be treated as a shock decline before breaking yesterday's low, and the lower side pays attention to the 3225-3320 area support. In the short term, you can consider shorting at 3340-3350 in the European session, and look towards 3330-3320
OANDA:XAUUSD
Gold adjustment is complete and continue to be long
Gold rebounded at 3322 today. Technically, it needs to rebound and repair when it falls back to 3318-25, so we can find opportunities to go long below to seize the profit space of the rebound. If your current gold operation is not ideal, I hope I can help you avoid detours in your investment. Welcome to communicate with us!
From the 4-hour analysis, the upper short-term pressure focuses on 3340-45, and the lower short-term support focuses on 3318-20. Relying on this range, the main tone of high-altitude low-multiple cycle participation remains unchanged during the day. In the middle position, watch more and move less, and follow orders cautiously, and wait patiently for key points to enter the market.
Gold operation strategy:
Gold falls back to 3318-25 and goes long, stop loss 3312, target 3340-45, and continue to hold if it breaks;