USD/JPY ticks higher today!USDJPY has been trading strongly bullish in couple of days now and it seems the momentum ain’t slowing down anytime soon! Yes, this is a good time to opt in for a buy once we get any opportunity for that. We’re looking forward to tracking the market for a time price will begin to make a pullback so as to opt in for a buy.
Trend Lines

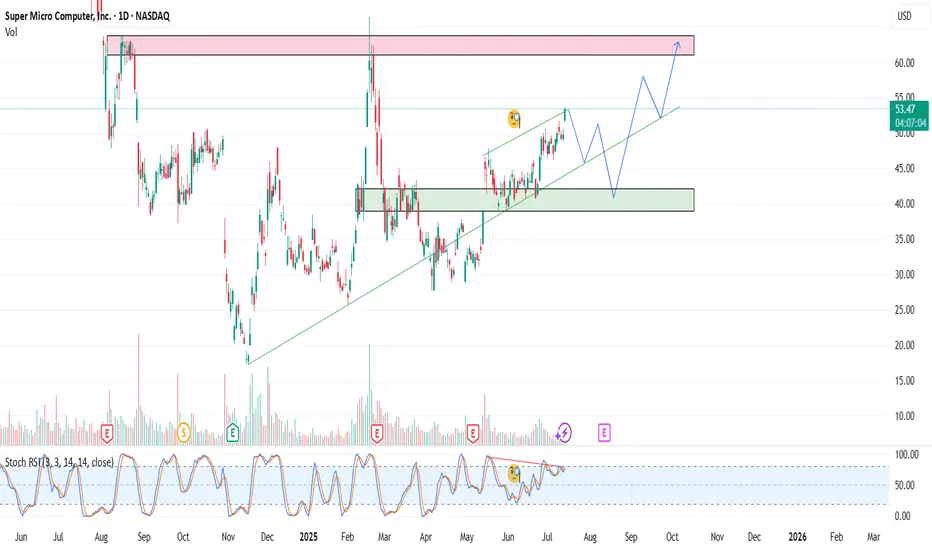
SMCI – Reloading the AI BeastSMCI continues to show strength as a key player in the AI infrastructure space. In this update, I present a new strategy with staggered entry zones at $49, $45, and $38 — designed to capture value during healthy pullbacks within a larger bullish trend.
Entry Plan:
1) $49
2) $45
3) $38
Target:
1) $56
2) $61
3) $66
📉 If price dips back to $45 or $38, I will reload heavier. No FOMO. Let the market come to us.
Drop a 👍 if you're still riding SMCI or waiting for the next entry.
This analysis is for educational and informational purposes only. It does not constitute financial advice or a recommendation to buy or sell any securities. Always do your own research and consider your risk tolerance before making investment decisions.
Gold bearishness once again in line with expectationsThe data released so far show that the US inflation data is stable and tends to decline, which increases the possibility of the Fed's monetary policy. The US dollar index fell first and then rose. Gold opened at around 3344 and rebounded all the way. The current highest rebound is around 3366. It fell back to 3352 before the data was released, and then quickly rebounded to 3360. After the data was released, it fell again quickly, and the current lowest touched around 3346. The short orders around 3360-3365 that we shared with brothers before were basically the highest short orders of the day, and we successfully completed our first goal. The brothers who participated in it all made good profits. Judging from the current trend of gold, we continue to participate in short orders during the rebound, and the long position is still around 3335-3330. After the release of the CPI data, it is bearish overall. The core is that it is lower than market expectations but higher than the previous value. Inflation has heated up again, which has once again suppressed the expectation of interest rate cuts. After this data, it also laid a good foundation for the decline in the market. If the price goes up again, it will still rely on the 3365 level to go short again. The data is obviously bearish, and it scared a lot of long positions before it was released.
Gold reference ideas:
Continue to short when it rebounds to around 3358-3365, with a target around 3350-3340;
Go long when it falls back to around 3335-3330, with a target around 3350.
EURAUD, Trend continuationPrice has made a correction and pulled back into the trendline, a continuation of the uptrend is the next.

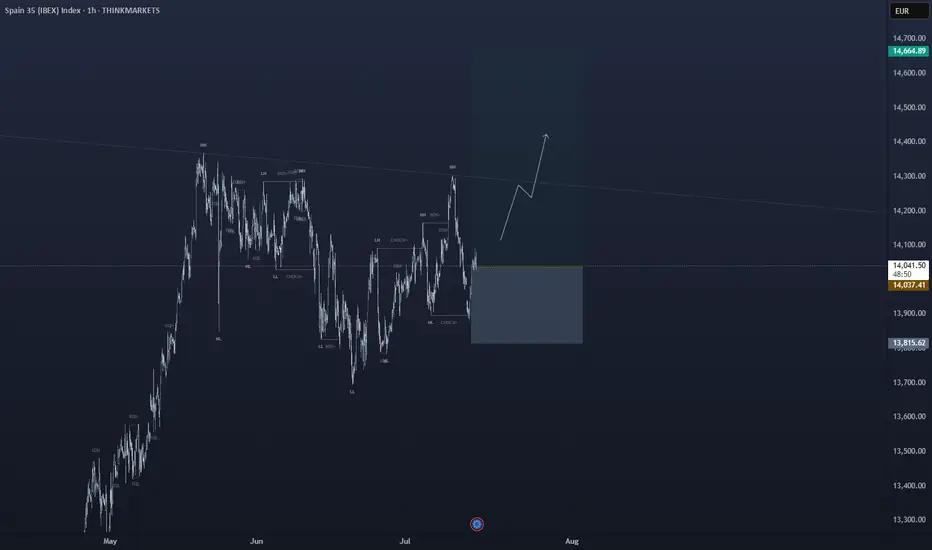
bullish on IBEX35Trading Idea Setup:
IBEX35 has given me enough confirmation indicators to forecast a bullish run from this price point. ↗️🟢
✅Favorable TP level(s):
⦁ 14269.64
⦁ 14357.51
🛑Stop Loss:
⦁ 13834.00
Indications used:
Trend confirmation indicator
Elliot wave assistance
Momentum indicators
______________________________
Trading Involves Risk: Decisions to buy, sell, hold, or trade in securities, commodities, and other investments carry inherent risk, including the possibility of substantial losses. Please ensure every trade placed is supported by your own thorough analysis and/or fundamental research.
Ps: All the trades that I place, I do hold indefinitely unless noted otherwise but TP points will always be provided. Happy Trading 🖤
Gold’s Uptrend Is a Mirage, Bears Are Lurking Beneath!Gold repeatedly touched around 3375 yesterday and then fell under pressure, proving that there is strong resistance above. Moreover, after gold retreated and touched around 3341 yesterday, it did not recover in time and stand above 3350. It was not until today that it rebounded and touched around 3365. The rebound cycle has been extended to the present, and the rebound strength is not very strong.
Since gold retreated, it has not been able to recover the lost ground in time. Gold is under pressure in the 3360-3370 area in the short term. If gold cannot successfully break through this resistance area during the day, then gold will retreat again, and will refresh the 3341 low again, and continue to the 3335-3325 area.
So for short-term trading, I think we can try to short gold in the 3360-3370 area appropriately, looking at the target area: 3350-3340
The battle for gold 3375-40 has begun, and CPI is coming!The current market has entered a short-term shock consolidation phase. Taking advantage of the temporary calm of the market, I would like to share my judgment and strategy with my brothers. I still tend to be bullish in the medium term. Yesterday's trend just verified my point of view. If the bulls want to break through the 3375 line, they must first complete the "deep squat wash", and this wave of retracement has also brought good profits to both our long and short traders. Friends who follow should have gained.
But the core of today is the CPI inflation data. As a heavy macro event, the recent forward-looking data (such as employment and labor market) is likely to be bearish for gold. The market has formed a consistent expectation. In this case, I have to temporarily put aside the long thinking and turn to short. My point of view is that as a qualified trader, I have always attached great importance to the data market. Whether it is non-agricultural, CPI or interest rate resolution, I have never easily made mistakes in grasping this kind of structural drive. Since the market has locked the focus of long and short positions in the core range of 3375-3340, we must face up to this structural competition. If the judgment is wrong this time, I will re-evaluate whether I should continue to participate deeply in this obvious data expectation transaction, but for now, I must respect the game logic of the market.
Operation strategy reference:
Currently, the 3360-3366 area can be lightly shorted. If it touches the 3370 line before the CPI is released, it can be appropriately covered; the stop loss is clearly set above 3375. Once it breaks through, leave the market decisively without hesitation. The lower target is 3350-3340 first. If it breaks, continue to look down to the 3330 area.

CPI is coming, gold 3340-3375 pay attention to the breakthrough
Review of yesterday's market trends and technical points:
Gold: Yesterday's opening gapped up and touched the upper track of the short-term channel and the 618 split resistance level of 3374. After being under pressure, it filled the gap and continued to choose to be bullish after stabilizing close to the middle track of the hourly line; the European session attacked 3374 many times without success, and the US session lost the middle track of the hourly line downward, which means that it is not urgent to be bullish repeatedly above the intraday low; finally lost the lower track of the short-term channel, so there will be a certain downward correction, but follow the trend of last Thursday and Friday. , the downward correction space is not large, just still stable above the daily middle track 3340, so use this as a defense, so continue to try to be bullish, today as expected ushered in a wave of higher;
Today's market analysis and interpretation:
First, the gold daily level: three consecutive positives and negative closing is a correction. According to the recent shock cycle, today is expected to close positive, and the focus is on whether the market can continue to rise in the future; today, the first thing to pay attention to is whether the middle track 3340 can stabilize and continue to rise, because yesterday's negative line is considered to be a correction. If the market can continue to fluctuate, then there is hope for testing 3400 and above; on the contrary, if it falls back to 3340 or below today, it will continue to hover below the resistance level of 3375, and the lower track line of the convergence triangle will support above 3300; then the CPI inflation data released today will be relatively important, and the market expects it to increase to 2.7% this time. Once the announced value is greater than or equal to 2.7%, then inflation will rise, which will weaken the interest rate cut and suppress the gold price; on the contrary, if the announced value is less than 2.7%, it does not meet the The market is expected to boost gold prices; if it is less than or equal to 2.4%, the probability of interest rate cuts will be increased, which will significantly boost gold prices;
Second, the 4-hour level of gold: today's focus is on the upper support of the lower middle track 3340 and the lower resistance of 3375 above, to see which side is effectively broken;
Third, the hourly level of gold: after stabilizing 3340 today, it will break through the early morning resistance level of 3351-52 and hit the 3365-66 line, so the overnight low bullishness will be successful; Currently it is running in a narrow range of 3365-3356, which means waiting for today's data; from a technical perspective, pay attention to the support of the middle track 3352 on the bottom. If it stabilizes, you can continue to be bullish. Pay attention to the resistance of 3374-75 on the top. Only when the big sun or continuous sun breaks through can new room for pull-up be opened; if the data is bearish and the middle track is not held downward, there is no rush to be bullish. Wait for the downward momentum to slow down, and a stop-loss signal will appear. If there are signs of sideways trading at the bottom, choose to layout low and long. Below 3340, there is still 3334 and 618 support, which is also the annual average. If it goes down again, it will give a good bottom speculation low. You can directly sell below 3310. The market will still repeatedly attack the resistance of 3365 and 3374 if it is stable; as long as it converges along the lower track of the daily triangle, the lows gradually move up, and every time it approaches the low, it is a good bottom speculation point, and there is basically a pull-up of 50-100 US dollars.
GOLD (XAUUSD): Mid-Term Outlook
Analysing a price action on Gold since March,
I see a couple of reliable bullish signals to consider.
As you can see, for the last 4 month, the market is respecting
a rising trend line as a support.
The last 4 Higher Lows are based on that vertical support.
The last test of a trend line triggered a strong bullish reaction.
The price successfully violated a resistance line of a bullish flag pattern,
where the market was correcting for almost a month.
A strong reaction to a trend line and a breakout of a resistance of the flag
provide 2 strong bullish signals.
I think that the market may grow more soon and reach at least 3430 resistance.
An underlined blue area will be a demand zone where buying orders will most likely accumulate.
❤️Please, support my work with like, thank you!❤️

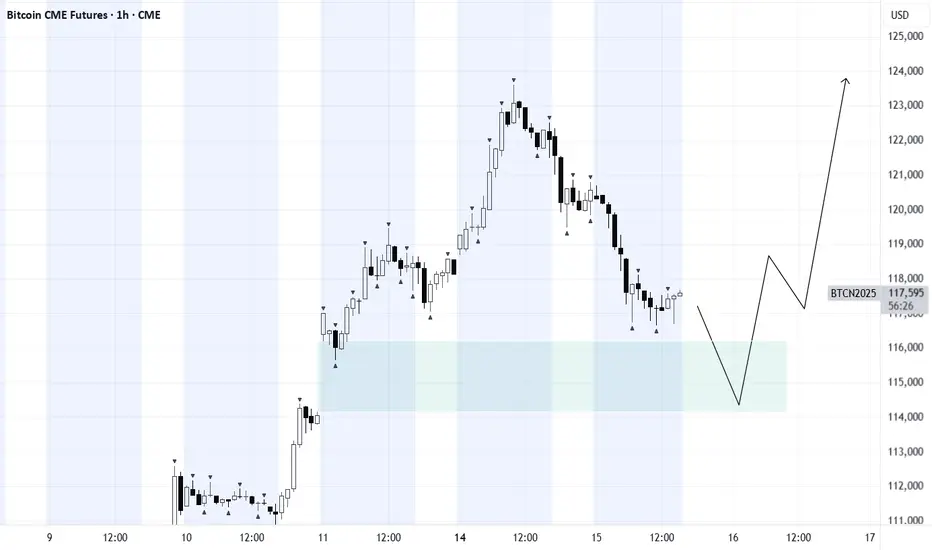
HelenP. I Bitcoin will go to a correction after a strong impulseHi folks today I'm prepared for you Bitcoin analytics. If we look at the chart, we can see that the price has recently made a powerful impulse upward, breaking out of a long consolidation range between 110500 and 102500. This range acted as a strong accumulation zone, where the price bounced multiple times from both support levels. After the breakout, Bitcoin gained momentum and pushed sharply toward the 122000 mark. Now, after this sharp rally, I believe a correction is highly probable. Often, after such strong bullish moves, the market tends to pull back to retest the trend line or previous breakout zones. In this case, the trend line has been respected several times and now aligns with the 117500 area, which also acts as local support. That’s why I consider this zone to be a logical target for the correction. I expect BTCUSD can drop from the current highs and retest the trend line near 117500 points - that is my main goal for this setup. If the trend line holds, buyers may return to the market and push price higher again. Given the strong impulse, the breakout from consolidation, and the importance of the trend line, I remain bearish short-term and expect a drop toward 117500 points. If you like my analytics you may support me with your like/comment ❤️
Disclaimer: As part of ThinkMarkets’ Influencer Program, I am sponsored to share and publish their charts in my analysis.

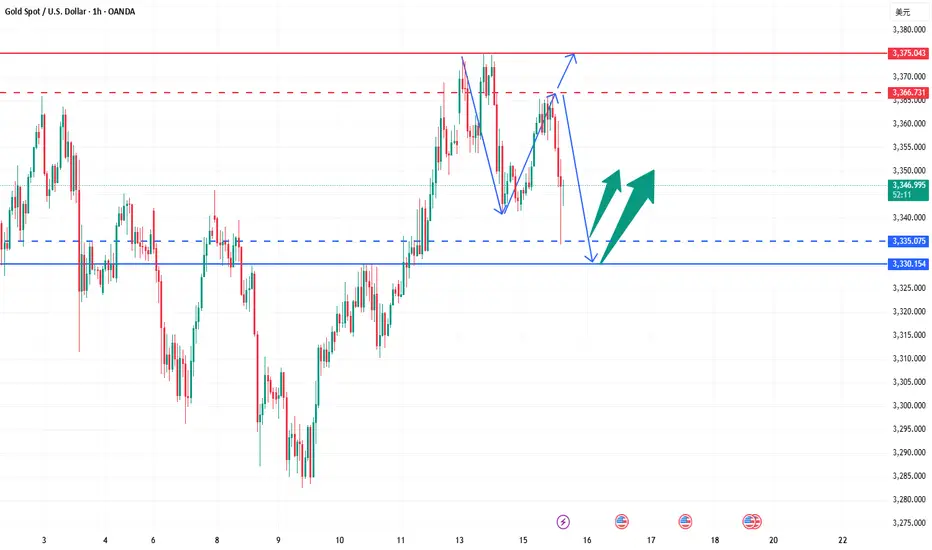
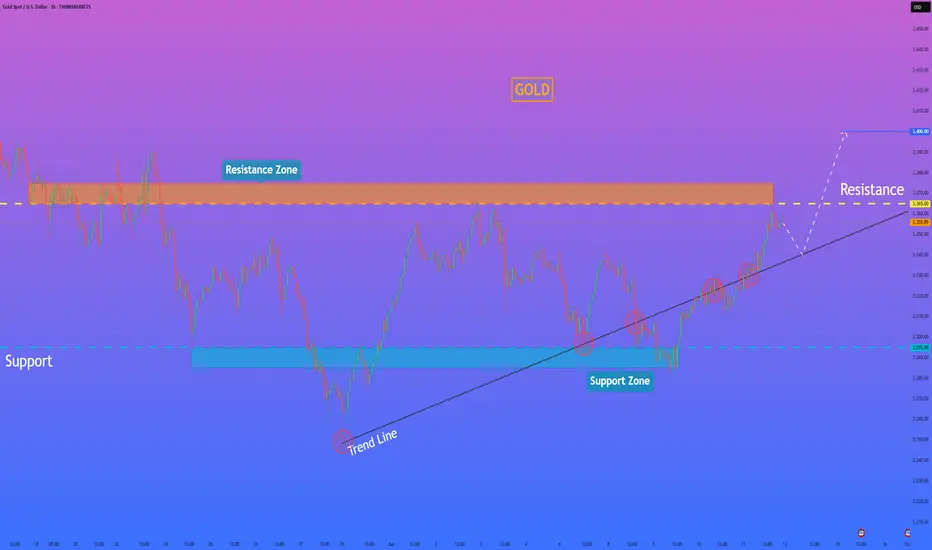
HelenP. I Gold will break resistance level and continue to growHi folks today I'm prepared for you Euro analytics. After a strong bullish impulse, the price managed to break above the local resistance zone and reach the 3365 level. This zone had previously acted as a barrier for upward movement, but now the price is consolidating just below it, forming a possible correction setup. I see that price followed a clear trend line during its recent rally, and multiple times this line acted as dynamic support. The buyers respected it and entered the market with each touch. Currently, Gold is hovering near the upper boundary of the resistance zone. I expect that before continuing to grow, the price may make a slight correction toward the trend line, using it again as a support for a potential rebound. This would also allow the market to gather more liquidity before targeting new highs. Once the correction completes and the trend line holds, I expect gold to rise again, break through the 3365 resistance level, and continue its upward movement toward 3400 points, which is my main goal for this setup. Given the strong trend, the bullish impulse, and clear support from the trend line, I remain optimistic and anticipate further growth. If you like my analytics you may support me with your like/comment.❤️
Disclaimer: As part of ThinkMarkets’ Influencer Program, I am sponsored to share and publish their charts in my analysis.
Will CPI data boost gold to 3,400?
💡Message Strategy
Gold prices rebounded modestly in the Asian session, supported by a weaker dollar and safe-haven demand. The market is currently focusing on the upcoming June CPI data from the United States, and investors are reassessing whether the Federal Reserve may start a rate cut cycle this year.
The overall CPI (year-on-year) is expected to grow by 2.7%, and the core CPI may reach 3.0%. If the data is lower than expected, it will strengthen the market's bet on a rate cut in September, which is bearish for the dollar and bullish for gold.
The current market has expected that the probability of the Federal Reserve cutting interest rates in September is about 60%, and the probability of a 50 basis point rate cut before the end of the year is about 50%.
📊Technical aspects
Gold price (XAU/USD) maintains a bullish structure as a whole and is currently testing the key resistance level of $3365. If it can effectively break through this area, it will open up the upside, with the target pointing to $3400 or even $3435.
On the daily chart, MACD maintains a positive opening, and the momentum indicator shows that buying is still active, and the short-term trend is to continue to rise. On the contrary, if the gold price is blocked near 3365-3370, it may fall back to the support area of 3340 US dollars. Further support is near 3326 and 3300 US dollars, which is still regarded as a potential area for bargain hunting.
💰Strategy Package
Long Position:3345-3355,SL:3335,Target: 3380-3400
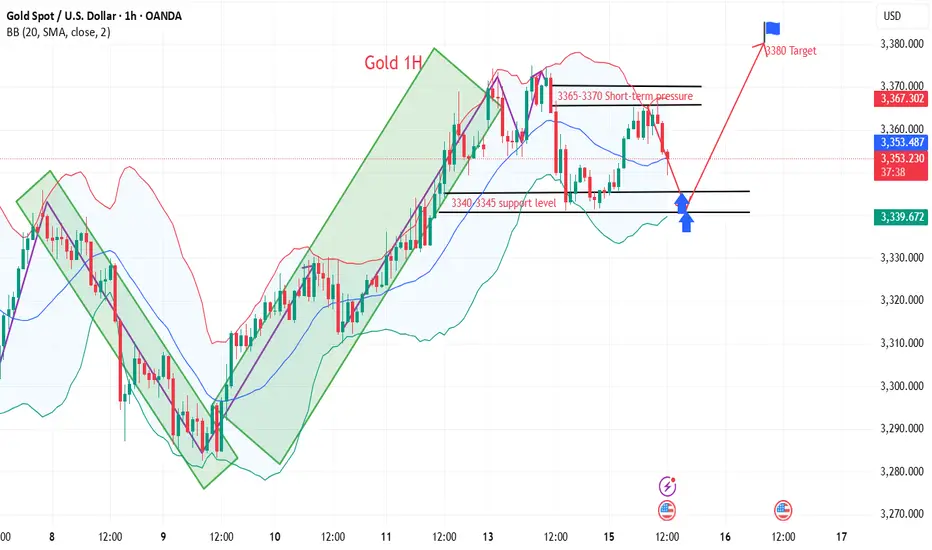
It is expected to fluctuate and fall before CPI data📰 News information:
1. Focus on tomorrow's CPI data
2. Bowman's speech at the Federal Reserve
3. Tariff information outflows and countries' responses to tariff issues
📈 Technical Analysis:
The 1H chart shows that the gold price continued to pull back last night and then fluctuated at the bottom, and continued the rebound trend this morning. The key pressure level is the top and bottom conversion level. The current rebound in gold is only a secondary confirmation of the top structure at the 30-minute level. After reaching 3365, it has shown signs of short-term pressure. In a volatile market, if the price begins to consolidate horizontally, it may indicate the end of this round of volatile upward trend, and it will enter a downward phase later. Considering the market sensitivity before the release of CPI data, it is recommended to focus on the volatile decline trend. After today's rebound, it is necessary to focus on the 3365-3368 area as a short-selling range, and the long-short defense position is set at yesterday's intraday high of 3375. The support below focuses on the 3350-3340 range.
🎯 Trading Points:
SELL 3358-3368
TP 3345-3333
In addition to investment, life also includes poetry, distant places, and Allen. Facing the market is actually facing yourself, correcting your shortcomings, facing your mistakes, and exercising strict self-discipline. I share free trading strategies and analysis ideas every day for reference by brothers. I hope my analysis can help you.
FXOPEN:XAUUSD TVC:GOLD FX:XAUUSD FOREXCOM:XAUUSD PEPPERSTONE:XAUUSD OANDA:XAUUSD
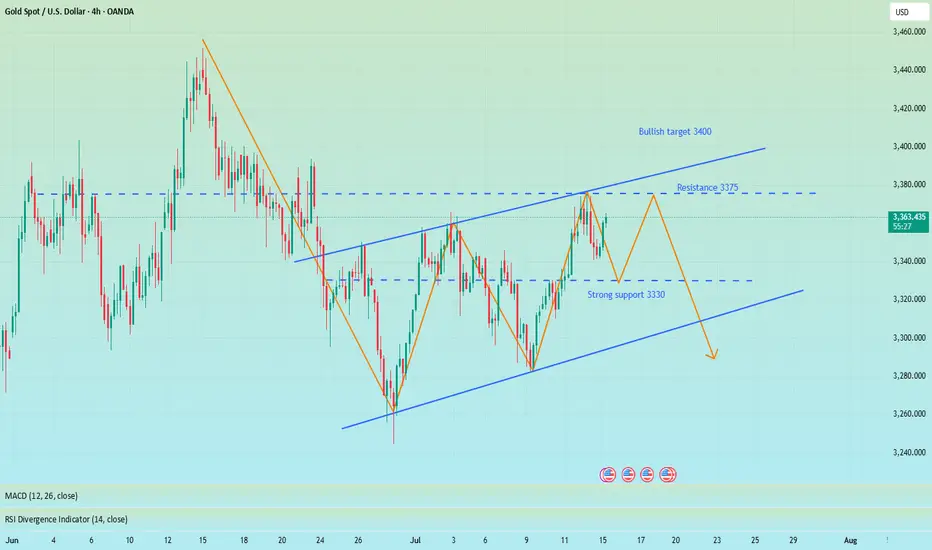
How to grasp the key trading points of gold?Yesterday, gold tested the 3375 line several times but failed to break through effectively. The selling pressure on the market was obvious, and the price immediately fell back, reaching a low of around 3341. The daily line closed with a long upper shadow, indicating that the bullish momentum has weakened and the short-term market has entered an adjustment phase. From the perspective of the 4-hour cycle, the continuous negative trend has led to the gradual closing of the Bollinger Bands, and the middle track position has temporarily gained support, but the overall market is volatile and weak. Today, we will focus on the 3354 watershed. If the rebound fails to effectively stand at this position, the pressure on the upper side will still be strong, and there is a risk of a short-term decline.
Key technical positions: upper resistance: 3365, 3354, lower support: 3340, 3330. In terms of operation rhythm, it is recommended to deal with it with a high-selling and low-buying, oscillating approach, and maintain flexible adjustments.
The operation suggestions are as follows: You can choose to short in the 3360-3365 area, with the target around 3350 and 3340; if the rebound is blocked below 3354, you can also enter the short order in advance. It is recommended to enter and exit quickly in the short-term weak market; strictly control the stop loss to avoid risks caused by sudden changes in the market.
The current market is obviously volatile, so don't blindly chase the rise and fall. It is particularly important to operate around the key pressure and support areas. The grasp of the rhythm will determine the final profit, and steady trading is the kingly way.
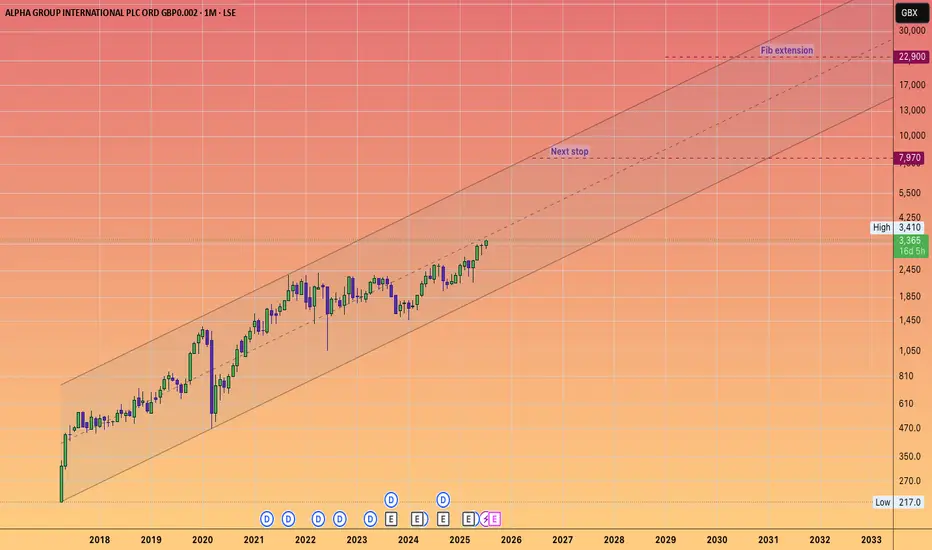
ALPHA GROUP INTERNATIONAL will keep its momentum going!#ALPHA is a fintech company that offers currency risk management and payment solutions.
With a price-to-earnings ratio of approximately 12,
it signifies a solid investment for a growth-oriented fintech firm that is increasing its earnings by about 20 to 25% annually.
In light of the #UKX breaking through and reaching new highs, and beginning to accelerate towards my long-standing projections that the FTSE would hit 5 figures, ALPHA appears to be a unique opportunity in the UK markets, which, as we know, are relatively sparse compared to the USA.
Given the inability to purchase shares of #Revolut, it is likely that capital will flow into this ticker.
BTCA gap is currently in play. For further upside, it would be healthy to see a full or partial fill in the near term, followed by a strong reaction.
Such a move would signal strength and validate bullish momentum.
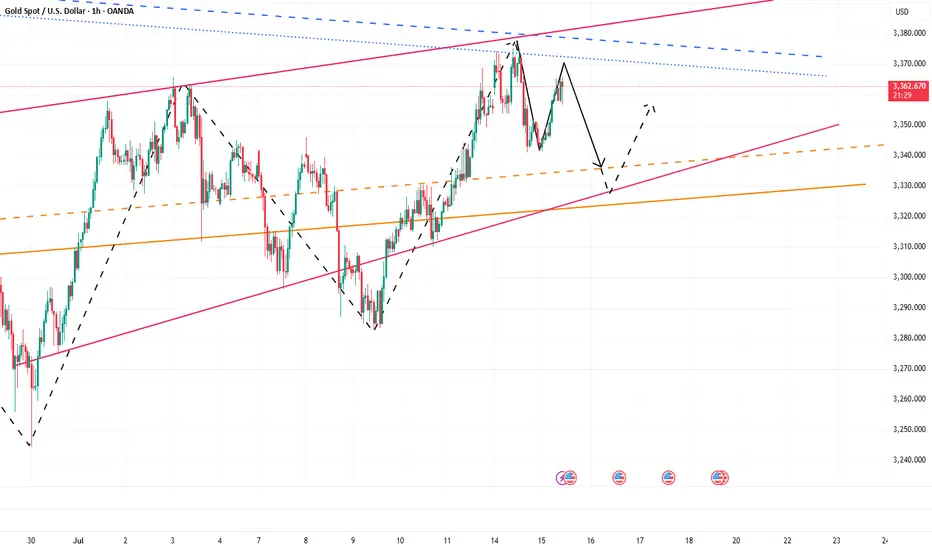
Bullish adjustments are ready to counterattack at any time
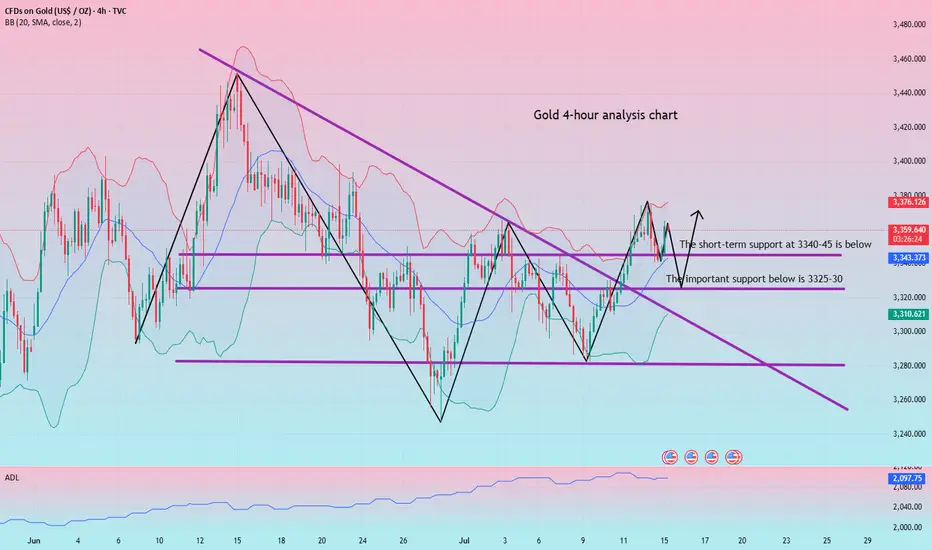
Today, we will first look at the adjustment of gold. The current overall price framework is relatively favorable to bulls. After all, after the continuous breakthrough in the previous period, the current daily line has also stood firmly above the short-term moving average. Whether it will reverse again in the future is also the key trend in the later period. Although the US market was in a retracement yesterday, it did not break the key support of 3325-30 below. This position can also be used as the key support point and watershed position in the later period. Only if this position continues to fall, it may turn from long to short in the later period. Yesterday, we had a long order at 3341 and successfully made a profit at 3348. After three consecutive trading days of rebound, the overall price finally came under pressure at the 3375 mark and ushered in a suppressed decline and shock adjustment. Although there was a shock decline adjustment in the short term, the overall technical pattern is still in the bullish shock upward rhythm. If your current gold operation is not ideal, I hope I can help you avoid detours in your investment. Welcome to communicate!
From the 4-hour analysis, the bullish strong dividing line below is 3325-30. Below, we focus on the short-term support of 3340-45. The daily level stabilizes at this position and continues to maintain the bullish rhythm of falling back and following the trend. The short-term pressure focuses on the vicinity of 3370-75. The overall main tone of high-altitude low-multiple cycle participation remains unchanged based on this range.
Gold operation strategy:
Gold falls back to 3340-45 and goes long. Fall back to 3325-30 and add more positions. Stop loss 3317. Target 3365-70. Continue to hold if it breaks;
GBPJPY Bullish Breakout IncomingAnother bullish breakout on the H4 TF is pending. The trend has been consistently bullish and confirmations of a continuation are clear.
Wait for that breakout of the bullish pattern and ride the trend.

GOLD → Consolidation ahead of CPI. Chances for growth?FX:XAUUSD Gold is consolidating amid a correction in the dollar ahead of important news. Consumer price index data is due later today. The market is stagnant and will not move prematurely.
On Tuesday, gold rose slightly amid profit-taking ahead of the US CPI release. Investors are waiting for a signal from inflation: weaker data could strengthen bets on a Fed rate cut and support gold, while strong inflation would strengthen the dollar and put pressure on the metal. The situation is exacerbated by Trump's new tariff threats and his criticism of the Fed chair. Let me remind you of Trump's pressure on regulators regarding inflation and interest rate cuts.
Technically, gold is trading above the previously broken “symmetrical triangle” consolidation. Bulls are trying to hold their ground above 3340-3350. Focus on the current range of 3340-3373
Resistance levels: 3373, 3394
Support levels: 3350, 3340
Favorable news for gold could boost interest in the metal, which would generally lead to growth. However, there is a factor of unpredictability, and against this backdrop, gold may test support at 3350-3340. If the bulls manage to keep the price above this zone, we may see growth in the medium term. Otherwise, the price may drop to 3310-3280.
Best regards, R. Linda!

DXY wants upBut first we retest that trendline.
Giving us a brief window for risk on.
Maybe even until Q1 2025.
Hopefully.
(I'm biased)

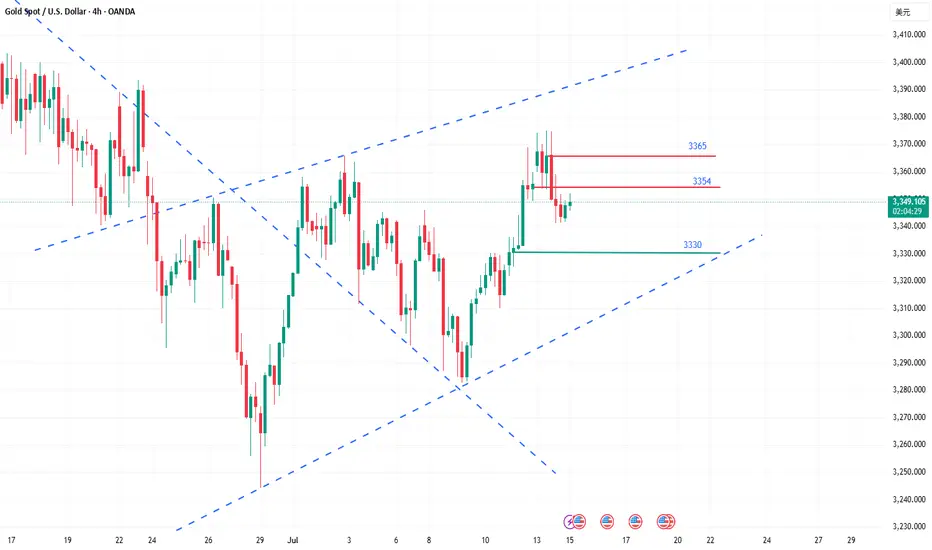
Buy XAUUSD?Date: July 15, 2025
Pair: XAUUSD (Gold Spot)
Timeframe: 4H
Direction: Long
Entry: ~3,360
Stop Loss: ~3,327 (below sell-side liquidity)
Take Profit: ~3,492
RR Ratio: ~1:4
⸻
🔍 Market Context
• Price had been trending downward and then consolidated for several sessions.
• A sell-side liquidity sweep occurred just below 3,327 — taking out stops beneath local lows.
• Strong bullish reaction followed, forming a clean bullish order block and reclaiming structure.
⸻
🎯 Trade Rationale
• Sell-side liquidity taken → market structure shift → bullish BOS (break of structure).
• Bullish order block formed with clear mitigation.
• Small black-box consolidation likely a retest zone for low-risk entry.
• Targeting inefficiency toward 3,492, with a clean range above.
⸻
🧠 Trade Management Plan
• Move stop to breakeven at 3,375 once price clears local resistance.
• Consider partial TP at 3,420–3,450 to lock profit.
• Trail remainder to higher lows or use fib-based trailing stop.
⸻
😐 Emotional State Before Trade
Calm and focused. Recognized a textbook SMC entry — no rush or FOMO.
⸻
✅ Post-Trade Reflection (To Fill Later)
• ❓ Did price react to the zone as expected?
• ❓ Was entry execution precise (limit vs market)?
• ❓ Any slippage or management improvements?
• ❓ Was I patient enough?

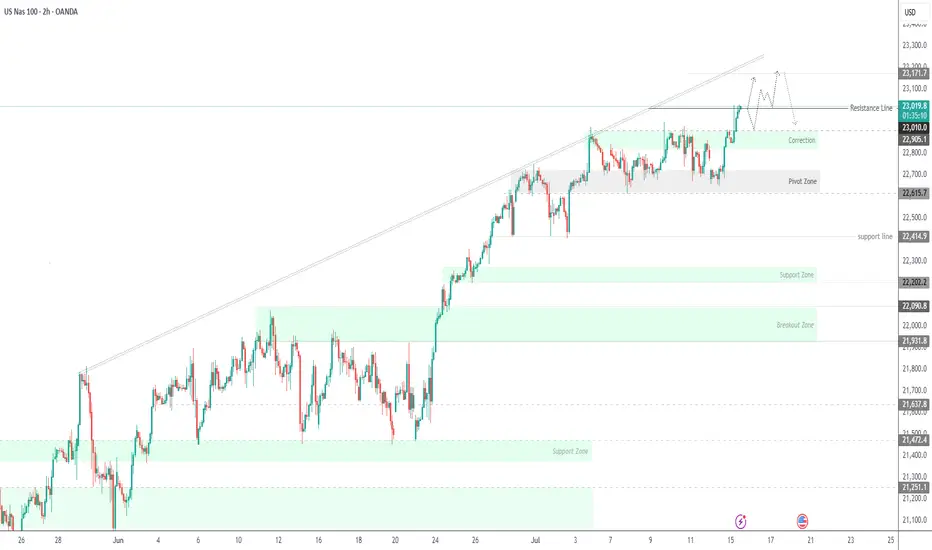
USNAS100 Outlook – CPI Data to Confirm Breakout or PullbackUSNAS100 – Bullish Momentum Holds Ahead of CPI
USNAS100 continues to show strong bullish momentum, trading above 22,905 and recently printing a new all-time high (ATH).
As long as price remains above this level, the next upside target is 23,170, followed by 23,300.
Market Focus – CPI Data Today:
• Expected: 2.6%
• Below 2.6% → bullish reaction likely
• Above 2.6% → bearish pressure expected
• Exactly 2.6% → could trigger a short-term bearish pullback
Key Risk Level:
A confirmed break below 22,905 would signal weakness and open the door for a correction toward 22,615.
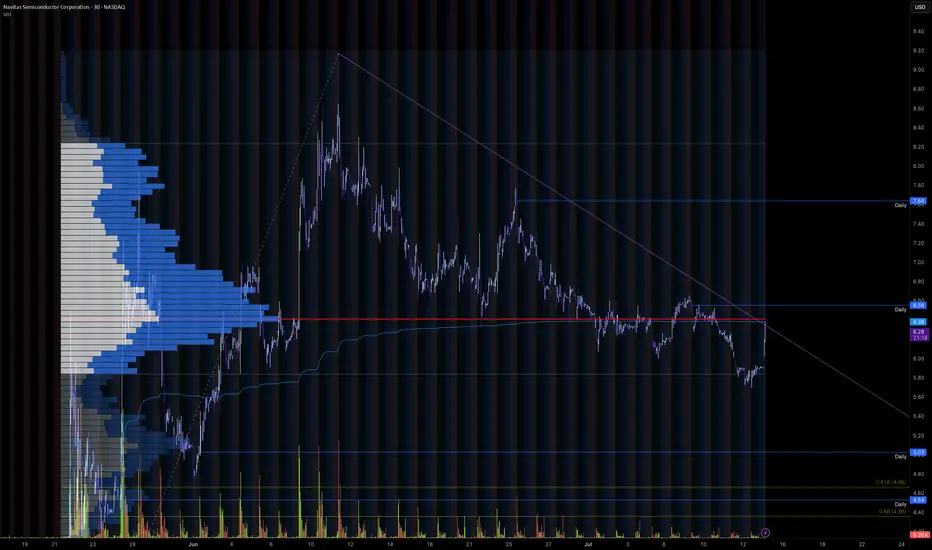
Trendline Breakout for Wave 3Navitas is currently looking at breaking out of its recent downtrend to potentially begin wave 3 of its move up, which, as we all know, is the most impulsive move.
Could be very tasty after a 350% pump already
Need to get above the range POC and breakout of the trend line, would be looking to get in on the retest of the downtrend line.