Sudarshan Chemical Industries📊 Chart Highlights:
Current Price: ₹1,023
Fibonacci Resistance: Price is approaching the 0.618 Fib level at ₹1,027.60, which is a key resistance.
Box Range: Trading within a consolidation box (approx. ₹940–₹1,030) — currently testing the upper end of the range.
Volume: Volume is moderate; not a strong breakout candle yet.
RSI: Trending upwards, nearing overbought (above 60), positive momentum.
Heikin Ashi Candles: Showing bullish strength.
✅ Recommendation: BUY (on confirmation)
📌 Buy Entry:
Buy above ₹1,035 only on breakout confirmation with volume (i.e., daily close above ₹1,035).
🎯 Targets:
Target 1: ₹1,090 (Fib 0.786 level)
Target 2: ₹1,170 (Fib 1.0 level)
Target 3: ₹1,270 (Fib 1.272 extension)
❌ Stop Loss:
Place SL around ₹980 (just below the Fib 0.5 level and EMA cluster)
⚠️ If Rejected at ₹1,030:
Consider range trading: Sell near ₹1,030 with target ₹940–₹950 and SL ₹1,040.
Wait for a clean breakout or breakdown before taking large positions.
Trendlineanalysis

Bitcoin - This Is Just Wonderful!Bitcoin ( CRYPTO:BTCUSD ) creates textbook market stucture:
Click chart above to see the detailed analysis👆🏻
The entire stock market is selling off significantly but Bitcoin and most cryptocurrencies are still holding their strong levels. This is clearly a sign of bullish strength and even if we see a retest of the previous all time high, the overall uptrend remains perfectly valid over the next months.
Levels to watch: $70.000
Keep your long term vision,
Philip (BasicTrading)

EURJPY still bullish view
OANDA:EURJPY first analysis attached, in new analysis, we have new structures created (BULLISH FLAG, ZONE, TREND LINE), both pairs dominant in market, personally here still bullish i am.
SUP zone: 160.350
RES zone: 163.400, 164.100

MRP Agro Ltd shows strong fundamentals with significant revenue MRP Agro Ltd shows strong fundamentals with significant revenue and profit growth, high ROCE (39.2%) and ROE (30.3%), and is almost debt-free, making it a financially sound company. Technically, the stock has bounced from a support zone with a bullish breakout from a falling wedge pattern, suggesting potential upside. Based on both technical and fundamental analysis, a buy is recommended with a target of ₹160 and a stop loss at ₹120, for a short- to medium-term horizon (3–6 months). However, investors should monitor liquidity and watch for dividend announcements.
for educational purposes only

Google - Fantastic Bullish Break And Retest!Google ( NASDAQ:GOOGL ) just looks amazing:
Click chart above to see the detailed analysis👆🏻
For more than a decade, Google has been trading in a rising channel formation, perfectly respecting all market structure. Now, Google is about to retest the previous all time high once again and with a sharp correction of about -25%, this offers a significant bullish reversal setup.
Levels to watch: $150
Keep your long term vision,
Philip (BasicTrading)

Nasdaq Technical Analysis. What Makes Nasdaq a Trader’s Favorite📊 Nasdaq Technical Analysis – Week 15, 2025
This week’s Nasdaq structure suggests a high probability of sideways movement between 19,500 and 18,700,
despite recent macro-driven volatility.
Key headlines include: – U.S. tariff adjustments & China’s 125% retaliation
– March CPI hitting the lowest level since early 2021
– Bond market instability and capital outflows
From a technical perspective:
🔹 volatility on the weekly is overheated — suggesting reduced volatility ahead
🔹 Fibonacci 0.618 near 20,084 may act as short-term resistance
🔹 Ideal long zone sits between 18,600 and 18,700, with invalidation below 18,500
(by 12H closure)
🔹 Ideal long zone sits between 18,000 and 18,300, with invalidation below 17,900
(Just a touch of 17,900 might invalidate this idea)
This analysis includes trendline setups held since 2023, confirming the value of clean charting.
A full structure review from Yearly to 4H charts is included.
No news-based guesswork. Just structured, chart-driven insight.
📌 If this chart aligns with your bias, feel free to save, comment, or follow.

Ethereum - The Perfect Crypto Trade!Ethereum ( CRYPTO:ETHUSD ) is retesting massive support:
Click chart above to see the detailed analysis👆🏻
For the past four years, Ethereum has overall been trading sideways with significant swings towards the upside and downside. As we are speaking, Ethereum is retesting a significant confluence of support and if the bullrun actually continues, Ethereum will rally parabolically.
Levels to watch: $2.000, $4.000
Keep your long term vision,
Philip (BasicTrading)

Why make it too complicated?!!Find the trend, follow the trend and stay on the trend. If can't find the trend then wait, trading is a marathon and not sprint.

Dow Jones - Value Is The King Of 2025!Dow Jones ( TVC:DJI ) withstands all bearish struggles:
Click chart above to see the detailed analysis👆🏻
All major U.S. indices have been weakening lately but the Dow Jones is clearly the strongest of all. It seems like big institutions are shifting back to value stocks and therefore the Dow Jones remains very strong. Looking at technicals, this trend is rather likely to continue during 2025.
Levels to watch: $40.000, $50.000
Keep your long term vision,
Philip (BasicTrading)

Weekly CLosing is ImportantWeekly Closing above 26.70 would be
very positive. However, 29 - 29.20 is
the Immediate Resistance Level.

XAUUSD Daily Sniper Entry Plan – April 10, 2025 Multi-Timeframe Analysis (D1, H4, H1, M15)
D1: Bullish overall with higher highs and higher lows, price testing resistance near the 3100 area.
H4: Bullish continuation with clear market structure, price still finding support at lower levels.
H1: Structure showing a potential breakout to the upside but also needs confirmation from rejection at supply zones.
M15: Currently in a retracement, testing critical order block zones that could dictate the next big move.
Macroeconomic Context
Fed Rate & NFP: The Fed's dovish stance and recent NFP data support the continuation of bullish sentiment in gold.
CPI & ISM: Inflationary pressures remain, supporting demand for gold, and driving market uncertainty that adds to gold’s safe-haven appeal.
Trend Bias
Bullish Bias: The market is overall bullish, but be cautious around key resistance zones. Look for confirmation of breakouts or pullbacks before entering.
Bearish Bias: If price fails to break above key resistance, a correction could occur, targeting the identified sell zones.
Liquidity Zones & Imbalances
The zones at 3,035-3,040 and 3,066-3,068.50 represent significant demand and order block areas where price has previously reacted. These are prime for buy entries.
Keep an eye on 3,125-3,139 as the potential sell zone, where price has shown previous rejection.
💰 Key Zones
🟩 Buy Zones (Potential Bounce Zones):
🛒 3,066–3,068.50: Sweet spot for a bullish bounce! 📉
🛒 3,035–3,040: Deep value zone! If we get a bounce here, it’s gold! ✨
🟥 Sell Zones (Potential Reversal Zones):
🚫 3,125–3,139: Major resistance, could trap bulls! ⛔
🚫 3,095–3,108: Intraday fade; short potential here! 💥
🎯 Sniper Entries
🟩 Buy Scenario 1 – “Reclaim the Bounce”
📍 Entry: 3,066–3,068.50
💡 SL: Below 3,055
🎯 TP: 3,089 | 3,113.50 | 3,127
🧠 Trigger: Look for CHoCH or Bullish Engulfing on M1/M5 for confirmation.
🟩 Buy Scenario 2 – “Deep Value Pullback”
📍 Entry: 3,035–3,040
💡 SL: Below 3,025
🎯 TP: 3,080 | 3,095 | 3,110
⚡ Tip: Wait for a strong bullish reaction on M5/M15.
🟥 Sell Scenario 1 – “Double Top Trap”
📍 Entry: 3,125–3,139
💡 SL: Above 3,145
🎯 TP: 3,105 | 3,080 | 3,055
⚠️ Tip: Look for a rejection on M5 or M15, with a bearish engulfing.
🟥 Sell Scenario 2 – “Intraday Fade”
📍 Entry: 3,095–3,108
💡 SL: Above 3,110
🎯 TP: 3,080 | 3,060 | 3,040
⚡ Tip: Move SL to breakeven once TP1 hits quickly! 🏃♂️💨
⚠️ Trend Bias
📉 Bearish Short-Term: Watch for rejections at resistance. If the price pushes above 3,139, we may reconsider the bias. 💡
💥 Key Tips & Reminders:
🎯 Patience is Key: Wait for confirmation before entering any trades — no confirmation, no entry! 🕰️
🚀 Risk Management: Keep your SL tight, and only enter when you feel the setup is perfect! 🔥
💡 Be Smart, Trade Smart: Always manage your risk and stick to your plan. 🌟
🔔 Join the Community!
👍 Like this post if you found it useful!
💬 Comment with your thoughts or ask questions below!
🔔 Follow for more precise daily setups!
🔔 Subscribe to stay updated with the latest trading plans!
Stay sharp, stay kind, and let’s trade with precision! 💛

Amd - The One And Only Setup For 2025!Amd ( NASDAQ:AMD ) shifts to a very bullish market:
Click chart above to see the detailed analysis👆🏻
Perfectly following previous cycles, Amd corrected about -60% over the past couple of months. However now we are seeing some first bullish signs at a major confluence of support. If we actually also witness bullish confirmation, an incredible rally of about +200% could follow.
Levels to watch: $100, $300
Keep your long term vision,
Philip (BasicTrading)

Play wisely!Currently at an Important Support level.
Bullish Divergence on Daily Tf.
Currently also at Channel Bottom.
Couple of Bullish Candles will confirm that
Channel Bottom is respected.

Microsoft - A Little Lower And Much Higher!Microsoft ( NASDAQ:MSFT ) is about to retest strong support:
Click chart above to see the detailed analysis👆🏻
In mid 2024 Microsoft perfectly retested the previous channel resistance trendline and the recent weakness has not been unexpected at all. However the overall trend still remains rather bullish and if Microsoft retests the previous all time high, a significant move will most likely follow.
Levels to watch: $350
Keep your long term vision!
Philip (BasicTrading)

parallel channel vs goldgold price went up in last march month
but rising price has made a clear parallel channel on h4 chart
price testing upper line and get intraday rejection instantly. if price start correction then lower line of the channel will be next big dynamic support level

As I always emphasized, when you find the trend - stay :)When you find the trend, follow it and stay on it as long as it is valid. I uses STFLAT and oh boy, happy I did.

Bitcoin RED Trendline still is dumping price soon 72K$As we can see on chart too Red trendline resistance is now one of the major resistances for Bitcoin and the other one is 93K$ so until these resistances are still holding and are valid price can fall more and see more dump to the next target which is 72K$.
DISCLAIMER: ((trade based on your own decision))
<<press like👍 if you enjoy💚

Bitcoin Squeeze Point – Breakout or Breakdown?Bitcoin is approaching a key inflection zone where the Daily Downtrend Resistance and the Monthly Uptrend Support intersect. This confluence could be setting the stage for a major breakout or breakdown, and the next move could define BTC’s medium-term trend.
🧠 Key Levels to Watch:
Daily Downtrend Resistance (Red) – Price is testing this descending trendline again.
Monthly Uptrend Support (Green) – Strong support held since August 2024.
Fibonacci 0.5 Level (~79.3K) – Acting as mid-zone control point.
Fibonacci 0.618 Golden Zone (~72K) – Strong historical retracement support.
🟦 Bullish Scenario (Blue Arrow):
If BTC breaks above the daily downtrend and holds above the green uptrend line:
Possible target: 110K, aligning with the 1.0 Fibonacci extension.
Would confirm continuation of the larger bullish trend.
🔻 Bearish Scenario (Not drawn but implied):
If BTC breaks down below 79K and the monthly trendline:
Eyes on 72K for a potential bounce at the 0.618 Fib level.
Below that, potential deeper retracement toward the 65K–60K zone.
⏳ Conclusion:
BTC is sitting at a high-confluence zone. This is not the time to chase—wait for confirmation of breakout or breakdown before reacting.

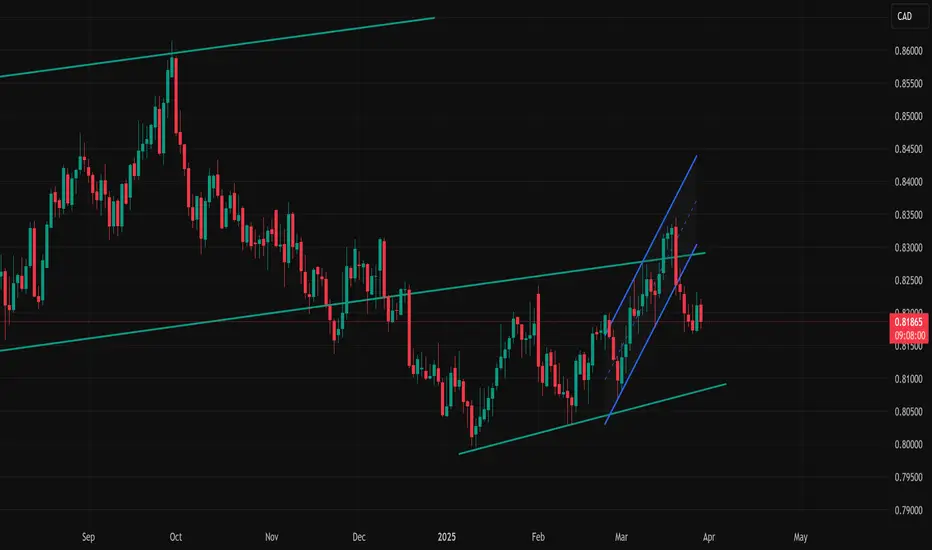
short setup on nzdcadNZDCAD Has just drop to a bearish movement on a weekly timeframe; there is currently a continuous bearish movement on a daily TF
Bitcoin - Please Just Listen To The Charts!Bitcoin ( CRYPTO:BTCUSD ) remains in a bullish market:
Click chart above to see the detailed analysis👆🏻
Despite literally everybody freaking out about cryptos lately, big brother Bitcoin is still creating bullish market structure. During every past cycle we witnessed a correction of at least -20% before we then saw a parabolic rally. So far, Bitcoin is just doing its normal "volatility thing".
Levels to watch: 70.000, $300.000
Keep your long term vision,
Philip (BasicTrading)

S&P500 - Donald Trump Is Crashing Markets!S&P500 ( TVC:SPX ) is starting a correction:
Click chart above to see the detailed analysis👆🏻
Since Donald Trump was elected the markets have been super volatile and clearly not too easy to trade. But now it seems like bears are slowly taking over the entire U.S. stock market after we just saw a drop of -10% within a couple of days and a correction becomes more and more likely.
Levels to watch: $6.100, $4.800
Keep your long term vision,
Philip (BasicTrading)

BTCUSD 2H | Breakout Flow + BOS Confirmation – CelestiaPipsBTC is slowly developing a breakout structure on the 2H timeframe .
Multiple bullish BOS points and a solid NY session demand base formed.
Price is currently retesting the breakout zone after sweeping short-term liquidity.
If price holds this zone, we could see continuation toward 88,900.
I’ve mapped out the entire flow – BOS, entry zone, and final target.
Watch how price reacts from this level.
— Shared by CelestiaPip

USOIL To Retest $70.5I'm watching TVC:USOIL for a strong push towards at least the $70.5 level, though this area presents significant resistance.
A confirmed break of the bearish trend could fuel strong buying momentum, but patience is key.
Ideally, I’d like to see a solid rejection off the $68.5 level as confirmation before a move higher.
If we get a decisive breakout above $70.5 with sustained bullish momentum, my next target would be the major resistance around $75.
