GOLD → Gold not ready to fall? What's going on?FX:XAUUSD is forming a local bottom and is not ready to continue falling. The price is breaking through the downward resistance amid a weakening dollar and a complicated fundamental backdrop.
At the beginning of the week, the price of gold stabilized above $3,250 as investors returned to defensive assets due to ongoing uncertainty surrounding US trade agreements with China and Japan, as well as growing geopolitical tensions in the Middle East and Ukraine.
The weakness of the dollar ahead of the Fed meeting and declining expectations of a rate cut are also supporting demand for gold. The focus remains on US trade news and the possible hawkish tone of the Fed this week.
Technically, the price is testing the bottom of the range as resistance. If there is no reaction to the false breakout and the price continues to storm 3268, then a breakout and consolidation above the level will allow it to strengthen to 3292-3314.
Resistance levels: 3269, 3294, 3314
Support levels: 3243, 3222, 3204
The price is forming a second retest of 3269 since the session opened. Buyers are testing resistance for a breakout. If the bulls break 3269 and consolidate above 3270, the chances for growth will be good. I do not rule out the possibility of a retest of the liquidity zone at 3243 before growth.
Best regards, R. Linda!
Trend Line Break

ETH - LIQUIDATION OF A FRIENDif you like the idea, please "Like" it. This is the best "Thanks!" for the author 😊 P.S. Always do your own analysis before a trade. Put a stop loss. Fix profits in installments. Withdraw profits in fiat and please yourself and your friends.

BITCOIN → Correction to the risk zone. Rise or fall?BINANCE:BTCUSDT has updated its local maximum to 97,900, the market structure is quite positive, but still depends on the fundamental background and the behavior of the S&P 500.
The fundamental reasons that influenced the growth are the improvement in the tariff situation in the US and relations with China. Bitcoin's growth strengthened as the SP500 index rose, with which it has a fairly high correlation. In the second half of this week, the price broke out of the two-week consolidation, breaking through the resistance level of 95,500 and updating the local maximum. A correction is forming within the local upward channel.
95,000 is the liquidity and risk zone. That is, if the bulls hold their defense above 95K during the retest, Bitcoin will continue to grow in the short and medium term. Otherwise, a break of 95K could trigger a drop to 92K-88K.
Resistance levels: 97,425, 99,475
Support levels: 95,500, 92,000
All eyes are on the 95.5K support level, below which a huge liquidity pool has formed. Growth may be influenced by a retest (false breakout of support) and an imbalance of forces in the market. But we need to be careful, as the market will react to economic data. BUT! A return of prices to the selling zone (below 95000 - 95500) and the inability to continue growth could trigger a correction and liquidation.
Best regards, R. Linda!

EURUSD update and new bearish view
FX:EURUSD one more view on EU, we can see long zone and break of same how currently looks, two bounce on sup zone 1.13500, price now pushing till crucial zone 1.12700, if we see break here we will have confirm.
Currently how everything looks, its expected to see stronger fall here.
SUP zone: 1.14000
RES zone: 1.11700, 1.11200

GOLD → Correction before NFP. What are the chances of a decline?FX:XAUUSD strengthens amid dollar correction. The market is correcting ahead of NonFarm Payrolls, trying to accumulate potential before high volatility.
Gold recovers ahead of US employment report
On Friday, gold rebounded from a two-week low, recouping some of its losses ahead of the release of US labor market data (NFP), which could set the tone for prices going forward. Amid optimism over trade talks and a strong dollar, gold ended its worst week in two months, but geopolitical tensions and a potentially weak jobs report could boost demand for safe-haven assets again.
The correction in the dollar gives gold a small chance to strengthen. However, fundamentally, the overall trend has already set the tone and gold may continue to fall.
Resistance levels: 3268, 3285, 3295
Support levels: 3227, 3204
The correction may reach a local zone of interest (money pool) — liquidity above 3270, or the 0.7 Fibonacci zone, after which the price may continue its course along the new trend — down to 3193.
However, unpredictable and unexpected data could disrupt the structure and push the price up to 3320-3350.
Best regards, R. Linda!

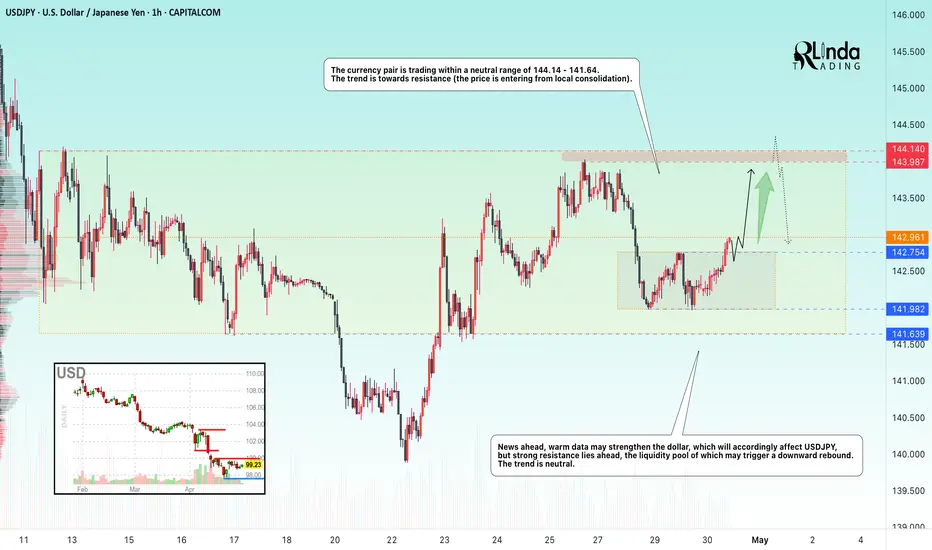
USDJPY → Price in range, retest of resistanceFX:USDJPY is emerging from local consolidation in hopes of seeing economic data that could support the dollar. The target for this movement could be the liquidity zone at 144.00.
The currency pair is trading within a neutral range of 144.14 - 141.64. However, a local consolidation has formed within the range, from which the price has broken out. The main task for the bulls is to hold the defense above 142.75, in which case we will be able to catch the price distribution to the upper border of the global range of 144.14.
News ahead, positive data may strengthen the dollar, which will accordingly affect USDJPY, but there is strong resistance at 144.14, whose liquidity pool may trigger a downward rebound. The trend is neutral.
Resistance levels: 143.9, 144.14
Support levels: 142.75, 141.98
There are no reasons to exit the global range. Over the past two weeks, this will be the first retest of the 144.14 zone, which in general only increases the chances of a false breakout and correction.
Best regards, R. Linda!
USDCADRange Breakout: The pair has been trading within a range, and the breakout from this range signals potential bullish momentum. A breakout indicates that the price is ready to move out of its consolidation phase, with buyers now in control.
Trendline Breakout: The price breaking above a key trendline further confirms a shift from a bearish or neutral market sentiment to a more bullish one. This is a strong signal that upward momentum is building.

GOLD → Consolidation. Traders are waiting for news...FX:XAUUSD remains in consolidation at 3370-3270. Traders are in no hurry to take any action, as there is a lot of important news ahead. Let's take a closer look at the situation...
On Wednesday, gold is trading lower, remaining in a sideways range as traders await the release of US GDP data for the first quarter. A sharp slowdown in growth is expected, and a possible contraction in the economy could increase bets on a Fed rate cut and support gold. Meanwhile, the dollar is holding steady amid tariff news and expectations for key employment and inflation data.
A retest of the range support is forming. The approach is quite sharp, and the pre-breakout potential has been exhausted. A false breakout of support could trigger an upward correction.
Support levels: 3270, 3245
Resistance levels: 3314, 3329, 3352
If the dollar continues to fall after the news, this could support gold and the price could continue to trade between 3370 and 3270. Unpredictable news could trigger a breakout and a fall.
Best regards, R. Linda!

USDJPY 4h Long Setup | Low Risk High Reward Market broke the descending structure with strong bullish impulse followed by higher lows respecting new trendline
Price retested the previous resistance now turned support zone with a bullish reaction
Entry is taken after confirmation of the retest holding and bullish continuation signs
Entry : 142.494
SL : 140.676
TP : 148.270
RR 1 : 3.2
Price action aligned with short-term bullish reversal structure and clear demand zone defense
Let price do the work

EURGBP Short SetupEURGBP Short Setup
4H Chart Trendline Breakdown and Retest
Entry : 0.84944
Stop Loss : 0.86678
Take Profit : 0.83310
RR 1 to 1.9
Market broke below the ascending support and retested the underside of a broken trendline confluence. Bearish pressure is building as price fails to reclaim 0.85396 zone. Clean structure for continuation to the downside.
Price is now respecting lower highs with momentum shifting beneath structure. This setup targets the previous demand zone near 0.833 region where price consolidated before the last impulse up.
As long as price holds below 0.854 zone, bearish bias remains valid.

Gold - Just Half Way To The Target!Gold ( TVC:GOLD ) still has a lot more upside potential:
Click chart above to see the detailed analysis👆🏻
Over the past couple of months, we saw an almost incredible breakout rally of about +75% on Gold. However, looking at technicals, there is a quite high chance that Gold will actually rally even more and retest the next upper resistance trendline, which would mean another pump of about +75%.
Levels to watch: $4.000
Keep your long term vision,
Philip (BasicTrading)

NZDCHF → The global bearish trend may continueFX:NZDCHF has been within a local upward wedge pattern for a long time. A breakout of support could trigger a continuation of the downtrend.
After breaking through the wedge support, the currency pair is one step away from the start of the realization. The focus is on consolidation at 0.4982 - 0.4919. A breakout of support could trigger a decline in the currency pair amid a weakening NZD and a rising dollar index, which overall creates a negative backdrop for the pair.
A retest of the previously broken boundary of the figure or resistance at 0.4953 is possible before the decline continues, but a consolidation of the price below 0.4918 will be a good signal for the start of the movement.
Resistance levels: 0.4953, 0.4981
Support levels: 0.4918, 0.4872
Trend pressure plays an important role, as does the fact that the price is coming out of a wedge consolidation. The breakout is directed towards the main trend, and price consolidation below the key support will only confirm this.
Best regards, R. Linda!

LINKUSDT → Consolidation. One step away from a rally?BINANCE:LINKUSDT entered a consolidation phase after breaking out of a downward channel. This is a fairly positive sign that buyers are building up momentum ahead of a possible breakout of resistance.
Exit from the downward price channel, distribution, and transition of the market to a consolidation phase: 15.275 - 14.400. Bitcoin is forming positive dynamics, which supports altcoins. The local alt season may continue if Bitcoin continues to grow after breaking through 95K. If LINK breaks through the resistance level of 15.275, this move could trigger further growth
Resistance levels: 15.275, 15.942
Support levels: 14.400, 14.266
At the moment, the mood of altcoins depends on Bitcoin, as it is receiving support amid positive fundamental data in the US and the global economy. However, for LINK, the focus is on the current consolidation. If the resistance level is not broken on the first attempt, it may happen during the next retest. Before that, the price may test the consolidation support with a false breakdown, which could create an imbalance in favor of buyers, only increasing the chances of growth and a breakout of resistance, provided, of course, that the overall bullish trend continues.
Best regards, R. Linda!

GOLD → The chances of a further decline are growing...FX:XAUUSD continues to test support at 3270 for a breakout. Any de-escalation of the conflict between the US and China could trigger a price drop. But it's not that simple...
Gold under pressure amid tariff war and ahead of US data
On Monday, gold is testing last week's low of $3260, remaining under pressure from a strengthening dollar and easing trade risks between the US and China.
Investors are preparing for the release of key US GDP and labor market data, which could influence expectations for Fed rates. Against this backdrop, the correction in gold could be replaced by growth if macro statistics turn out to be weak and geopolitical risks remain.
Another retest of support could trigger a breakout. It is necessary to monitor the situation between China and the US. Any de-escalation will trigger a decline.
Resistance levels: 3299, 3326
Support levels: 3268.9, 3245, 3232
Since the opening of the session, the potential for a further decline has been exhausted. Gold may strengthen to the indicated resistance zones. A false breakout of 3300/3326 could trigger a decline, which could bring the price closer to the support breakout of 3270.
With respect, R. Linda!

Ethereum Potential UpsidesHey Traders, in today's trading session we are monitoring ETHUSDT for a buying opportunity around 1780 zone, Ethereum is trading in an uptrend and currently is in a correction phase in which it is approaching the trend at 1780 support and resistance area.
Trade safe, Joe.

BITCOIN → Consolidation or reversal? Why is $ 95000 important?BINANCE:BTCUSD held up quite strongly during the tariff war and largely weathered the storm, while the stock market and indices were in free fall. The improvement in the fundamental situation has once again heightened interest in the asset among traders and investors.
Earlier, I pointed out that against the backdrop of falling markets (due to Trump's policies and tariff wars), Bitcoin is holding up fairly well. It cannot be compared to gold, which maintains its status as a safe haven, but overall it has stayed out of the 73K risk zone.
Countries are continuing negotiations in the US, which generally points to an improvement in the trade situation, but all attention remains on relations between China and the US, and a resolution may be close.
Technically, on the daily/weekly timeframe, the price has broken through the trend resistance and the asset has moved from the sell zone to the buy zone, which in general only increases interest in the flagship. Bitcoin is stuck in the 95K-92K range. A false breakout of resistance provokes a correction, and now we need to monitor the price and see where the correction will stop. This will show us important support that could become the basis for consolidation.
Resistance levels: 95K, 100K, 102.5K
Support levels: 93.5, 92.9, 92, 91K
To break through 95K and continue growing, Bitcoin must form consolidation. There is none at the moment, and a correction and halt may indicate the approximate boundaries of consolidation. However, the focus is on 95 - 93.5 - 92K. If the price manages to stay within the local boundaries and continues to storm the 95K resistance, we will have a chance for a breakthrough and continued growth to 100K. Otherwise, Bitcoin may form a deeper correction, for example to 91-88K
Best regards, R. Linda!

XRP / RIPPLE | 30M | IMPORTANT LEVELSFriends,
I valued your requests and prepared the following Ripple analysis: If Ripple drops below the level of 2.1807 for 30 minutes, the target will be the 2.1424 level. This level holds a very significant support zone.
The most critical support level is located at 2.1085.
If Ripple does not fall below this support zone, my target level for Ripple will be 2.2495.
Please don't forget to like.
Thank you to everyone who supports with likes.

GOLD → A false breakdown of support will lead to growthFX:XAUUSD is trading within the range of 3370-3270. Since the opening of the session, the price has lost its potential for further decline. There is no news on Friday, so after retesting the liquidity and support zone of 3283-3270, the price is likely to return to growth.
Gold stabilizes near $3,350, but growth is held back by the dollar
On Friday, gold held its ground after recovering, but further growth is limited by the strengthening dollar and hopes for progress in the tariff war negotiations...
Optimism about corporate earnings in the US and easing recession fears are supporting demand for the dollar. However, ongoing uncertainty in US-China relations is keeping interest in gold alive.
Markets are waiting for new signals from the White House and the Fed, which will determine the further movement of gold prices towards the end of the week.
Focus on supporting the trading range. A false breakdown of 3283-3270 could change the balance of power, leading to a rebound or growth.
Resistance levels: 3314, 3342, 3370
Support levels: 3283, 3270, 3244
There is no news today, except for the unpredictable Trump and the general situation with the tariff war. Any speech or tweet could shake the market. However, after a neutral week, gold remained within the range, and the market is likely to keep the metal within the flat on Friday. Accordingly, I expect a rebound from support and growth to the intermediate resistance lines indicated above.
Best regards, R. Linda!

Crypto XRPUSD Bear Bull Zone! What is Ripple Xrp next Big move? 🌎 Crypto XRPUSD Bear Bull Zone! What is Ripple Xrp next Big move?
🟢SeekingPips🟢 Says...
"when levels are as clean as this we can always use one of our intermediate TIMEFRAMES".
In todays case that task falls onto the 📉 120 MINUTE CHART📈
The GREY ZONE is our BIAS going forward for at least the next 48 HOURS.
Therefore 🟢 SeekingPips 🟢 is strictly BULLISH ABOVE & BEARISH BELOW the GREY ZONE.
🚥 SIMPLICITY is a KEY ingredient to having LONGEVITY in the FINANCIAL MARKETS 🚥

NKNUSDT - Buy it now!After a long downtrend of approximately 90%, the bearish trendline has been broken — this is a strong signal that the current price is a great entry point for buying.
my target is previous top at 0.14$

Should I hold my short at $3,305.69, or exit now What do you think, fam? Should I hold my short at $3,305.69, or exit now with gold so close to my stop-loss at $3,306.57? Drop your thoughts below—I’m curious to hear how you’d play this XAU/USD setup! If you’re one of the two ready to join me at Academia for Forex Trading, let’s talk—we’ll hunt these markets together. And while you’re at it, check out Icon Collections Store—does RiverSide, Desire, or Icoca vibe with your trading energy? Let me know!

EURUSD → Accumulation of liquidity before continued growthFX:EURUSD currency pair is forming a trading range within a global and local uptrend. Before continuing its growth, the market may form a false breakout.
Against the backdrop of the falling dollar, the euro is strengthening and has gained 13% over the past four months, which is a fairly significant growth indicator for the currency pair. Fundamentally, the US is trying to achieve a rapid reduction in interest rates, which may continue to support the euro...
Technically, the price is consolidating against the backdrop of a global and local uptrend. A correction is forming towards the support zone, where there is a fairly large pool of liquidity...
Resistance levels: 1.1392, 1.1439, 1.1481
Support levels: 1.130, 1.127
The price is heading towards support, namely, the market is interested in liquidity below 1.13 - 1.127, which must be tested in order to build up potential before the bullish trend possibly continues.
Best regards, R. Linda!

GOLD → False breakdown and change of mood...FX:XAUUSD is strengthening after a false breakdown of support at 3288, with the change in fundamental sentiment due to US statements on the tariff war also providing support for the price.
On Thursday, gold rose from a weekly low of $3,260, supported by a weaker dollar and renewed concerns about US trade negotiations with China and Japan.
Optimism about tariff cuts quickly faded after denials from the White House. Weak US business activity data is fueling talk of a possible Fed policy easing, which is also supporting gold. The markets remain focused on trade news and Trump's statements.
Technically, gold could reach the liquidity cluster at 3314 and continue to rise towards strong resistance at 3370.
Resistance levels: 3342, 3370, 3387
Support levels: 3314, 3288, 3270
Below 3314 and below 3288, a liquidity pool has formed, which the market is likely to test before continuing its growth. It is too early to talk about a resumption of a strong rally, as the situation between the US and China is complicated, as are the negotiations on the situation in Eastern Europe, which seem to be moving towards talks, but every time something goes wrong...
Best regards, R. Linda!
