BITCOIN → Testing trend resistance. Will there be a breakout?BINANCE:BTCUSDT is approaching trend resistance and most likely it may test the liquidity zone and risk zone for sellers (liquidity hunt ?), but does the market have the potential to support the upside?
Bitcoin is strengthening and channel resistance may not stop this growth. Based on the nature of price movement (smooth, gradual, consolidating), bitcoin may test liquidity 84.7K - 88.8K. But it is too early to talk about further growth
On W1, the price is in a trading range (consolidation) between the previously broken global consolidation support and the current support. Short bodies, long shadows speak about consolidation. Also worth noting are the relatively long tails to the downside and the weak market reaction...
Fundamentally, the cryptocurrency market (community as a whole) for the past week did not get anything positive as from the very beginning of this year, the growth can be attributed to the 90-day technical break by Trump, but there are a number of nuances:
- the fire has not yet been put out
- just because they gave a 90-day break doesn't mean everything is fine. It's just a head start for the U.S. to prepare for the situation more thoroughly
- The escalating conflict between the U.S. and China has investors looking for less risky assets like gold. Cryptocurrencies are definitely not on that list.
- Rumors of a US interest rate cut are likely to provide support as well.
Resistance levels: 84700, 88800
Support levels: 78200, 73-74К, 66500
I would not hurry with conclusions about further growth. Growth could be considered if bitcoin overcomes 88800 and consolidates above this zone. But a sharp approach or a false breakout of one of the mentioned liquidity zones may provoke a reversal and fall.
Regards R. Linda!
Trend Line Break

GOLD → Global economic risk indicator consolidates ahead of CPIFX:XAUUSD , rather quickly changes the market structure to bullish and continues its aggressive rally. The economic risk indicator is working perfectly. Technically, the focus is on the range 3135 - 3099
Gold is consolidating around $3,100 in anticipation of US inflation data. The escalating trade war between the US and China keeps demand for defensive assets alive despite the pause in price gains. Trump imposed 125% tariffs on Chinese goods and China retaliated with duties of 84% on U.S. imports. Increased tariff tensions are raising recession expectations and encouraging bets on a Fed interest rate cut, which supports gold. However, a rise in March CPI inflation (expected 2.6% y/y) could trigger a downward correction, although the impact could be short-lived - tariff news remains the main driver
Technically, the price failed to reach the 3135 liquidity zone and reversed, which attracted the crowd willing to sell (deceptive maneuver). But, after correction the price may return to the target quite quickly
Resistance levels: 3135, 3167
Support levels: 3100, 3090, 3077
Emphasis on the range boundaries, possible retest of 3100-3090- 3075 before continuation of growth. On the news or before the opening of the American session there may be a long squeeze before the continuation of growth.
Regards R. Linda!

Comprehensive Research - McDonald’s Stock Set to SoarQuick read:
McDonald's stock is poised for a bullish move, with Wave 3 likely starting and strong support near 290.50–295.00. Traders should long on dips within this range, for next resistance levels, 326.00 and 348.00 with a invalidation below 276.00. This setup offers a solid risk-to-reward in a long-term uptrend. Alternative safe entry is possible after the break of corrective channel breakout of wave (2).
Elliott Wave Forecast:
TF - Daily
The chart suggests that McDonald’s stock is in the middle of a larger upward move known as Wave C, which comes after completing a complex correction. Wave C is expected to unfold in five smaller waves, a pattern that usually points to a strong uptrend. It appears the correction is behind us, and a fresh bullish phase is underway.
Starting from the low at 276.53 , marked as Wave B, the price climbed to 326.32 , forming Wave one. After that, the stock pulled back to 290.50 , forming Wave two. This pullback followed a typical ABC pattern within a corrective channel, which often signals the end of a downturn and the beginning of an upward move.
Now, Wave three seems to be starting, and this is usually the strongest part of Wave C. The price is expected to move above 335 , take a small pause for Wave four, and then rise again to complete Wave five somewhere around 345 to 350 dollars. This positive outlook remains intact as long as the price stays above 290.50 . With the breakout from the corrective channel, the setup looks strong and clear for buyers.
Fibonacci levels:
Fibonacci Extension Targets:
1.000 extension: 326
1.618 extension: 348
Correction Retracement Levels:
Wave 2 retracement: 78.6%
A = C in A-B-C correction: 289.21
Price Action & shifting of value:
TF: Weekly
McDonald’s stock has been steadily climbing inside a rising channel since late 2020, showing a clear long term uptrend. The price has respected both the top and bottom edges of this channel very well, and interestingly, the middle line has acted like a pivot, providing support or resistance multiple times over the years.
Recently, the stock made a higher low at 276.53 and bounced back strongly, keeping the bullish structure intact. It then pulled back to 290.50 , right around the middle line of the channel, and held above an upward sloping trendline. This kind of price action shows strength and suggests buyers are stepping in.
The sharp move from 276.53 up to current levels looks like a strong bullish leg, possibly driven by accumulation. If the stock can break above its recent high of 326.32 , it could head toward the upper end of the channel. As long as the price stays above 290.50 and especially above 276.53 dollars, the bulls remain in control. Even if the price dips a bit, the long term trend stays positive unless the lower boundary of the channel breaks down.
I will update more Information here.

DOGE → Will the market hold strength or lose it all?BINANCE:DOGEUSDT is testing the liquidity and resistance zone amid a downtrend as part of a news-induced rally. Will the market hold this trend or return to a sell-off?
The downtrend continues. As part of the correction triggered by the news backdrop, bitcoin strengthened and pulled the altcoins with it. But the market may lose all its growth quite quickly, as bearish pressure on the market is still very strong (There are no fundamental positive changes for the market). The fall of BTC may be followed by DOGE as well.
Technically, the price is forming a false break of the resistance zone 0.1622 - 0.15700, consolidation of the price below this zone will provoke the continuation of the fall to the nearest zone of interest 0.13646.
Resistance levels: 0.157, -0.1622
Support levels: 0.13646, 0.1277, 0.1154
A retest of the trend resistance is possible, but price consolidation below the key zone will be a good signal indicating the seller's strength, the decline may continue. On the weekly timeframe we have a trigger at 0.14217, break of which will open the way to 0.1277 - 0.1025.
Regards R. Linda!

GOLD → Bounce back to accumulate energy before growthFX:XAUUSD confirms interim bottom at 2970 after a false breakdown and as part of the escalating trade war, price is strengthening from support to the important medium-term level of 3054.
Further dynamics will depend on the market reaction to the minutes of the March Fed meeting and the introduction of reciprocal tariffs between the US and China. The introduction of 104% duties on Chinese goods increases trade tensions, reduces investor confidence and supports the price of gold against the background of a weakening dollar. Even with the Fed's cautious rhetoric, gold may keep rising due to the escalating trade war.
The medium-term situation depends on the Fed (namely hints or actions on rate cuts), the trade war and negotiations on the situation in Eastern Europe
Resistance levels: 3054, 3077, 3099
Support levels: 3033, 3013 (0.5f), 2995
Since the opening of the session (the price has passed the daily norm) gold has exhausted the technical potential and the 3054 area may push the price down (false breakout). As part of a technical pullback, gold may test 3033 - 3013 before looking at upside attempts again.
Additional scenario: pullback to the fvg zone (0.7 - 0.79 fibo) before further growth.
Regards R. Linda!

USDCAD → Weak dollar provokes continuation of downtrendFX:USDCAD under the pressure of a weak dollar and downtrend may renew its lows. The fundamental background for the dollar is weak, the market reacts accordingly.
The dollar continues to fall - a reaction to the tariff war. Besides, additional pressure is created by the issue of interest rates reduction.
The currency pair is under the pressure of the downtrend. After a false resistance breakout, the price is consolidating in the selling zone. The trend change is confirmed by the cascade of resistances. Emphasis on the local range 1.4245 - 1.42018. The price exit from the consolidation will provoke the continuation of the fall
Resistance levels: 1.4245, trend boundary
Support levels: 1.4202, 1.415
Possible retest of resistance before further decline. But the price exit from the current range and consolidation of the price below 1.4202 - 1.4205 will provoke the growth of sales and further fall to 1.405 (zone of interest).
Regards R. Linda!

XAUUSD Outlook: Bull or Bear Move Ahead? Manage Risk📊 XAUUSD Market Insight 🌍
Gold is heating up once again, currently testing a tight range between 3080 and 3095. A breakout in either direction could set the tone for the next big move.
🔻 If price breaks below, we may see a slide toward 3060 and 3050—potential areas to watch for bearish momentum.
🔺 However, a strong push above 3095 could spark bullish energy, aiming for short-term targets at 3115 and 3127.
💡 Trade Smart
The market is full of opportunity, but don’t forget: risk management is key. Use proper position sizing, set clear stop-losses, and never overexpose your capital. Stay sharp, trade safe, and let the market come to you. 🧠💼

GOLD → Rising economic risks could push the price upwardFX:XAUUSD closed inside the range 2970 - 3060 and has all chances to strengthen as the situation between the USA and China is only getting hotter, which creates additional risks.
Gold continues to rally from its recent low of $2,957, back above the $3,000 level amid a weaker dollar and a pause in rising US bond yields. The market is reacting to escalating trade tensions between the US and China, including the threat of new 50% tariffs and possible countermeasures by Beijing. Strengthening expectations of Fed rate cuts and recovering risk appetite also support gold's growth, but the instability of global trade policy keeps investors uncertain.
At the moment the price is testing resistance at 3013 and after a small correction the assault may continue, and a break and consolidation above 3013 will open the way to 3033 - 3057.
Resistance levels: 3013, 3033, 3057
Support levels: 2996, 2981
The trade war and the complex, politician-dependent fundamental backdrop allows us to strategize relative to economic risk. Technically, we are pushing off the strong levels I have outlined for you. The overall situation hints that China will not just give up and Trump will not lose face. An escalation of the conflict could send gold higher.
The price may strengthen from 0.5 fibo, or from 3013
Regards R. Linda!

ADAUSDT → Correction to the liquidity zone before the fall ↓BINANCE:ADAUSDT is in a bear market, under pressure. An exit from consolidation and a pullback with the aim of retesting the resistance (liquidity zone) before further decline is formed
The fundamental background for cryptocurrencies is extremely negative. Bitcoin on yesterday's manipulation related to the 90-day tariff break, which was later denied by the White House began to form “helicopters” and high volatility. As the market calms down, the price returns to the selling zone, which creates pressure for Cardano as well.
Technically, a false breakdown of 0.5 fibo is formed and the price is consolidating near the local support at 0.5800. The breakdown and consolidation of the price below 0.58 will provoke the continuation of the fall. A retest of the previously broken consolidation support at 0.6300 is possible.
Resistance levels: 0.63, 0.6661
Support levels: 0.581, 0.5092, 0.4564
The market structure is exclusively bearish. A False breakout of resistance or breakdown of 0.581 will provoke a further fall, but the level of 0.5092, if broken, will finally drive the coin into the zone of emptiness, which may lead the price to fall to 0.45- 0.42.
Regards R. Linda!

XAUUSD Update: Bullish or Bearish? Key Levels to Watch! 🚨 Attention Traders! 🚨
XAUUSD is making waves and breaking through key levels! 🔥 The price is currently battling between 2980 and 2989 — will we see a breakout soon?
Bearish Alert: A dip below this range could lead us to targets like 2860 and 2850. ⚠️
Bullish Opportunity: A move above 2989 could trigger buying opportunities, with targets around 3004 and 3027. 🚀
💬 Let’s Talk Strategy! What’s your take on this? Share your insights as we ride this golden wave together and unlock new opportunities! 💰

BANKNIFTYNSE:BANKNIFTY
CURRENTLY DOESNT LOOK GOOD TO INVEST,
LONG TERM TRENDLINE BROKEN.
ONE SHOULD WAIT FOR FURTHER SUPPORT ON WEEKLY BASIS.
LOOKS TOUGH SHORT TERM AND MID TERM !!!!!!!
Note :
1. One should go long with a Stop Loss, below the Trendline or the Previous Swing Low.
2. Risk :Reward ratio should be minimum 1:2.
3. Plan your trade as per the Money Mangement and Risk Appetite.
Disclamier : You are responsible for your profits and loss.
The idea shared here is purely for Educational purpose.
Follow back, for more ideas and their notifications on your email.
Support and Like incase the idea works for you.

GOLD → Consolidation or continuation of the fall. 3013 triggerFX:XAUUSD is going through the strongest liquidation phase. The fall is triggered by profit-taking amid last week's strong news. Additional pressure is created by the strong NFP report released on Friday. The economic risk situation is bifurcating....
Gold prices rebounded after falling in the Asian session, consolidating the drop triggered by the intensifying trade war between the US and China. Donald Trump's comments about rejecting deals with China have heightened recession fears, raising the likelihood of a Fed rate cut.
Against this backdrop, there was increased interest in gold as a protective asset, despite the rise in the dollar and bond yields. However, further strengthening of gold is questionable due to profit taking and lack of new economic data from the US.
Technically, the price is consolidating under pressure against the support at 3017-3013. A descending triangle is forming on the local timeframe.
Resistance levels: 3033, 3057
Support levels: 3017, 3013, 2981
Based on the current situation and strong pressure on the market, we can expect two situations to develop:
1) breakdown of support 3017 - 3013, if the structure of the descending triangle on the local timeframe will be preserved. The target will be the support of 3000, 2981.
2) Or, the price will close inside the range with the target of consolidation between 3057 - 3033 - 3013 (consolidation of forces after a strong fall and liquidation)
Regards RLinda!

XRPUSDT → The bulls won't hold support. Falling to 1.9BINANCE:XRPUSDT is under pressure despite quite positive news. The coin, being in a downtrend, continues to test the key support. The chance of a breakdown is growing
XRP continues to test a strong support zone on the weekly timeframe, relative to this zone, in the medium term, two scenarios can develop, which depend on the general mood in the market. If the current backdrop persists, the chance of a downside breakdown and further decline is quite high.
At the moment, the focus is on the key support at 2.0637, relative to which the retests continue, and the reaction is getting weaker and weaker, which in general only increases the chances of a further fall to 1.9 - 1.63.
Resistance levels: 2.265, 2.365, 2.509
Support levels: 2.0637, 1.9
The cryptocurrency market is going through bad times (Tariff War, high inflation, stock market decline, disappointment of the crypto community due to expectations) and until the situation starts to change, the technical picture will remain negative. XRP may continue its fall after a small correction.
Regards R. Linda!

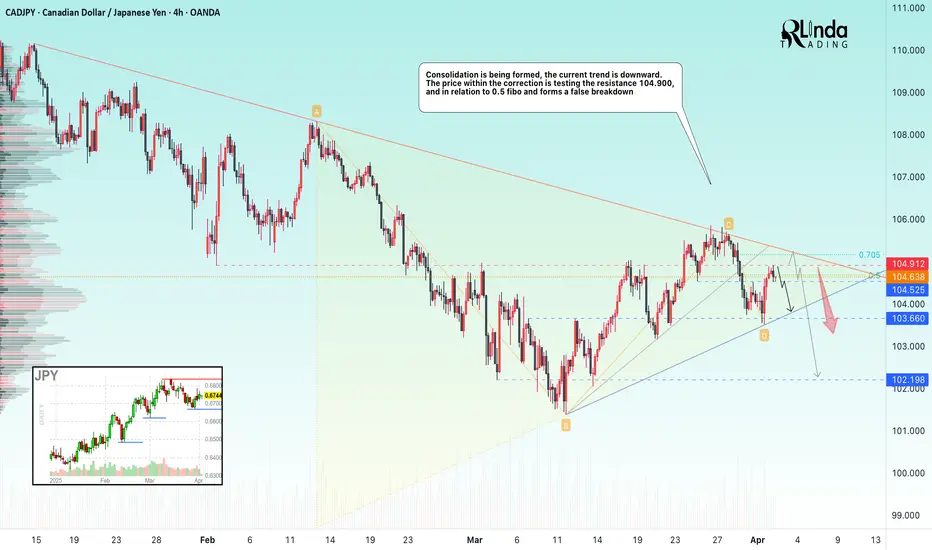
CADJPY → Consolidation before the news. DowntrendFX:CADJPY continues to forge a downtrend, but within the current movement a symmetrical triangle of accumulative nature is forming
The currency pair may continue its decline due to the strengthening of the Japanese Yen, while the Canadian is consolidating in a narrow range.
The situation may be accelerated by today's news, namely Trump's speech, where he may announce new tariff measures.
Technically, the price is correcting after the false break of 103.56, being below the previously broken upside support. Price is testing key resistance at 104.90, and against 0.5 Fibo is forming a false breakout. A consolidation below 104.69, a break of 104.525 could trigger further decline.
Resistance levels: 104.900, 105.36, 105.74
Support levels: 104.525, 103.56
There are important news ahead, high volatility is possible, especially at the moment of Trump's speech, which may set a medium-term tone in the market.
The currency pair is in consolidation on the background of the downtrend and the priority is to expect a continuation of the fall
Regards R. Linda!
EOSUSDT → False Breakeout of resistance (counter-trend )BINANCE:EOSUSDT.P within the consolidation distribution 0.54 - 0.6 reaches the key resistance and forms a false breakdown without the possibility of continued growth.
The cryptocurrency market is showing weakness, especially after yesterday's Trump speech and the approval of new Tariffs, which creates risks and pressure on the cryptocurrency market. Bitcoin is back in the red zone after rallying, while altcoins will continue to look for a new bottom. EOS stands out in this list, which strengthened quite strongly and the purpose of this maneuver was countertrend accumulation and liquidity capture relative to the range of 0.7 - 0.8. The distribution is tempered by a false breakout of the level 0.82 - 0.86
Resistance levels: 0.82, 0.86
Support levels: 0.793, 0.666
If the bears hold the resistance 0.82 - 0.86 and the consolidation under the level will end with the breakout of the trigger 0.793 and price consolidation in the selling zone, it may provoke a reversal and fall to the zones of interest: fvg, 0.64, 0.541.
Regards R. Linda!

AUDUSD bullish continuation still to expect
FX:AUDUSD we are have break of CHANNEL, break of long trend line, price is make revers, now its on strong sup zone and from here new bullish push expecting.
USD showing self weak still, continuation expecting, +we are not see some special moves here.
SUP zone: 0.62500
RES zone: 0.64400, 0.64900, 0.65400

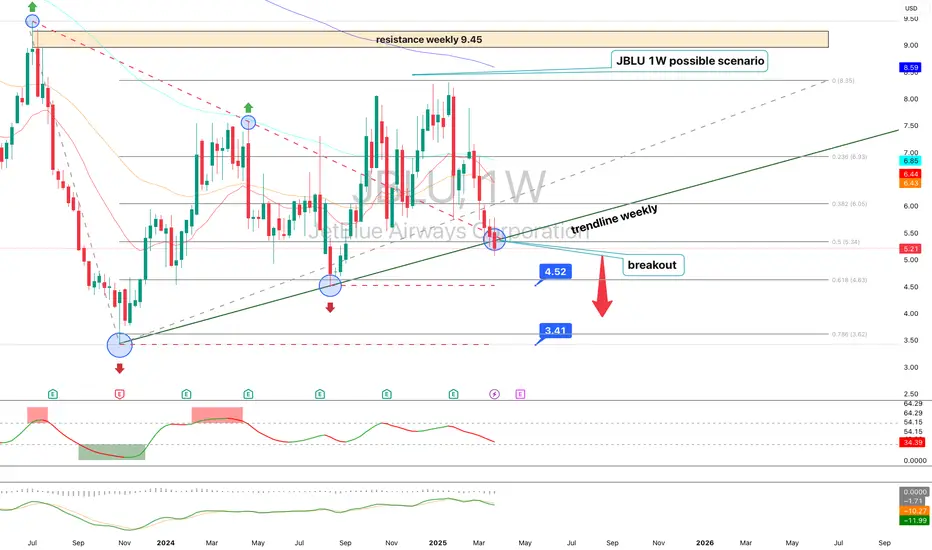
JetBlue Airways (JBLU) – Technical Analysis 1WJetBlue shares have broken a key weekly trendline, reinforcing a bearish outlook. After breaking support at $5.21, the price is heading toward $4.52 and potentially $3.41.
Technical indicators confirm the weakness: RSI shows declining momentum, MACD signals a bearish crossover, and EMA 50/200 indicate sustained selling pressure.
Fundamentally, the airline sector faces macroeconomic instability, rising Fed rates, and volatile fuel prices. A close below $5.21 will confirm the downtrend, targeting $4.52 and $3.41, while a recovery above $6.44 could signal a potential rebound.
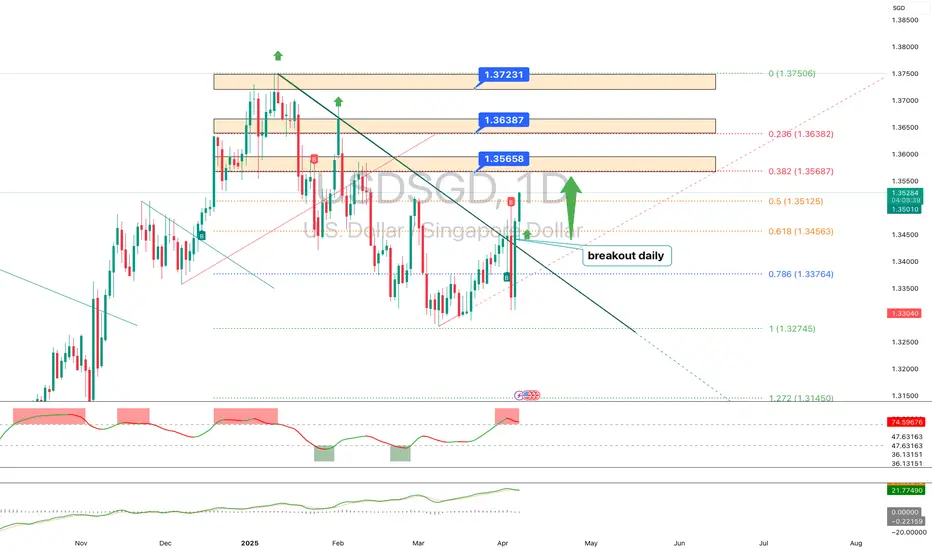
USDSGD – Technical Analysis (1D)USDSGD has broken out of a descending trendline on the daily timeframe – signaling a potential shift in short-term momentum. Price has held above 1.3510, confirming the breakout and opening the door to resistance zones at 1.3565–1.3638 (aligned with 0.382 and 0.236 Fibonacci levels).
If bulls stay in control, next targets lie at 1.3723 and 1.3750. However, a short pullback toward the 1.3450–1.3480 support zone (0.618 Fibo) is also possible.
🔹 Main scenario: continuation to 1.3565 → 1.3638 → 1.3723.
🔹 Alternative scenario: drop below 1.3450 toward 1.3376 or 1.3274.
GBPUSD → False break of weekly support + DXY fallFX:GBPUSD is going through a shakeout phase relative to the trading range. Last week was very challenging in terms of unpredictable moves and volatility.
A strong NFP report on Friday allowed the dollar to strengthen, but the reaction from the opening of the new trading week has already exhausted itself as traders are still watching the tariff war, which simply crashed the stock, futures markets.
Technically, the currency pair on this background can win out, as the pound sterling within the ascending trend, the fall of the dollar can continue the growth phase.
On the chart, the price forms a false breakdown of the support conglomerate, which in general may push the price up due to the imbalance of liquidity and interests of money moving away from the dollar
Resistance levels: 1.2932, 1.3010
Support levels: 1.2828, 1.2811
If the bulls will keep the price above 1.2868 and will be able to consolidate above 1.2932, in the short term the market can show growth up to the next target - resistance 1.3010.
Regards R. Linda!

US Small Companies Index ‘Russell 2000’ in Critical Trend!US Small Companies Index ‘Russell 2000’ in Critical Trend!
Let's take a look from a Fundamental and Technical perspective;
In 2020, the middle band (main trend line) of the logarithmic rising channel was broken and the upward movement had continued since then. Today, however, the same critical support level is being tested again.
If it cannot hold at this level, a long-term trend break may occur. This would significantly increase the risk perception in Russell 2000 companies.
What is Russell 2000?
It does not include large technology giants such as Nasdaq or S&P 500, but small and medium-sized companies that hold the real pulse of the US economy.
These companies are more fragile and more vulnerable to economic fluctuations.
The spread of anti-Trump protests shows that small businesses are starting to be affected both physically and economically.
The prospect of no interest rate cut by the Federal Reserve (FED) is crushing these companies under high borrowing costs.
The contraction in consumer spending can directly hit the profits of these companies because they are dependent on the domestic market.
Possible Scenarios for This Week:
🔴 If the protests deepen and the market panics:
If a break below $180 comes, the $170 support level is tested.
With panic sales, the $150 - $160 region, which is the lower band of the channel, may come to the agenda.
🟢If the environment calms down and economic data signals a recovery:
Strong purchases come from the middle trend line.
$200 - $210 band can be targeted.
In short, support is now being tested, if it breaks, the risk of serious decline is on the table.

GOLD → It all depends on NFP and Powell....FX:XAUUSD got shaken by 600 pips on both sides. Technically, after such a move the price may go into consolidation, but the near-term outlook will depend on NFP and Powell.
Gold hit a high of 3168 and went into correction. President Trump's imposed duties on imports from China (up to 54%) and other countries caused a sharp drop in the dollar and bond yields, reinforcing expectations of a Fed rate cut. Traders turned to profit-taking, which led to a correction. Now the market is waiting for the NFP report and Powell's speech. Weak data may return the upward momentum to gold, especially if the dovish rate expectations are confirmed. However, volatility may persist after the publication, given the impact of Friday's flows and Powell's speech
Resistance levels: 3107, 3116, 3135
Support levels: 3086, 3067, 3055
Technically, it is difficult to determine a clear place from where to expect a move as there is news ahead (NFP, Powell's speech). But based on the falling dollar and high economic risks, we can bet on the continuation of the price growth from one of the mentioned support levels: 3086, 3067, 3055.
Exit from the channel and consolidation of the price above 3110 - 3116 will again attract increased interest in buying
Regards R. Linda!

NFP REPORT IMPACT ON XAUUSD ALERT!🚨 XAUUSD Market Alert 🚨
🔥 Current Action: XAUUSD is currently range-bound between 3101 and 3114—will it break out soon? The market’s at a critical point, and a sharp move could be on the horizon!
📉 Bearish Scenario: If price slips below this zone, keep an eye on potential support levels at 3070 and 3054. A downward shift could set up fresh opportunities for sellers.
📈 Bullish Scenario: On the flip side, a solid break above 3114 could trigger buying pressure, with targets at 3140 and 3170. A move like this could spark a new uptrend, especially with NFP data on the way, which could impact the gold market!
💬 Let’s Talk Strategy: What’s your take on the XAUUSD setup? Share your insights, and let’s navigate this golden opportunity together! 💰🚀

EURGBP → False break of liquidity zone (resistance)FX:EURGBP within the distribution (news background) tests resistance 0.84616 and liquidity zone, but without the possibility of continued growth the price forms a false breakout
The dollar index falls amid Trump's introduction of new tariffs, which generally provokes a rally in the whole market. But before NFP, the market shifts to profit-taking because of the growing risks. There are quite important news ahead, which may provoke high volatility.
Technically, after a strong move, the currency pair forms a false resistance breakout and consolidates in the selling zone. If the bears keep the price below 0.84616, in the short term we should wait for a correction to 0.5 fibo or to the fvg zone.
Resistance levels: 0.84600
Support levels: 0.8427, 0.8396
The situation is quite complicated due to unstable background, but technically we have a classic situation with a false breakout of strong resistance, and as we know, according to statistics, the strongest movements start after it (in relation to the trade of level breakout).
Regards R. Linda!
