GOLD → Correction. Liquidity is the target. News aheadFX:XAUUSD on the background of yesterday's news reaches the target of 3166 and enters the phase of deep correction on the background of profit-taking. The level of economic risks is still high
Despite the pullback, the gold price retains much of its recent record high, thanks to rising risks of a global trade war and a US recession.
Gold corrects from record $3,168 but remains strong amid trade and recession risks. The correction is due to the following nuances: Profit taking ahead of key US jobs data. Waiting for jobless claims and services PMI.
But, Trump's new tariffs, a weaker dollar and lower bond yields are driving gold buying.
Resistance levels: 3116, 3135
Support levels: 3107, 3097
Against the background of high economic risks, falling dollar index, gold still has chances to continue its growth. False breakdown of support may give such a chance.
Regards R. Linda!
Trend Line Break

GOLD → Consolidation. News. False breakdown. Growth?FX:XAUUSD and TVC:DXY in consolidation ahead of important news and Trump's speech. Economic risks are rising and the future outlook depends on fundamental data...
Trade tensions support gold demand. Trump may impose global tariffs of up to 20% which will increase risks to the economy. Investors are piling into gold in anticipation, pushing its price to a record $3,150
A key factor is the details of the tariffs. If tariffs are softer than expected, gold could fall to intermediate support zones. If the trade war escalates, the rise could continue beyond 3150
Economic risks are rising and gold may test 3107 - 3100 support before rising further. Technically, 3100 - 3107 is a zone of interest and liquidity. If bulls hold the support, gold will continue to rise. Otherwise, gold may form a correction towards 3075 - 3065
Resistance levels: 3126, 3135, 3147
Support levels: 3107, 3100, 3091
The price is correcting to consolidation support in the moment. A strong and sharp fall is fraught with the risk of a liquidity grab and a false breakdown. In this case, gold may strengthen to one of the key resistances. But the further and medium-term development of events depends on the evening news....
Regards R. Linda!

Gold (XAU/USD) AnalysisGold (XAU/USD) Analysis
This chart provides a technical outlook on **Gold (XAU/USD)**, showing possible **bullish** and **bearish** scenarios based on price action and support/resistance levels.
Bullish Outlook
Key Support Holding**: Gold is staying above **$3,125-$3,130**, showing buyers are stepping in.
- **Uptrend Structure**: Price is following a rising trendline, meaning bullish momentum is intact.
- **Breakout Zone**: If Gold surpasses **$3,155-$3,160**, it could rally toward **$3,170-$3,180**, as no major resistance exists in that range.
What to Watch?
- A strong breakout with volume above **$3,155-$3,160** confirms upside potential.
- Look for support at moving averages (EMAs) to validate trend continuation.
Bearish Outlook
- **Resistance Rejection**: If Gold fails to break above **$3,155-$3,160**, it might face selling pressure.
- **Break Below $3,140**: If price drops under this level, it could target **$3,125-$3,110**, which is the next key support.
- **Further Downside**: A breakdown below **$3,110** could lead to a deeper decline towards **$3,090-$3,080**.
What to Watch?
- A drop below **$3,140** with strong volume could confirm further downside.
- If selling pressure increases, Gold may retest lower support zones.
Final Thought
Gold is currently in an **uptrend**, but traders must monitor key levels:
✔ **Bullish if** it breaks **$3,160** 📊
✔ **Bearish if** it falls below **$3,140** 🔻
Stay cautious and wait for price confirmation before making a move! 🚀

GOLD → The rally is intensifying. Growth after false breakdownFX:XAUUSD is breaking upwards and is trying to consolidate above the previous high of 3127 as part of a correction. This would be an ideal support for the bulls. The rally, on the background of political and geopolitical problems only intensifies
Tariff escalation pushes up gold demand. Trump rejected the idea of lowering tariffs and the Treasury Secretary named a list of 15 countries that fall under the new measures. This has caused the dollar to weaken and fears of stagflation to rise, boosting demand for gold as a protective asset.
Central banks and investors continue to build positions in gold, but corrections are possible before the tariffs announcement on April 2 and the release of U.S. economic data
Technically, we have a strong bullish trend, it is risky to sell, we are looking for strong areas or levels to buy. For example, if the price consolidates above 3127, or after a false breakdown of 3119 / 3111
Resistance levels: 3147, 3155, 3166
Support levels: 3127, 3119, 3111
Before the continuation of the growth there may be a correction to the key support areas to normalize the imbalance in the market as well as to capture the liquidity. Consolidation above the level after a false breakdown will be a good signal for growth.
But! News ahead and high volatility is possible!
Regards R. Linda!

NZDUSD → Consolidation within the correctionFX:NZDUSD is forming a local correction on the background of the uptrend. The dollar has been consolidating and strengthening for the last week, which generally creates pressure on the forex market
NZDUSD after a false break of the trend resistance, which also coincided with the stopping of the strong decline of the dollar, entered the correction phase. Locally, it is a downtrend, followed by consolidation, which in general forms a flag - a figure of continuation of the movement.
The chart reveals strong levels that can be paid attention to. The dollar may continue its growth due to the US policy, which generally has a negative impact on the market.
The price exit from the current consolidation may be accompanied by a strong impulse. Emphasis on 0.575 - 0.571.
Resistance levels: 0.57426, 0.57674
Support levels: 0.571, 0.5684
After stopping at 0.571, the price is not pulling back, but forming consolidation on the background of the local downtrend. Most likely a big player lures the crowd to get to the imbalance zone or trend support at their expense.
Regards R. Linda!

Nifty - Awaiting the Fifth Wave for a BreakoutNifty recently hit a low of 21,905 , marking a key reversal point in the trend. A well-defined Head and Shoulders pattern is emerging, with the right shoulder currently forming. The ongoing pullback has retraced to the 38.2% level, but there is potential for it to extend towards the 50% mark at 22,906 . However, the upward move appears to be losing momentum, with buying interest remaining subdued.
Based on the chart, the head of the pattern signifies the beginning of a new impulse wave. This appears to be the fourth wave within the larger first wave. Once Nifty completes this corrective phase, the fifth wave is expected to present a trading opportunity. If wave equality holds, Nifty could potentially rise to 24,857 .

GBPJPY | 15M | SCALPING TIME | LIMIT ORDER Hey There;
SIGNAL ALERT
BUY LIMIT GBPJPY / 192,900 , 193,740
🟢TP1: 193,200
🟢TP2: 193,550
🟢TP3: 194,400
🔴SL: 192,257
RISK REWARD - 2,41
Please don't forget to like 🙏🏻💙

GOLD → Growing economic risks increase interest ↑FX:XAUUSD rallied aggressively due to high interest driven by rapidly rising economic risks, mainly related to Trump's tariffs. For selling, the risk is very high, with the stock and cryptocurrency market declines only adding to the interest in the metal
Markets are taking refuge in defensive assets amid WSJ reports of Trump's possible tariff hike of up to 20% for most US trading partners. This could trigger inflationary pressures and stagflation, weakening the dollar and bond yields, which supports the gold price.
This week all eyes are on Trump's speech on Wednesday, PMI, NonFarm Payrolls and Powell's speech
Technically, it is not worth selling now as it is high risk, and for buying we should wait for a correction to key support levels
Resistance levels: 3127
Support levels: 3103, 3091, 3085
We are not talking about any trend reversal now. It is worth waiting for a local correction or consolidation, the market will mark important levels, liquidity zones or imbalances against which you can build a trading strategy. Gold will continue to grow because of the strongly increasing risks.
Regards R. Linda!

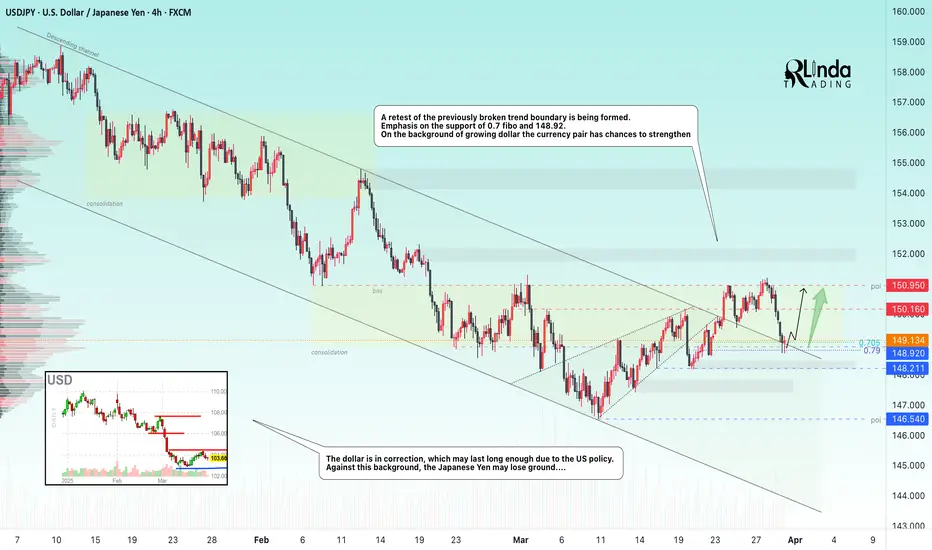
USDJPY → Key Level Retest. Attempt to change the trend FX:USDJPY in the correction phase is retesting the previously broken boundary of the downtrend. The market is trying to break the trend on the background of the dollar correction
The dollar is having a rather difficult life because of economic and geopolitical nuances regarding the USA, as well as high inflation. Against this background, the index may continue a deeper correction, as the rhetoric of interest rate cuts may be prolonged, which may put pressure on the markets.
The currency pair tried to overcome the downtrend resistance earlier and succeeded, but this is not enough for a trend change, it needs confirmation.
Support levels: 148.92, 148.21
Resistance levels: 150.16, 150.95
If the bulls hold the defense above 148.92 - 149.5, we have a good chance to catch a trend change. It will be the readiness to go to the resistance of 150.16 range, and the breakout of this level and price fixation above it will be the confirmation of the trend change
Regards R. Linda!
GOLD → Correction after a false breakout. A reversal?FX:XAUUSD is forming a false break of the channel resistance within the rally, we should wait for a correction, but not for a trend reversal. Let's see what we can expect from the price in the short and medium term.
Gold is reacting to market turmoil over Trump's tariff plans. Investors are looking for protection ahead of the possible imposition of new duties from April 2, boosting demand for the metal
Fears of a trade war and a slowing global economy are supporting gold despite positive US GDP data. PCE data and tariff updates will be key catalysts for further movement. Higher inflation could dampen the rally, while weak data will reinforce bets on a Fed rate cut, helping gold to rally further.
The energy to continue the move is gone, so I am waiting for a correction to the imbalance zone or to 0.7 Fibo to accumulate potential. The price may consolidate in the zone of 3050 - 3075 before it continues its growth
Resistance levels: 3075, 3085, 3095
Support levels: 3059, 3055
The correction after a strong rally can be quite deep. The imbalance zone 3066 - 3063 and liquidity zone 3057 play an important role. False breakdown of support may resume growth.
Regards R. Linda!

XAUUSD Breaking Records: Bull & Bear Setups for the New Month 🔥 Attention all traders!🔥
XAUUSD is on fire, breaking records with power! Here’s the latest update:
🔻 Bearish Outlook: Watch for a potential dip below the 3076-3078 range. If it falls, targets like 3050 and 3030 could be in play. Keep an eye on these support zones! 👀
🔺 Bullish Outlook: A breakout above this range could open up buying opportunities! Look for price action above 3084 with targets at 3097 and 3110. 🚀
New Month Open Candle: As we step into a new month, keep a close watch on the market open candle 📅. This could set the tone for the next move!
💡 Risk Management** is key! Always trade smart and protect your capital! 💰
Join the discussion and share your thoughts! Let's ride this golden wave together! 🌟

Possible trendline BreakoutStock is near support levels and trying to maintain price near support.
Not falling in weak markets which shows Possible strength.
Can be a candidate for trendline breakout lets wait & watch

BITCOIN → Break of the bullish structure. Moving to 78-68KBINANCE:BTCUSD has been slowly recovering for the last two weeks, but failed to overcome the resistance. The bears held the trend. The price is breaking the local bullish structure and preparing for a strong fall.
Bitcoin's fundamental background is weak, expectations were not met by the crypto summits, nor by any major announcements or hints of a crypto reserve. The crypto community still didn't get what they expected from Trump. The strong drop was triggered by the SP500 index falling, driven by rising inflation, reduced consumer pressure and new trade tariffs. These factors have contributed to increased uncertainty in the markets, prompting investors to move to safer assets such as gold and government bonds
Technically, the price has been in consolidation (correction channel) for two weeks and after breaking the support of the figure, the price entered the realization phase within the global downtrend.
Resistance levels: 85300, 86350, 89400
Support levels: 83600, 81270, 79980, 78100
Emphasis on the support at 83600. The price fixing under this zone may provoke further fall to 80-78K. But I do not exclude the fact that a small correction to the zone of interest is possible (to capture liquidity) before a further fall to the previously identified key zones of interest.
Regards R. Linda!

Bitcoin Squeeze Point – Breakout or Breakdown?Bitcoin is approaching a key inflection zone where the Daily Downtrend Resistance and the Monthly Uptrend Support intersect. This confluence could be setting the stage for a major breakout or breakdown, and the next move could define BTC’s medium-term trend.
🧠 Key Levels to Watch:
Daily Downtrend Resistance (Red) – Price is testing this descending trendline again.
Monthly Uptrend Support (Green) – Strong support held since August 2024.
Fibonacci 0.5 Level (~79.3K) – Acting as mid-zone control point.
Fibonacci 0.618 Golden Zone (~72K) – Strong historical retracement support.
🟦 Bullish Scenario (Blue Arrow):
If BTC breaks above the daily downtrend and holds above the green uptrend line:
Possible target: 110K, aligning with the 1.0 Fibonacci extension.
Would confirm continuation of the larger bullish trend.
🔻 Bearish Scenario (Not drawn but implied):
If BTC breaks down below 79K and the monthly trendline:
Eyes on 72K for a potential bounce at the 0.618 Fib level.
Below that, potential deeper retracement toward the 65K–60K zone.
⏳ Conclusion:
BTC is sitting at a high-confluence zone. This is not the time to chase—wait for confirmation of breakout or breakdown before reacting.

MEWUSDT → False breakout of resistance after distributionBINANCE:MEWUSDT.P in the distribution phase is testing a strong resistance and liquidity zone against which it makes a false breakout.
Regarding the current situation, we should pay attention to several key levels - support and upper resistance. A retest of 0.00300 - 0.00312 is possible, the target of which could be another liquidity zone, before MEW continues its fall according to the current local and global trend, which have a common direction on the background of weak bitcoin and weak cryptocurrency market.
Resistance levels: 0.002793, 0.003, 0.00312
Support levels: 0.002696
The key support area plays the role of 0.002696, which are trying to contain the market. Below this line is a free zone and there are no levels that can prevent the movement. Thus, the breakdown and consolidation of the price under 0.026969 can provoke a strong impulse towards the zones of interest 0.00222, 0.002
Regards R. Linda!

LAYERUSDT → Far retest of key resistance at 1.400BINANCE:LAYERUSDT.P is forming a realization within the uptrend. The coin is stronger than the market, but the initial reaction to the strong resistance at 1.400 may be in the form of a false breakout and a pullback to 1.275 or 0.5 fibo
Since the opening of the session, LAYERUSDT has passed the daily ATR, but after reaching the resistance, the coin may not have the potential to continue rising. Liquidity above the 1.400 level may hold this area and prevent the coin from breaking through this zone the first time around.
Bitcoin is testing trend resistance at this time and could likely form a rebound or a continuation of the decline, which could affect altcoins accordingly!
Resistance levels: 1.400
Support levels: 1.2932, 1.2747, 0.5 fibo
BUT ! Everything depends on the price reaction at 1.400. A sharp and distributive approach with 90% probability will end in a false breakout and correction to the mentioned targets.
But, if LAYER starts to slow down and consolidate in front of the level, an attempt of breakout and struggle above 1.400 is possible and further movement will depend on it.
Regards R. Linda!

OIL - Potential Reversal Zone at Key Fibonacci levelThe Crude Oil Futures (4H) chart highlights a potential bearish scenario as price action approaches a critical resistance area. The highlighted zone, which is a strong resistance, coincides with the 0.618 - 0.65 Fibonacci retracement levels, which are often key areas for price reversals. Additionally, the rising wedge formation signals a potential loss of bullish momentum, typically a bearish continuation or reversal pattern.
The price has made several attempts to push higher, but the presence of multiple confluences, including the resistance levels around $70.50, suggests that the bullish rally might be facing exhaustion. If a reversal occurs from this zone, it could lead to a significant drop, potentially targeting the $66.50 region or even lower, aligning with previous structural supports and liquidity zones.
Traders should monitor for bearish confirmations, such as a strong rejection candle, a break of the rising wedge structure, or increased selling volume.
Key levels to watch:
- Resistance Zone: $70.50 - $71.00 (Fib 0.618-0.65 and strong resistance)
- Support Targets: $68.00 and $66.50
This setup requires patience and confirmation before taking action. Always trade with proper risk management!

Bitcoin (BTC/USD) Trading Analysis – Rectangle Pattern Breakdown1. Market Overview
The BTC/USD chart (1-hour timeframe) illustrates a trendline-supported uptrend that eventually transitioned into a rectangle consolidation pattern before breaking downward. The market displayed signs of buyer exhaustion near the resistance level, leading to a rectangle pattern breakdown, confirming a bearish shift.
This analysis will break down the chart structure, key technical levels, potential trade setups, and risk management strategies for traders looking to capitalize on this move.
2. Breakdown of the Chart Structure
A. Trendline Breakout & Shift in Market Sentiment
The chart initially exhibits an ascending trendline, acting as dynamic support for Bitcoin’s price.
As long as BTC/USD remained above this trendline, the uptrend was intact.
However, once the price broke below the trendline with strong bearish momentum, it signaled a significant shift in sentiment from bullish to bearish.
The breakdown of the trendline also coincided with the rectangle’s lower boundary breakdown, confirming bearish strength.
B. Rectangle Pattern Formation (Consolidation Phase)
The price oscillated between resistance at $88,500 and support at $86,000, forming a rectangle consolidation pattern.
This pattern reflects a period of market indecision where buyers and sellers are in equilibrium.
Multiple failed breakout attempts at resistance signaled strong seller dominance, leading to eventual support failure.
The rectangle breakdown suggests that bears have gained control and a downward move is likely.
C. Breakdown Confirmation & Target Projection
The price broke below the lower support of the rectangle ($86,000) with increased selling pressure.
The bearish breakout was confirmed by strong red candles with high volume, reinforcing the downside move.
The height of the rectangle pattern provides a measured move target of around $83,797, aligning with previous support.
The momentum remains bearish, and price is likely to test this level before any reversal attempt.
3. Trade Setup & Risk Management
A. Ideal Trade Entry
Entry Point: After the price retested the broken rectangle support at $86,000, which now acts as resistance.
Confirmation: The rejection from this resistance with a bearish engulfing candle confirmed further downside.
Bearish momentum indicators, such as RSI and MACD crossovers, further validated the setup.
B. Stop-Loss Placement (Risk Management Strategy)
Stop Loss: Placed above the previous resistance zone at $88,969 to protect against false breakouts.
Rationale: If price moves back into the rectangle and surpasses resistance, the bearish setup becomes invalid.
C. Take-Profit Target & Risk-to-Reward Ratio
Target: $83,797, based on the rectangle pattern height projection and key support levels.
Risk-to-Reward Ratio: The setup offers a favorable risk-to-reward ratio, ensuring that potential gains outweigh potential losses.
4. Market Sentiment & Future Outlook
A. Bearish Continuation Outlook
The trendline failure, rectangle breakdown, and bearish candlestick patterns all suggest a continuation of the downtrend.
If price fails to reclaim support-turned-resistance ($86,000), further downside is expected.
Increased selling volume confirms bearish control.
B. Possible Bullish Reversal Scenarios
If BTC/USD bounces strongly from the $83,797 target zone, it could indicate buyer accumulation and lead to a bullish recovery.
A move back above $86,000 would invalidate the bearish outlook.
5. Conclusion
This BTC/USD analysis highlights a bearish rectangle pattern breakdown, reinforced by a trendline break and strong resistance rejections at $88,500. The breakout target is $83,797, where traders should monitor price action for further bearish continuation or potential reversal signs.
Traders should approach with caution, set appropriate stop-loss levels, and follow volume trends for confirmation of further price movements.

BTC/USDT - The moment of truthThe BTC/USDT chart highlights a crucial moment as the price breaks out of a bearish trendline and tests a Fair Value Gap (FVG) zone. Key scenarios include:
- A potential continuation of the bullish trend if the price successfully holds above the FVG zone and confirms support.
- Alternatively, a rejection at this level could signal a return to bearish momentum.
Keep an eye on price action within the FVG zone for confirmation of the next move. Which way do you see BTC heading?

EUR/NZD 4H AnalysisEUR/NZD 4H Analysis
The pair is breaking above trendline resistance, targeting 1.8939–1.9168.
Support: 1.8807
Resistance: 1.8939 | 1.9060 | 1.9168
A retest of 1.8884 may confirm bullish continuation.

GOLD → Consolidation forms a trigger. Rally?FX:XAUUSD continues to rise amid weakening dollar demand due to Trump's imposition of new tariffs. GDP and Initial Jobless Claims ahead
Gold is further supported by renewed concerns about a slowdown in the US economy due to trade duties. However, growth beyond ATH remains questionable due to geopolitical nuances.
The market focus shifts to macroeconomic data: the final US GDP for the fourth quarter and jobless claims will be released today. Also the attention will be drawn to the speeches of the Fed representatives, who earlier made it clear that they are in no hurry to cut rates due to inflation risks caused by Trump's tariff policy
Resistance levels: 3038, 3046, 3056
Support levels: 3033, 3025
The strong resistance is 3038. Breakdown and price consolidation above this level will provoke continuation of growth (there is a chance of ATH retest). But, since there is news ahead, gold may test the zone of interest and liquidity 3030-3025 before further growth.
Regards R. Linda!

AUD/JPY 1D possible scenario Technical Analysis 1D
The pair is testing a long-term downtrend resistance. A breakout could signal further upside.
Key Levels:
Support: 95.52
Resistance: 98.49 | 102.62 | 109.40
Fundamental Factors:
Australian Dollar Strength: Driven by commodity demand and potential RBA rate decisions.
Japanese Yen Weakness: BoJ’s ultra-loose policy keeps the yen under pressure.
Risk Sentiment: AUD/JPY correlates with market risk appetite; stronger equities could support upside.
A breakout above 95.52 may open the path toward 98.49.

BTC 4H setup : Potential Long Opportunity
Trade Setup: Long (Buy) Position
📍 Entry:
Look for an entry between 85,500 - 86,300 USDT once the 4H RSI shifts back upward.
Price is currently testing the 200 MA as support, a potential bounce zone.
The 1H RSI is upward but likely to dip slightly before aligning with the 4H timeframe for a buy signal.
The dotted resistance line should be watched for confirmation.
🛑 Stop Loss:
If price breaks and closes below 85,000 USDT, cancel the trade.
Suggested stop loss around 84,700 USDT to manage risk.
🎯 Take Profit Targets:
88,500 USDT (previous resistance)
89,800 USDT (recent high)
📌 Trade Considerations:
Wait for the 4H RSI to cross into the buy zone before executing the trade.
Use the 12-hour chart for confirmation before entering.
Lower timeframes (15M, 1H) can refine the entry for an optimal position.
📢 Disclaimer: This analysis is for informational purposes only and does not constitute financial advice. Trading involves risk, and past performance is not indicative of future results. Always conduct your own research before making any decisions.
