USDJPY → Resistance retest (wedge) before the Fed meetingFX:USDJPY is forming a correction to trend resistance as part of the dollar index consolidation. An interesting situation is forming which could be a continuation of the downtrend.
Fundamentally, today is an important day. The FED interest rate meeting is ahead. Traders are waiting, the dollar is consolidating at this time. Most likely the rate will remain unchanged, but in this key everyone is interested in Powell's comments on monetary policy and their future actions.
USDJPY at this time is forming a correction to the bearish trend resistance, before the news the currency pair may test the resistance conglomerate: a wedge, 0.79 fibo, or an orderblock located outside the channel
Resistance levels: 150.16, 150.95
Support levels: 148.92
False breakout of the resistance zone can provoke a fall, as well as breakdown of the support of the “wedge” with the subsequent consolidation of the price in the selling zone. The price may test the zone of interest at 147.6, 146.54.
Regards R. Linda!
Trend Line Break

TREND LINE BREAKOUT AND RETEST FOR BULLISH MOVE ALERT!Hey Trader
Congratulation all trader for new ATH 3038
THERE is OB in H1 and market is near to break trend line zone and goes for sell for hunting some liquidity from 3015 area.
Now trend is BUll so we just scalp in sell for long term GOLD bull move is going to the moon and month prediction is 3200.
TARGET AREA FOR BULL 3039 AND 3060.
follow risk management

ENA...Hello friends
Given that the price has reached the bottom of the range, which is also a good support area, we can enter the trade with risk and capital management.
*Trade safely with us*

EUR/USD Chart Pattern Analysis (1H Timeframe) – Bearish SetupThe EUR/USD 1-hour chart presents a compelling bearish setup, characterized by a rejection from a key resistance zone, a weakening support level, and a potential trendline breakdown. These technical elements suggest an increased probability of downward movement if bearish momentum persists.
Key Technical Components:
Resistance Rejection & Selling Pressure:
The price action tested a well-defined resistance zone, which aligns with previous swing highs.
A rejection from this level indicates that sellers have stepped in, preventing further upside movement.
This area serves as a supply zone, reinforcing a bearish outlook as long as price remains below it.
Support Level at Risk of Breakdown:
The market is currently testing a support zone, which has previously acted as a demand area.
A break below this support would confirm increased selling pressure, likely triggering a more significant decline.
The support level is structurally weak, as the price has already tested it multiple times, increasing the likelihood of a breakdown.
Ascending Trendline Violation:
The ascending trendline has been a key dynamic support for the recent uptrend.
If the price breaks below this trendline with strong volume, it would signify a potential trend reversal, shifting market sentiment from bullish to bearish.
A confirmed breakdown would further validate the bearish continuation scenario.
Sell Stop Placement & Profit Targets:
A Sell Stop order is positioned below the support zone to capture a breakdown trade.
The first Take Profit (TP1) is set at 1.08312, a level that has historically acted as support and resistance.
The second Take Profit (TP2) is placed at 1.07659, representing a more extended bearish move toward the next major demand zone.
Conclusion & Trading Strategy:
Bearish Scenario: If the price breaks below the support level and ascending trendline, it could trigger a sell-off, leading to a potential downside move toward TP1 and TP2.
Bullish Rebound Possibility: If the support level holds and buyers regain control, the price may attempt to retest the resistance zone. However, the bearish structure remains dominant unless the price breaks above resistance.
Final Outlook:
Traders should closely monitor price action at the support and trendline intersection. A confirmed breakdown below these levels, preferably with increased volume, would reinforce the bearish outlook. Proper risk management and stop-loss placement above the resistance zone are recommended to mitigate potential reversals.
Would you like me to refine it further for professional publication or trading forums? 🚀

Wed 19th Mar 2025 GBP/CHF Daily Forex Chart Sell SetupGood morning fellow traders. On my Daily Forex charts using the High Probability & Divergence trading methods from my books, I have identified a new trade setup this morning. As usual, you can read my notes on the chart for my thoughts on this setup. The trade being a GBP/CHF Sell. Enjoy the day all. Cheers. Jim

Nvidia - That's Officially The Brutal End!Nvidia ( NASDAQ:NVDA ) is breaking all structure:
Click chart above to see the detailed analysis👆🏻
Following previous cycles, Nvidia has been rallying for more than 2 years, creating an overall pump of approximately +1.000%. But now, everything is literally pointing to a significant towards the downside and with a potential drop of -30%, bears are totally taking over Nvidia now.
Levels to watch: $70
Keep your long term vision,
Philip (BasicTrading)

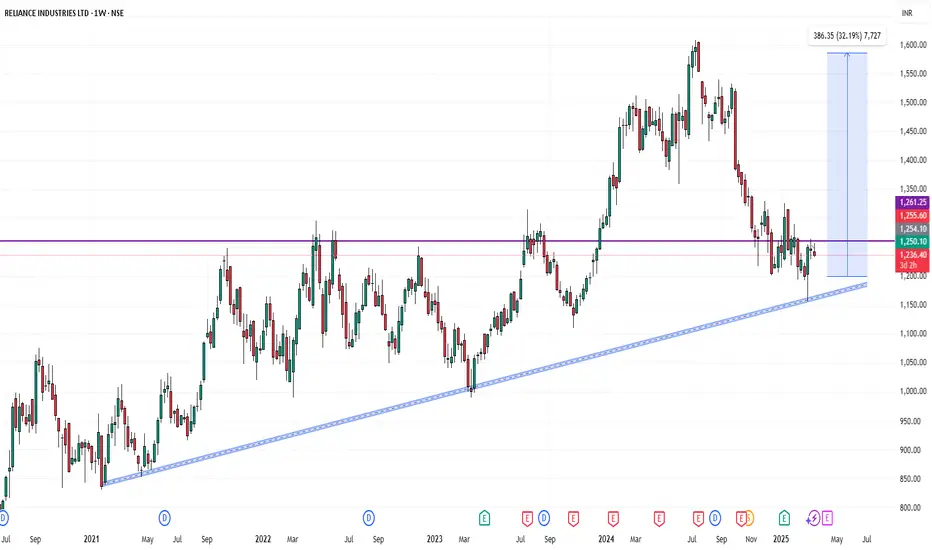
Reliance Industries📈 Reliance Industries Breakout Alert – ₹1241 Key Level Breached 🚀
Reliance Industries has successfully broken out above a strong resistance zone near ₹1241, indicating a potential bullish move ahead. This level acted as a critical supply zone in the past, and the breakout with volume confirmation adds strength to the trend.
🔍 Technical Highlights:
Breakout Level: ₹1241
Volume: Above average (confirming strength)
Trend: Bullish
Next Resistance Zones: ₹1265 / ₹1290
Support Zones: ₹1220 / ₹1200 (previous resistance now acting as support)
GOLD → Consolidation for continued growth. 3025?FX:XAUUSD is consolidating between 2981 - 2993. After strong growth there is no hint of a possible reversal, and consolidation above the channel boundary indicates readiness to continue growth
The gold price remains below the record $3,005 but is supported by the trade war, geopolitical tensions and expectations of Fed policy easing. The escalating US conflict with Yemen, the escalation in Gaza and possible talks between Trump and Putin are boosting demand for defensive assets. China's stimulus is also supporting prices. U.S. retail sales data may influence the dollar and further gold movement, but investors are cautious in anticipation of the Fed meeting.
Resistance levels: 2993, 3008
Support levels: 2891, 2956
Consolidation is being formed, regarding which, against the background of the bullish trend, two strategies can be considered:
1) resistance breakdown and consolidation above 2993 with the purpose of growth continuation
2) false breakdown of support 2981 and further growth after liquidity capture.
Regards R. Linda!

OMUSDT → Paranormal behavior. Rally readinessBINANCE:OMUSDT as a whole looks stronger than the market. After a strong rally a correction in the format of a bearish wedge is formed, subsequently the price broke the resistance and is trying to consolidate above the key support
Against the background of a weak market OM coin has good prospects as technically someone is interested in this project and the coin as a whole behaves strongly and looks stronger than the market.
A breakout of the bearish wedge (consolidation pattern within the correction) is forming. If the bulls keep the coin above the previously broken figure resistance and above the base of the 6.752 reversal pattern, the growth may continue in the short to medium term
Resistance levels: 7.39, 7.98
Support levels: 6.752, 6.51
One of the few coins that is rising while bitcoin is falling. Focus on the previously mentioned support levels, as well as on the local resistance 7.05, the break of which may provoke a prolongation of growth
Regards R. Linda!

GBPUSD → Consolidation after a trend breakout. Long-Squeeze?FX:GBPUSD may test the local support amid the pre-news correction of the DOLLAR. Traders are waiting for inflation data, high volatility is possible
The fundamnetal situation is predisposed in favor of the pound sterling, which has an advantage on the back of the falling dollar, which is likely to take a medium-term position on the back of the Trump administration.
Technically, GBPUSD is consolidating above the key support zone of 1.286 - 1.280 below which a huge pool of liquidity has formed which could be tested before the trend continues.
Important news ahead. Traders are waiting for CPI data. High volatility is possible
Resistance levels: 1.2938 (trigger)
Support levels: 1.2868, 1.281, 1.2728
Bulls may be aggressive and keep the price from correcting downwards. In this case, price consolidation above 1.2938 could be a good entry point for the continuation of growth. But because of the upcoming news, I would prefer to wait for a retest of the liquidity zone 1.2868 - 1.281 before taking action to open a position.
Regards R. Linda!

NZDJPY → Attempting to change the downtrendFX:NZDJPY is trying to get out of the downtrend by breaking the channel resistance. Against the background of local strengthening of the dollar, the currency pair has all chances.
Technically, buyers are starting to gain momentum and support the market, it can be seen on the background of locally growing minmiums, which gradually leads to the breakout of the channel resistance. The trigger in our case is the resistance 85.240 - a key level that divides the market into 2 planes.
If the bulls are able to consolidate above 85.240, an impulse to 86.13, then 86.88 may be formed in the short-term.
Support levels: 84.500, 84.00
Resistance levels: 85.240, 86.13
Initial testing of the trigger may end in a small pullback due to liquidity formed above. The pullback may be directed towards the previously broken channel resistance. But the emphasis is on price consolidation above 85.240, as this will be a prerequisite that the bulls are holding the market in the moment and are ready to keep going up.
Regards R. Linda!

EURAUD → False breakout & Pin-Bar on W1FX:EURAUD is testing important resistance from the weekly timeframe. A false breakout is formed after liquidity capture. There is no potential for continuation of growth and the chart is drawing everyone's favorite “pin-bar”
After the price exits the consolidation, the resistance of which was the level of 1.6787, a distributive pattern is formed, the target of which was the liquidity behind the weekly resistance of 1.7196.
The target has been reached and the price is consolidating below the base of the reversal structure and thus preparing to continue falling. It is possible formation of liquidation or downward impulse to 1.71 - 1.70. The forex market has been behaving calmly since the opening of the week and the market can work out technical nuances calmly, until the fundamental factors are connected.
Resistance levels: 1.7196 - 1.7304
Support levels: 1.7107, 1.7016
Zones of interest are located behind the local lows, but from a technical point of view, the market is most interested in liquidity beyond 1.6787 and there are all chances to reach this zone, as there are no obstacles below 1.7016. Accordingly, when the support at 1.7016 is broken, a free zone will open up
Regards R. Linda!

EURCHF is starting to turn upLooks like a trend reversal at last.
1. Strong pinbars from the levels below 0.92 that rob the stops.
2. A broken trend line, higher lows, higher highs
3. it is currently at a very important level,we are watching how it will react and whether it will be overcome.
4. We are now long on a larger time frame.

Tue 18th Mar 2025 BTC/USD Daily Forex Chart Buy SetupGood morning fellow traders. On my Daily Forex charts using the High Probability & Divergence trading methods from my books, I have identified a new trade setup this morning. As usual, you can read my notes on the chart for my thoughts on this setup. The trade being a BTC/USD Buy. Enjoy the day all. Cheers. Jim

The game plan is clear: DCA,accumulate, and let the market work!HKEX:2800
Breakthrough downtrend channel on last Sept2024 and W-Chart formed MACD Goldencross for bullish mode.
If enter now at 24.50
Target Profit 1 Level at : 30.70 (~25.3%)
Target Profit 2 @33.50; another ~9% (cumulative + ~36%)
Target Profit 3 : ATH
Continue to DCA and accumulate; you may wait for slight retracement to add position. 24.26
Time frame : 9-24months
It created higher hi recently for W chart.
🔎 DYODD and don't listen to anyone. Invest in yourself, do some study and learn along the way while you trying to verify or finding the answer if to start invest in CHN/HKG markets.
Follow your trade plan then zen with 📙 and 🍵 while waiting for profits to be reazlied.
** Please Boost 🚀/LIKE 👍, FOLLOW ✅, SHARE 🙌 and COMMENT ✍ if you enjoy this idea! Share your trading journey to encourage the trading buddies.

Mon 17th Mar 2025 AUD/CHF Daily Forex Chart Buy SetupGood morning fellow traders. On my Daily Forex charts using the High Probability & Divergence trading methods from my books, I have identified a new trade setup this morning. As usual, you can read my notes on the chart for my thoughts on this setup. The trade being a AUD/CHF Buy. Enjoy the day all. Cheers. Jim

Mon 17th Mar 2025 GBP/CAD Daily Forex Chart Sell SetupGood morning fellow traders. On my Daily Forex charts using the High Probability & Divergence trading methods from my books, I have identified a new trade setup this morning. As usual, you can read my notes on the chart for my thoughts on this setup. The trade being a GBP/CAD Sell. Enjoy the day all. Cheers. Jim

AUDNZD strong bullish expectations
AUDNZD pair which I am watching last 5 months, other my analysis on AUDNZD are attached, plus I am attach and CADCHF analysis its interesting to look, its almost same based on SYMMETRICAL TRIANGL.
AUDNZD price is make bounce on trend line, its break upper trend line-SYMMETRICAL TRIANGL, plus CHANNEL on 4h TF is visible and its also breaked.
Technicalls on medium and long term are strong bullish, when take all this parameters i am here still bullish.
SUP zone: 1.09200
RES zone: 1.11500, 1.12400

DEGOUSDT → An attempt to change the trend will end in a fallBINANCE:DEGOUSDT.P tried to break the trend, but faced strong resistance and a weak cryptocurrency market. The fall may continue...
After breaking through the resistance of the descending channel, a bullish momentum (distribution) of 45% is formed, but the price bumps into a strong resistance of 2.11 - 2.18, which forms a trading range. Bears are not ready to give this zone to buyers and put pressure, a false breakout of resistance is formed after a long struggle for this zone and liquidation is formed when the base of 2.0 is broken. Buyers are in the panic zone. If the price fixes below 2.11 - 2.18, the fall in the short or medium term may continue.
Resistance levels: 2.00, 2.18, 2.274
Support levels: 1.75, 1.584, 1.359
The market is generally weak and altcoins are reacting aggressively to local bitcoin movements (the point of which is to gather liquidity before a further fall). BTC has not yet reached a key target, which together with the lack of a bullish driver in the market creates pressure for altcoins.
Regards R. Linda!

GOLD → Distribution phase. One step away from $3000. Up!FX:XAUUSD breaks upward and reaches the intermediate target. After strong growth there is no pullback at all. A consolidation is forming which shows us strong levels.
Gold updates ATH to +2990, preparing to overcome $3,000. Growth is being fueled by Trump's trade war and expectations of a Fed rate cut. Investors are cautious ahead of the Fed meeting. A stronger dollar and hopes for a US-Canada trade truce may temporarily cause a correction, but it is not the strongest factor. However, recession risks and escalation of trade and geopolitical conflicts may increase demand for protective assets, supporting the growth of gold prices
Technically, the price is in consolidation, relative to which there may be a breakthrough of resistance and further growth. Or a local false breakout, correction to support at 2980 and continuation of growth after support retest
Resistance levels: 2993, 3000, 3008
Support levels: 2981, 2956
Thus, if the bulls are able to consolidate above 2993, the price may continue its aggressive growth.
BUT! There is a possibility of correction to the risk (liquidity) zone 2981 - 2977 before gold resumes its growth.
Regards R. Linda!

GOLD → Testing ATH. High chance of a breakout 2954FX:XAUUSD in the distribution phase of the previously formed consolidation. The price is testing ATH and the market has all chances for a breakout and further update of the high. We are close to 3K
Gold price continues to rise, approaching a record high of $2,956, amid fears of a global trade war. Lower US inflation has weakened the dollar and bond yields, boosting demand for gold. Markets now await PPI data, but escalating trade conflict remains key.
Technically, gold is testing global range resistance a month after last touching it. I don't like to trade primary breakouts in such a case and the ideal scenario would be to wait for a small consolidation near the level or a correction to 2945 - 2935 before the metal starts to tetse 2954.5 for a breakout
Resistance levels: 2954.5
Support levels: 2945, 2935, 2930
As a first move I expect a pullback after resistance test. A retest of 2954.5 (retest) will mean that buyers are ready to break the resistance and go higher.
BUT, we have important news today. Gold could break the level without a pullback. A close above 2954.5 will trigger a rally.
Regards R. Linda!

GOLD → Retest of 2926 before a possible breakout. CPI aheadGold is rising after long-squeeze and consolidating at the top of the 2926 - 2893 range, which is generally a hint that the market is getting ready to break resistance. But it all depends on CPI
Traders awaiting US CPI data. The dollar is partially recovering before the news, which is holding back gold, which continues to consolidate in front of 2921, but weak inflation data may push prices up again.
New trade measures as part of Trump's tariff war and geopolitical tensions are having an additional impact. The negative part for the markets presents the lack of a clear position of the leaders of the countries and constantly changing opinions: then they specify tariffs, then cancel them. Inadequate swings in the markets.
Resistance levels: 2920, 2926
Support levels: 2910, 2905, 2893
Emphasis on 2926, breakdown of this level will trigger a bullish rally. Now the price is trying to get out of the local consolidation to test 2926, from which a small correction is possible before another breakout. The focus on CPI, weak data may support further price growth.
Regards R. Linda!

QUICKUSDT → Pending a false breakout of resistanceBINANCE:QUICKUSDT is forming counter-trend movement to the resistance of the range - 0.02957. A false breakdown of the key level is formed against the background of the downtrend
The cryptocurrency market is experiencing bad times. While bitcoin is testing new lows - 76K, altcoins are cutting through to find another bottom.
QUICK stands out in this picture, testing a strong resistance (liquidity) zone 0.02845 - 0.02957 and forming a false breakout.
BUT! in the morning session bitcoin strengthens after a strong fall and can pull the whole market up with it. Thus, before the further fall another attempt to retest 0.02953 or update the tail of the false breakout at 0.03000 (0.7fibo) is possible.
Resistance levels: 0.0285, 0.02953, 0.0300.
Support levels: 0.0243, 0.02118
If the next resistance retest ends in a false breakdown and price consolidation under 0.02957, QUICK coin may continue its decline in the short and medium term.
Regards R. Linda!
